Discover and read the best of Twitter Threads about #GeoSpatial
Most recents (24)
Learning data science on your own is tough...
...(ahem, it took me 6 years)
So here's some help.
5 Free Books to Cut Your Time In HALF.
Let's go! 🧵
#datascience #rstats #R
...(ahem, it took me 6 years)
So here's some help.
5 Free Books to Cut Your Time In HALF.
Let's go! 🧵
#datascience #rstats #R
1. Mastering #Spark with #R
This book solves an important problem- what happens when your data gets too big?
For example, analyzing 100,000,000 time series.
You can do it in R with the tools covered in this book.
Website: therinspark.com
This book solves an important problem- what happens when your data gets too big?
For example, analyzing 100,000,000 time series.
You can do it in R with the tools covered in this book.
Website: therinspark.com

2. Geocomputation with #R
Interested in #Geospatial Analysis?
This book is my go-to resource for all things geospatial.
This book covers:
-Making Maps
-Working with Spatial Data
-Applications (Transportation, Geomarketing)
Website: r.geocompx.org
Interested in #Geospatial Analysis?
This book is my go-to resource for all things geospatial.
This book covers:
-Making Maps
-Working with Spatial Data
-Applications (Transportation, Geomarketing)
Website: r.geocompx.org

Today, BF launches a new investigation on the deadly effects of border control in Niger. Over the past year we investigated the relation between bordering practices, spatial shifts in migrant trajectories and increased danger of crossing Niger’s Saharan desert.
A thread 🧵
A thread 🧵
In 2015, with the support of the European states and agencies, #Niger adopted a new Law on illegal trafficking of migrants. Law 2015-36 establishes new forms of #border control with the aim of thwarting #migration across Northern Niger to Libya. 

Tutorial thread Blender 3-D Population Density👥📊🗺️Maps through @KonturInc using #QGIS and #Blender....#esri users you can follow along too because it can be done in your software too #gischat #thread #geospatial 


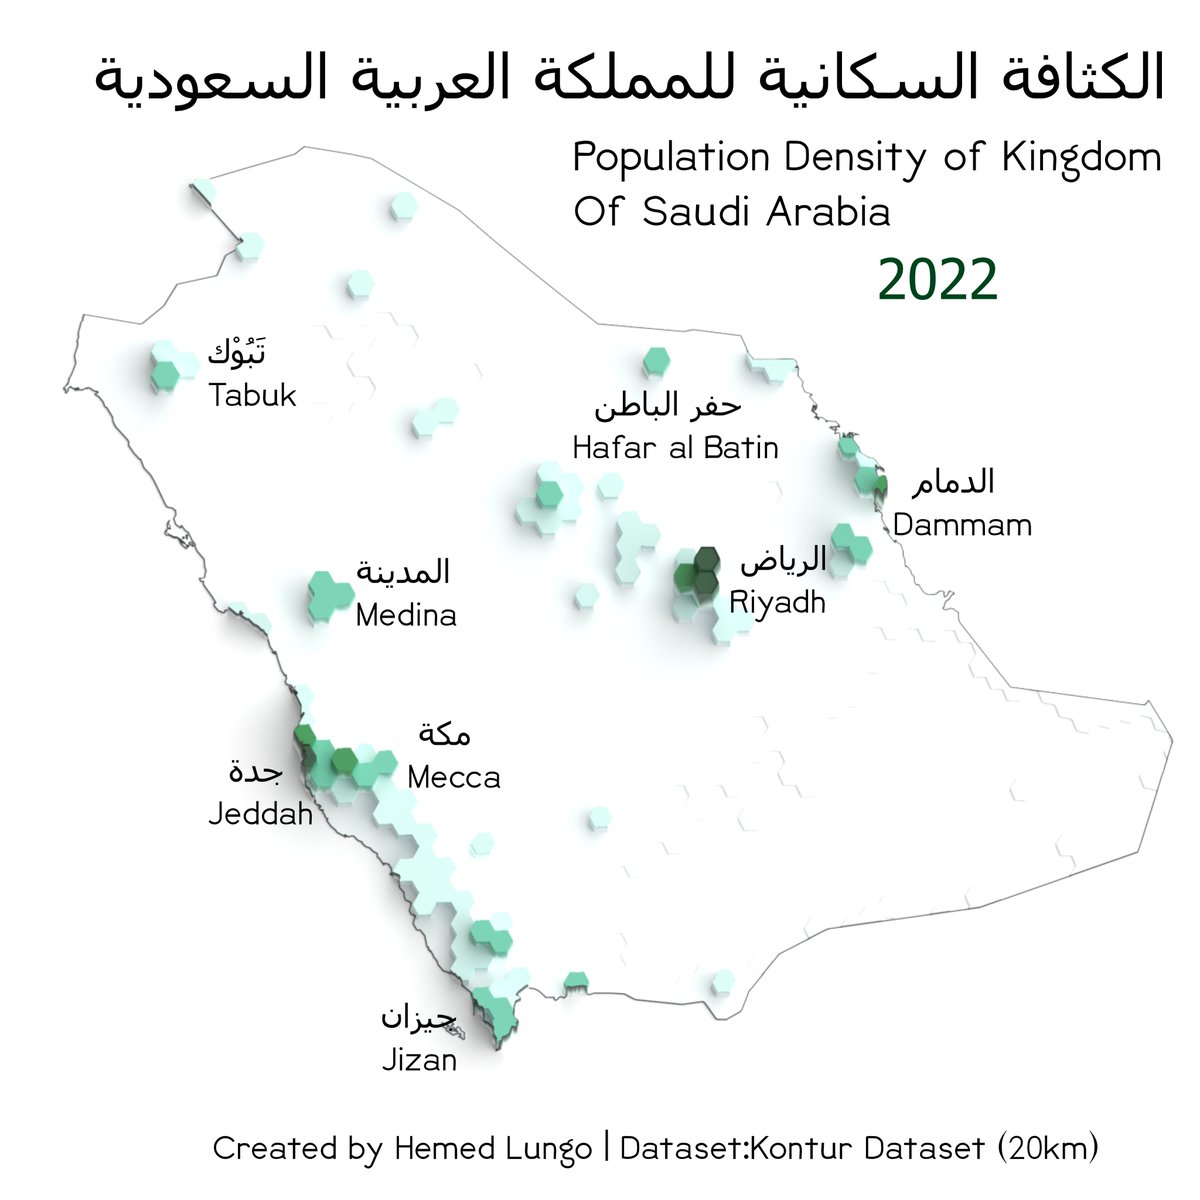
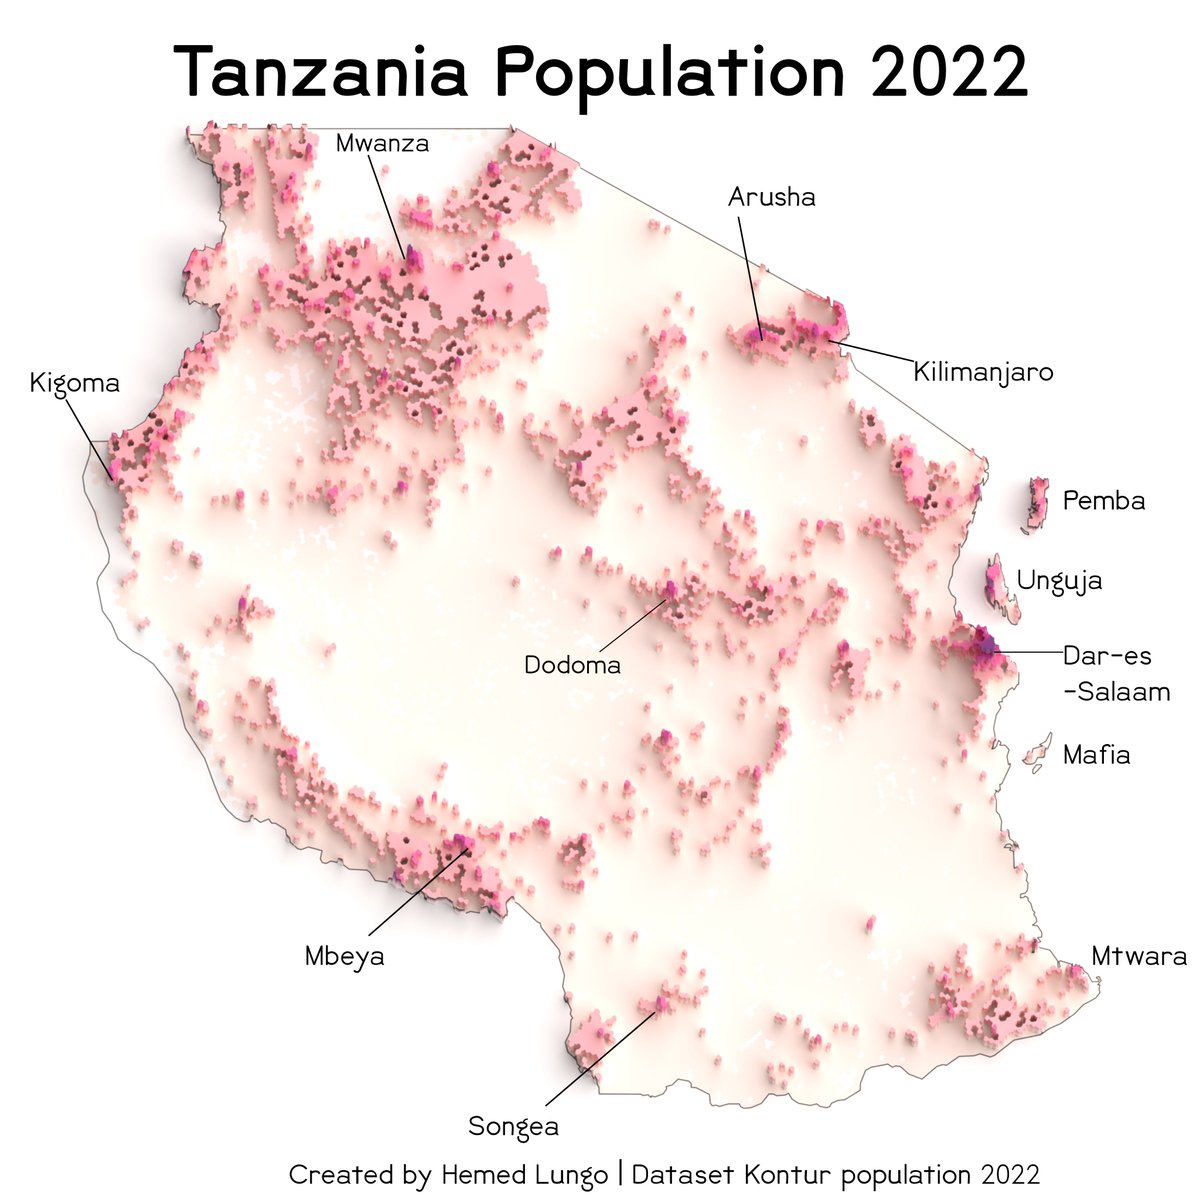
So I would divide this tutorial into four parts
1. Data Gathering(with @KonturInc )
2. QGIS(Black map and Color Map)
3. Rendering in Blender(No geometry nodes)
4. QGIS or other softwares (final touches)
1. Data Gathering(with @KonturInc )
2. QGIS(Black map and Color Map)
3. Rendering in Blender(No geometry nodes)
4. QGIS or other softwares (final touches)
So @KonturInc is a really good geospatial data provider together with risk management solution provider who deal with a lot of things as shown in link below But we will focus today on Their wonderful population data
kontur.io
kontur.io
Tutorial thread Blender 3-D Maps🏔️🗺️🧵: In this tutorial I'm going to show how you can also create 3-D Maps like the one shown below. Using #QGIS and #Blender....#esri users you can follow along too because it can be done in your software too #gischat #thread #geospatial 


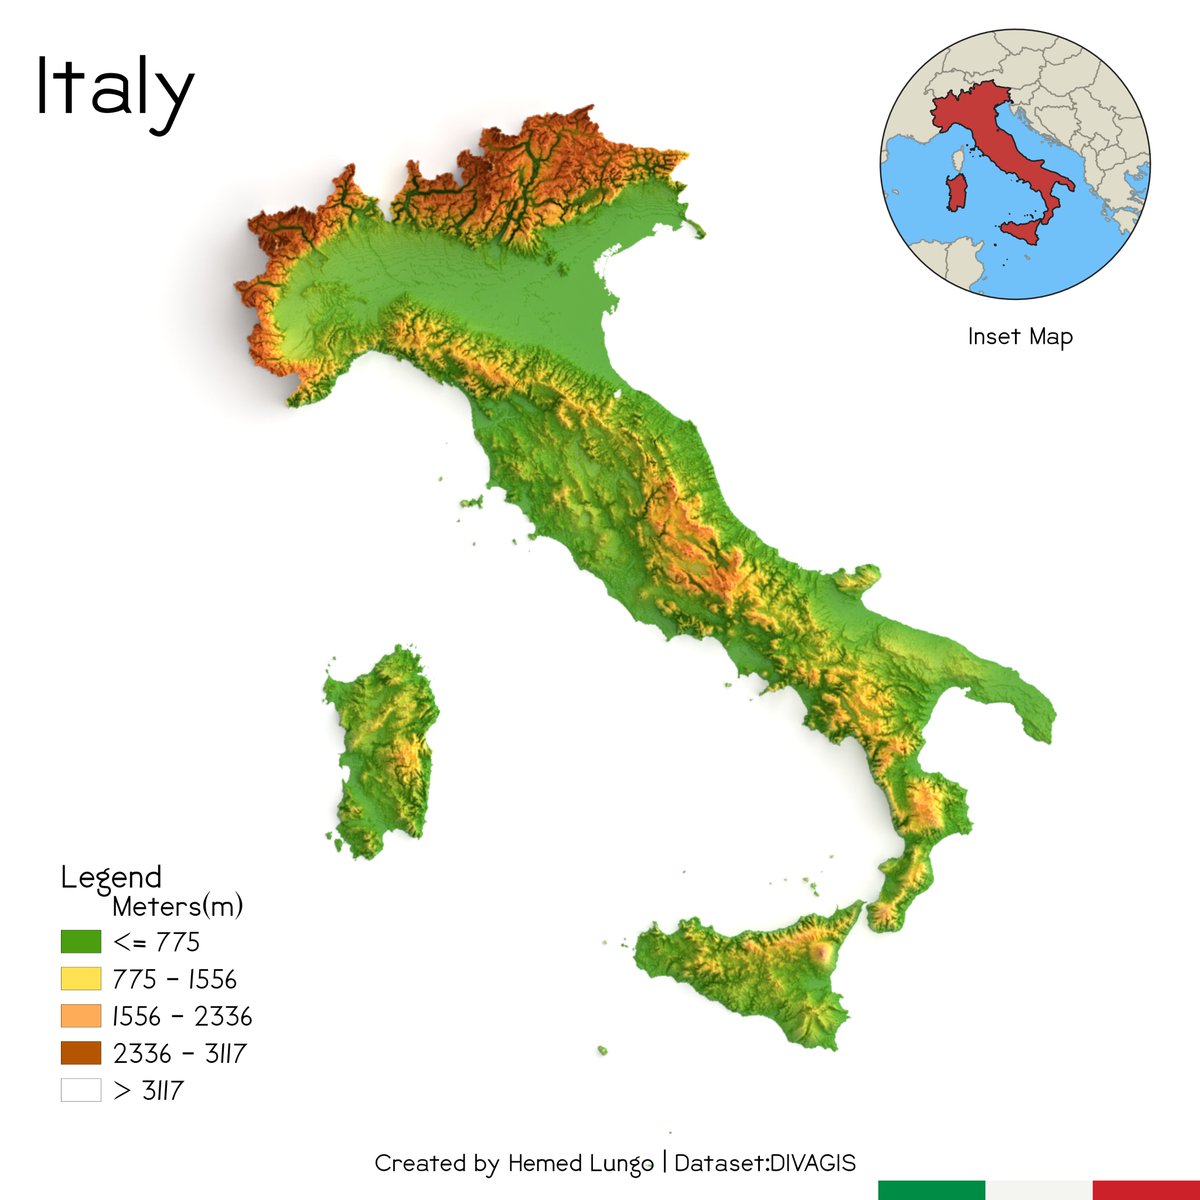


So I would divide this tutorial into four parts
1. Data Gathering(with @OpenTopography ) or DIVA
GIS
2. QGIS(Black map and Color Map)
3. Rendering in Blender(No geometry nodes)
4. QGIS or other softwares (final touches)
1. Data Gathering(with @OpenTopography ) or DIVA
GIS
2. QGIS(Black map and Color Map)
3. Rendering in Blender(No geometry nodes)
4. QGIS or other softwares (final touches)
1. In data gathering I normally use @OpenTopography to download the DEM required for blending/rendering .....the 90m and 30m and 10m are key consideration when downloading dem for instance in small area 30m works well but in large areas 90m works best....
Revolutionizing the World: 20 AI & Machine Learning Startups You Need to Know. 🧵...
1/20: In this thread i will try and explore the fascinating world of AI and machine learning startups! Discover some of the most innovative companies pushing the boundaries in this space. #AIStartups #MachineLearning
Compressed image formats are a great way to reduce file size without sacrificing image quality. There are several compressed image formats that are commonly used in GIS (Geographic Information System) applications. #gischat #geospatial #gis
ECW (Enhanced Compression Wavelet) is a proprietary compressed image format developed by ERDAS. It's commonly used for compressing large raster images, such as satellite imagery and aerial photography. ECW files can be handled by software ArcGIS, Global Mapper, and ERDAS Imagine.
MrSID (Multiresolution Seamless Image Database): LizardTech's proprietary format that is similar to ECW. It's commonly used for compressing large raster images and can be handled by software such as ArcGIS and Global Mapper.
Here is a more comprehensive list of plugins for land use and land cover (LULC) analysis in QGIS. The selection of plugins depends on the specific research question and the type of data available. #gischat #geospatial #GIS #LULCanalysis #QGIS
Semi-Automatic Classification Plugin (SCP): This plugin provides a user-friendly interface for supervised and unsupervised classification of remote sensing images. It includes a wide range of classification algorithms.#gischat #geospatial #GIS #LULCanalysis #QGIS 

Land Cover Classification System (LCCS): This plugin allows users to classify land cover based on a standardized classification system developed by the FAO. It includes a set of rules and guidelines for classifying land cover.#gischat #geospatial #GIS #LULCanalysis #QGIS 

Remote sensing (RS) software tools can help you analyze and interpret satellite or airborne data. If you're on a tight budget, don't worry - there are plenty of great free options out there!#gischat #geospatial
#QGIS is a powerful and user-friendly open-source #GIS software that includes RS tools. You can use it to visualize, analyze, and process your RS data. It supports a wide range of file formats and has an active community.#gischat #geospatial
qgis.org/en/site/foruse…
qgis.org/en/site/foruse…

Sentinel Application Platform is a free, multi-platform tool for processing and analyzing data from various RS sensors, including Sentinel-1, Sentinel-2, and Sentinel-3. It includes a user-friendly GUI and a powerful toolbox. @esa #gischat
step.esa.int/main/download/…
step.esa.int/main/download/…

Machine Learning (ML) algorithms have revolutionized spatial analysis, providing new insights into geographic data. Here's a list of popular ML algorithms used in #geospatial #DataScience
#DataScience #MachineLearning #SpatialAnalysis #gischat
#DataScience #MachineLearning #SpatialAnalysis #gischat
K-means clustering is a popular unsupervised ML algorithm used for clustering and segmentation of spatial data. It's used to identify spatial patterns, group similar geographic features, and create thematic maps.
Random Forests is a supervised ML algorithm used for classification and regression tasks in Geospatial Data Science. It's used to predict land use, soil properties, and other geographic variables.
🌎 ¡Acabo de encontrar una serie de mapas increíbles realizados con #RStats! Desde mapas interactivos hasta diseños 3D, hay algo para todos los amantes de los datos espaciales
👇 ¡8 cuentas a las que definitivamente vale la pena darle un vistazo!🧵
#dataviz #maps #geospatial #gis
👇 ¡8 cuentas a las que definitivamente vale la pena darle un vistazo!🧵
#dataviz #maps #geospatial #gis
✅ Tyler Morgan-Wall @tylermorganwall
🔗 buff.ly/3ZBWNKe
Mapa 3D giratorio con puntos de luz (mapa anterior)
🔗 buff.ly/3QDfXLx
La red de cable submarino de fibra óptica de la Tierra.
Utiliza #rayshader #rayrender #rayverse
#dataviz #maps #geospatial #gis
🔗 buff.ly/3ZBWNKe
Mapa 3D giratorio con puntos de luz (mapa anterior)
🔗 buff.ly/3QDfXLx
La red de cable submarino de fibra óptica de la Tierra.
Utiliza #rayshader #rayrender #rayverse
#dataviz #maps #geospatial #gis
@tylermorganwall ✅ Milos Popovic @milos_agathon
🔗 buff.ly/3CJM6LN
Mapa % de empleados en la fabricación, datos Eurostat.
#dataviz #maps #geospatial #gis #rstats #DataVisualization #stats #DataScience
🔗 buff.ly/3CJM6LN
Mapa % de empleados en la fabricación, datos Eurostat.
#dataviz #maps #geospatial #gis #rstats #DataVisualization #stats #DataScience

Your #geospatial portfolio is proof that you know & understand #GIS concepts, so how do you build one?
If you are wondering what kinds of projects you can do to populate your geospatial portfolio and also gain knowledge as you do them.
Do not look too far, open this thread.
🧵
If you are wondering what kinds of projects you can do to populate your geospatial portfolio and also gain knowledge as you do them.
Do not look too far, open this thread.
🧵
The fundamental thing about projects in GIS terrain is that all your project must have a study area. A study area is a place within the earth surface that you choose to perform your analysis on. E.g Landslide Susceptibility mapping in "South Eastern Nigeria...
South east is my study area here.
So, all your projects must have that and that's at your discretion.
Now let's dive in ✈️
So, all your projects must have that and that's at your discretion.
Now let's dive in ✈️
Tutorial Thread🧵 on how to create Climate maps using R Language specifically ClimateR🌧️🌤️ package created by Mike Johnson...In this tutorial I'm going to use The Kingdom of Saudi Arabia 🇸🇦#gischat #cartography #GIS #geospatial #Remotesensing #dataviz #R #rspatial #mapping
So At first Climate R is package created specifically to deal with climate illustration ......So in order to get it working you have to Have Remote package already and you have to Install Using the codes below. 

So after that were going prepare the Tempreture illustration in which they are three ways of illustrating Mean Tempreture(One map),Annual Tempreture(Mutiple Maps) and Monthly Tempreture.
“Interested in sustainable energy and energy transitions?
My research group—Energy Technology and Policy Assessment—is looking for graduate students (master’s and PhD) and postdoctoral scholars interested in #lifecycleassessment (LCA), technoeconomics, and innovation. McGill
My research group—Energy Technology and Policy Assessment—is looking for graduate students (master’s and PhD) and postdoctoral scholars interested in #lifecycleassessment (LCA), technoeconomics, and innovation. McGill
Civil Engineering is an excellent program for sustainable energy, spanning electricity, transportation, and environment (including collaborative, interdisciplinary opportunities across engineering departments and campus). ETAPA research is in line with #TISED goals for
sustainability in engineering and design. Undergraduate research assistantships will also be available.
Present student/postdoc opportunities focus on:
♻ LCA of #transportation in Peru and Canada
♻ Land use impacts of electricity and energy #infrastructure, USA, Canada,
Present student/postdoc opportunities focus on:
♻ LCA of #transportation in Peru and Canada
♻ Land use impacts of electricity and energy #infrastructure, USA, Canada,
Embarrassed by your #R code?
Here are 4 mistakes beginner R coders make AND how to avoid them.
#rstats #datascience
Here are 4 mistakes beginner R coders make AND how to avoid them.
#rstats #datascience

The reality is you aren't going to become a master R programmer over night.
But I see beginners making the same mistakes time and time again.
And they are easy to correct.
Here are the 4 most common mistakes and how to easily correct them.
But I see beginners making the same mistakes time and time again.
And they are easy to correct.
Here are the 4 most common mistakes and how to easily correct them.
1. Not using comments
This is a huge no-no.
Why?
Because comments help others understand your code INCLUDING future you.
This is a huge no-no.
Why?
Because comments help others understand your code INCLUDING future you.
I want to take a little time to discuss how we, @sparkgeo, consider the future geospatial market. I have been using a few tools to help me talk about ideas with my team: a strategic common language is really helpful. #strategicgeospatial
I share this content with my entire team. It’s critical we know what our purpose is, and why we are doing what we do. None of these tools solve anything, but they help us order complexity and see patterns. #strategicgeospatial
2021-2022 Economic Survey (ES) uses remote sensing and #geospatial data ‘to track, compare
and represent longer term developments’. But when using remote sensing data, proper calibration, validation and visualisation are necessary. Else the data can be very misleading. 🧵
1/13
and represent longer term developments’. But when using remote sensing data, proper calibration, validation and visualisation are necessary. Else the data can be very misleading. 🧵
1/13
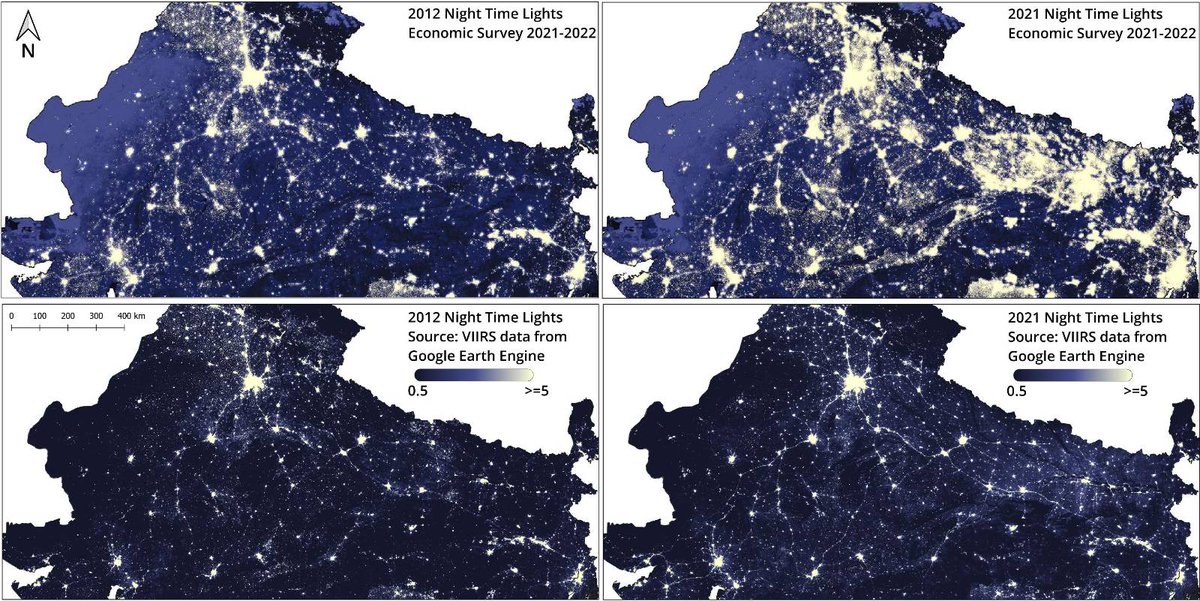
ES states that comparison of night time lights (NTL) between 2012 and 2021 provides “..an interesting representation of the expansion of electricity supply..” apart from distribution of population, economic activity and ribbon developments.
2/13
2/13
But do the maps make sense? More than representing expansion of electricity, the maps represent the challenges of visualising satellite data. NTL data contains radiance values. The min and max radiance values used for visualisation can dramatically change the interpretation.
3/13
3/13
Happy New Year🎆 You can now create sea surface temperature timelapse with a colorbar using the #streamlit web app in <60 seconds 👇
App: streamlit.gishub.org
GitHub: github.com/giswqs/streaml…
#EarthEngine #geemap #eochat #gischat #oceancolor #dataviz #geospatial
App: streamlit.gishub.org
GitHub: github.com/giswqs/streaml…
#EarthEngine #geemap #eochat #gischat #oceancolor #dataviz #geospatial
Here is a demo using the @streamlit web app for creating ocean color timelapse with #MODIS Aqua data @chris_harrod
Keep in mind that you can create timelapse by selecting a yearly, quarterly, weekly, or daily frequency
Displaying a #CesiumJS 3D map in a #streamlit web app or #Jupyter notebook with only one line of code. Try it out 👇
Web app: streamlit.gishub.org
GitHub: github.com/giswqs/streaml…
#leafmap #geospatial #mapping #dataviz
Web app: streamlit.gishub.org
GitHub: github.com/giswqs/streaml…
#leafmap #geospatial #mapping #dataviz
Displaying a #CesiumJS 3D map in a #Jupyter notebook, inspired by @banesullivan 's localtileserver package.
leafmap.display_html(src, width, height)
leafmap.org/common/#leafma…
leafmap.display_html(src, width, height)
leafmap.org/common/#leafma…
Displaying a #CesiumJS 3D map in a #streamlit web app.
leafmap.cesium_to_streamlit(html, width, height)
leafmap.org/common/#leafma…
leafmap.cesium_to_streamlit(html, width, height)
leafmap.org/common/#leafma…

An interactive web app for creating timelapse from #GOES #weather satellites. Built with #streamlit #geemap #EarthEngine. Go to streamlit.gishub.org and select "Create Timelapse" from the sidebar menu.
GitHub: github.com/giswqs/streaml…
#dataviz #eochat #geospatial #wildfire
GitHub: github.com/giswqs/streaml…
#dataviz #eochat #geospatial #wildfire
Bomb Cyclone on 2021-10-24
Creek Fire, CA on 2020-09-05
1 / We’re proud to officially release our #SAR Open Data Program to the world. Our goal of the program is to build a community where academia, researchers and engineers develop applications to tackle humanity’s biggest challenges with #geospatial data 👉capellaspace.com/gallery/ 

2 / #EarthObservation is impacted by cloud coverage and nighttime. We compiled 24/7 all-weather SAR data across multiple use cases, geographies and data products for our Open Data Program — Learn how to access them here: capellaspace.com/capella-space-…
3 / A few #OpenData examples: #Deforestation in South America is opaque, and traditional #satellite Imagery is obscured by cloud coverage in Earth’s Equatorial regions. In our Stripmap mode, analysts can identify naturally occurring vegetation vs cleared forest & infrastructure 

Another open-source geospatial analysis platform is coming soon. Exciting time 🤩📣👇
The ESA-NASA Joint Multi-Mission Algorithm and Analysis Platform (MAAP)
scimaap.net
#opensource #geospatial #gischat #remotesensing #nasa #esa #geopython
The ESA-NASA Joint Multi-Mission Algorithm and Analysis Platform (MAAP)
scimaap.net
#opensource #geospatial #gischat #remotesensing #nasa #esa #geopython

More info: earthdata.nasa.gov/esds/maap
Late Lee Kuan Yew was right when he said that new businesses require new skills, which in return require more vocational and academic training for the workforce.
Any country aspiring to follow the Asian model of economic development must invest in human capital formation.
Any country aspiring to follow the Asian model of economic development must invest in human capital formation.
Hong Kong under the British, UAE, and Singapore are 3 perfect examples of how certain nations can arbitrage on the inefficiencies which exist in their neighbourhoods.
All three examples serve as a binding case study in #Geospatial #Economics and complex #Agglomeration Benefits
All three examples serve as a binding case study in #Geospatial #Economics and complex #Agglomeration Benefits
Look at the #City, in the UK!
Are the English-born bankers?
How did they manage to develop a major global financial centre over the last two hundred years?
Let's see how Brexit will affect the mystique which surrounds London as a major financial hub
Are the English-born bankers?
How did they manage to develop a major global financial centre over the last two hundred years?
Let's see how Brexit will affect the mystique which surrounds London as a major financial hub
Kaggle Notebooks: Hidden Gems - Vol. 31
A weekly series aspiring to showcase underrated Kaggle Notebooks along with the diversity and creativity of our community.
Check it out on @Kaggle:
kaggle.com/general/202145
#KaggleHiddenGems
A weekly series aspiring to showcase underrated Kaggle Notebooks along with the diversity and creativity of our community.
Check it out on @Kaggle:
kaggle.com/general/202145
#KaggleHiddenGems
"Adversarial Rainforest" by @tunguz:
A compact work providing adversarial validation of the rainforest competition data together with interpretable Shapely values via GPU-powered #XGBoost in the @RAPIDSai framework.
kaggle.com/tunguz/adversa…
A compact work providing adversarial validation of the rainforest competition data together with interpretable Shapely values via GPU-powered #XGBoost in the @RAPIDSai framework.
kaggle.com/tunguz/adversa…
"EDA Google SunRoof w/ Beautiful Choropleths & Maps" by Bukun:
This exploratory analysis presents a variety of visualisations, including maps, to describe and characterise a #geospatial solar panel dataset.
kaggle.com/ambarish/eda-g…
This exploratory analysis presents a variety of visualisations, including maps, to describe and characterise a #geospatial solar panel dataset.
kaggle.com/ambarish/eda-g…
I am always nervous before each and every podcast interview.
Not because I am afraid of working/ learning in public but because want to be respectful of my guest's time and create content that will give the podcast audience value.
Here are the 10 most popular podcast episodes!
Not because I am afraid of working/ learning in public but because want to be respectful of my guest's time and create content that will give the podcast audience value.
Here are the 10 most popular podcast episodes!


