Discover and read the best of Twitter Threads about #Charts
Most recents (24)
Candlestick #charts patterns is a movement in prices shown graphically on a candlestick chart that some believe can predict a particular market movement
A thread by Naren Joshi @valuelevels
🧵👇
#like & #Retweet for MAX Reach
A thread by Naren Joshi @valuelevels
🧵👇
#like & #Retweet for MAX Reach

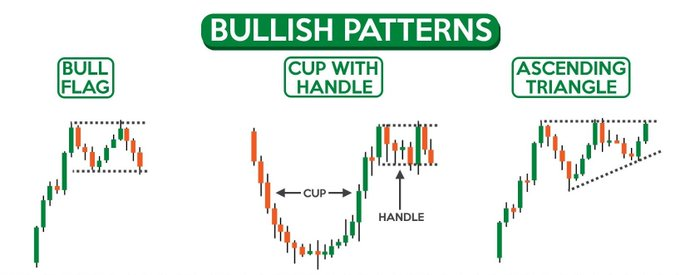
Bullish Patterns
1- BULL FLAG
2- CUP WITH HANDLE
3- ASCENDING TRIANGLE
#stocks #TradingView
#nifty #niftybank #banknifty
1- BULL FLAG
2- CUP WITH HANDLE
3- ASCENDING TRIANGLE
#stocks #TradingView
#nifty #niftybank #banknifty
BEARISH PATTERNS
1- BEAR FLAG
2- INVERTED CUP WITH HANDLE
3- DESCENDING TRIANGLE
#niftyoptions #niftyfuture
#niftytoday
1- BEAR FLAG
2- INVERTED CUP WITH HANDLE
3- DESCENDING TRIANGLE
#niftyoptions #niftyfuture
#niftytoday

[1/🧵] With all of the #XRPBuyback debate going on, there is one aspect that frequently gets misrepresented
▶️ People conflating the terms "#price" and "#value"
Because the definitions differ, it is essential to comprehend the distinctions
Let us evaluate it more closely. 👇🧵
▶️ People conflating the terms "#price" and "#value"
Because the definitions differ, it is essential to comprehend the distinctions
Let us evaluate it more closely. 👇🧵

Notion is a beast
But 98.9% of people are still unaware of the full potential of @NotionHQ.
Here are the best free 30 Notion tools 🧵 👇
But 98.9% of people are still unaware of the full potential of @NotionHQ.
Here are the best free 30 Notion tools 🧵 👇
Use Dynamic Visualisations (Graphs & Charts)
1. Customblocks: customblocks.io
2. Notion2Charts: notion2charts.com
3. Notion Charts: notioncharts.io
4. Vizydrop: notioneverything.com/tools/vizydrop
#charts #notiontwt #visualizations
1. Customblocks: customblocks.io
2. Notion2Charts: notion2charts.com
3. Notion Charts: notioncharts.io
4. Vizydrop: notioneverything.com/tools/vizydrop
#charts #notiontwt #visualizations
@NotionHQ New set of resources every 15 mins 😉
Due anni fa @BebeRexha, famosa cantante e compositrice (ha collaborato tra gli altri con #Eminem, #Rihanna, #NickiMinaj, #Pitbull, #LouisTomlinson, #geazy, #DavidGuetta, ecc.) ha detto che PER VINCERE i Grammy SI PAGA.
💰💵💳
#GRAMMYs #sony #maneskin #showbiz #billboard #charts
💰💵💳
#GRAMMYs #sony #maneskin #showbiz #billboard #charts
@BebeRexha #Grammys, parte 2 🏆
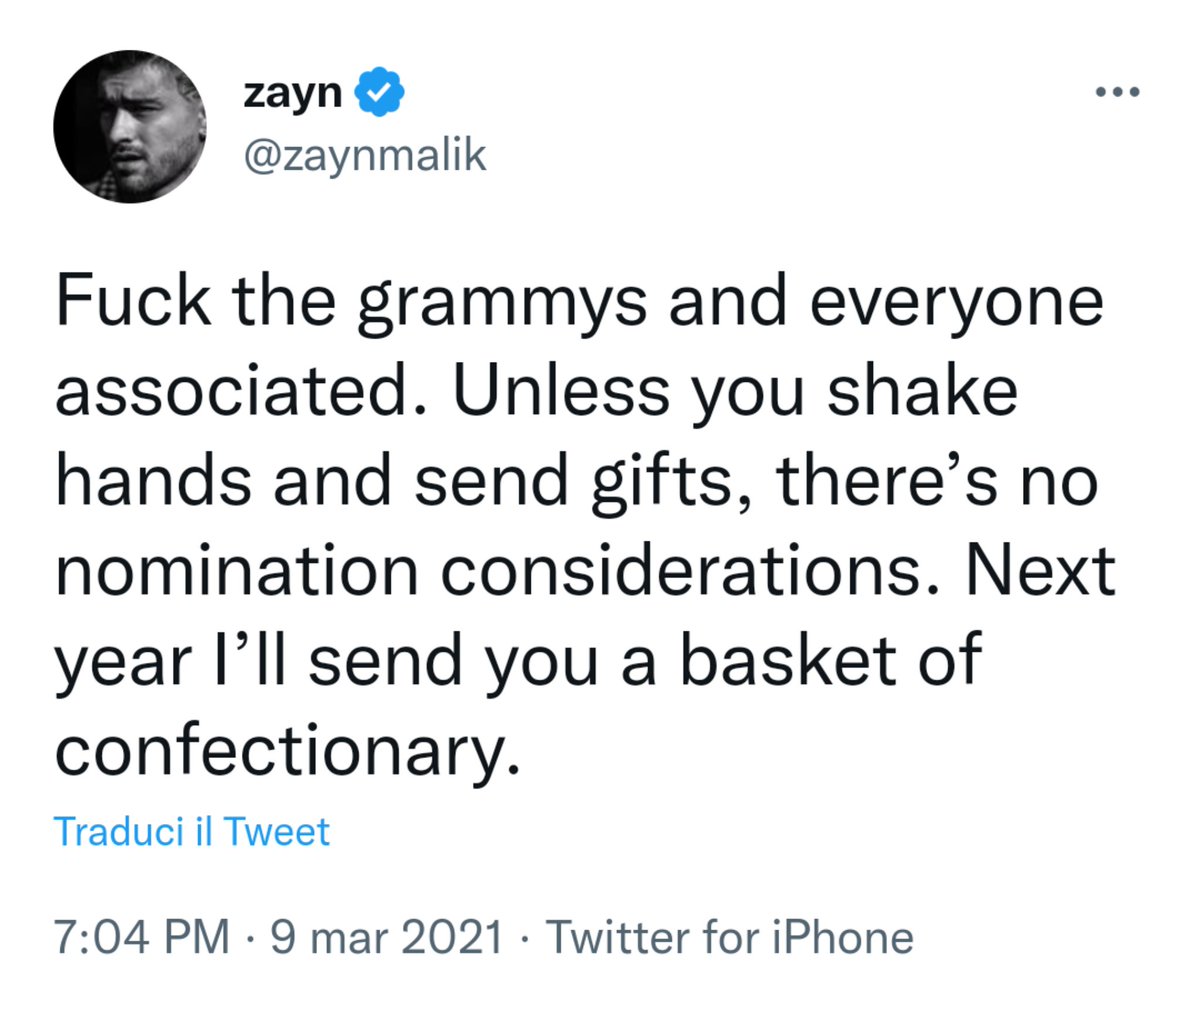
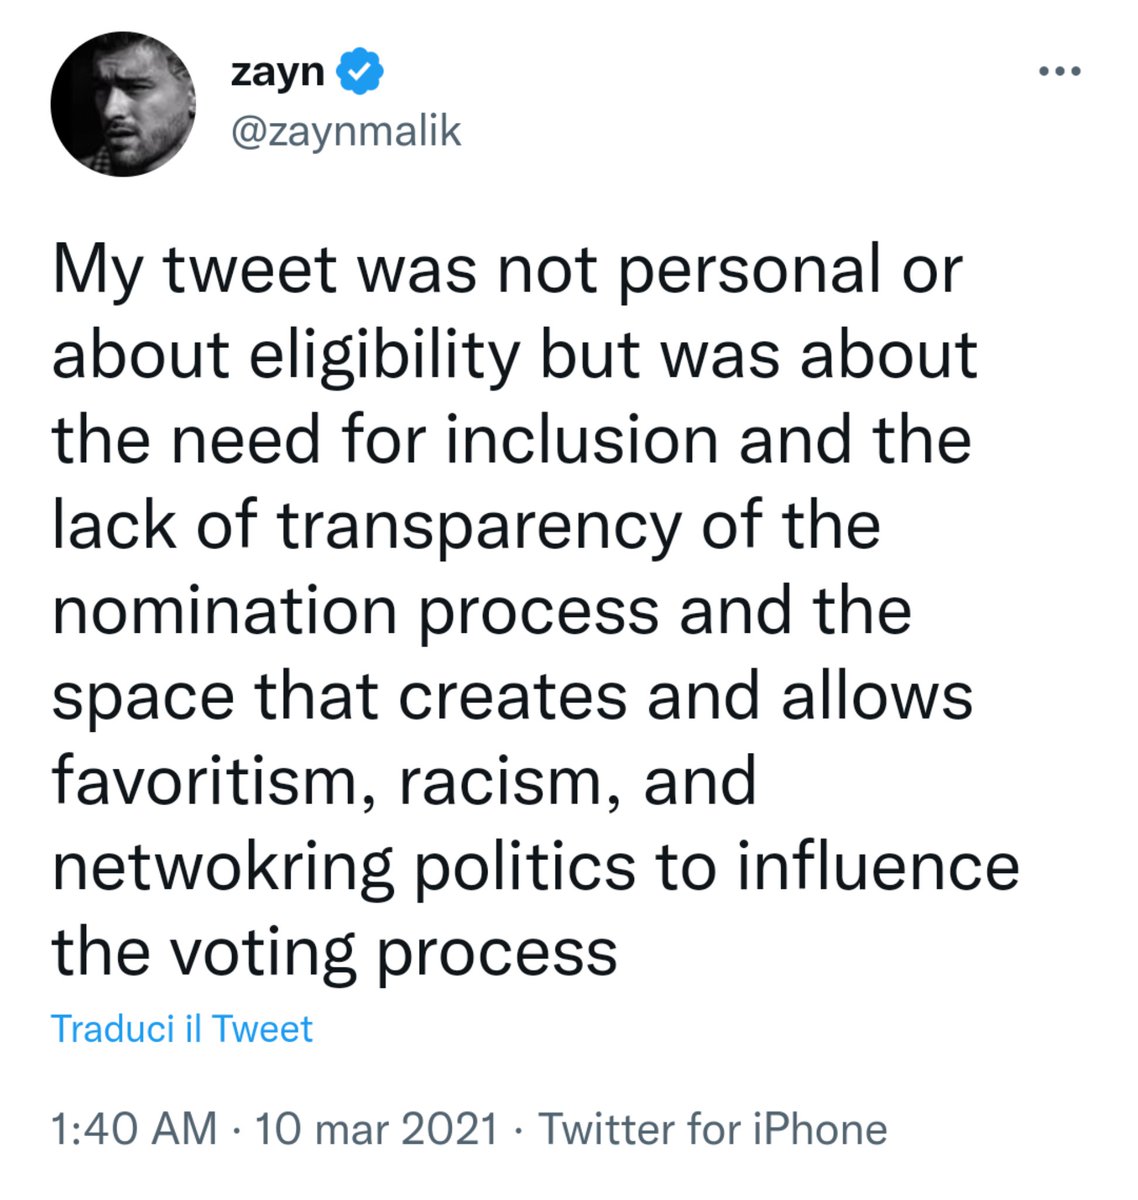
Nel 2021 @ZaynMalik, ex #OneDirection, ha parlato di razzismo, favoritismi, interferenze e mancanza di trasparenza nonché di regali e mani da stringere per ottenere le nomination ai GRAMMY.
🤝🎁🤑
#showbiz #racism #maneskin #billboard #spotify #charts

Nel 2021 @ZaynMalik, ex #OneDirection, ha parlato di razzismo, favoritismi, interferenze e mancanza di trasparenza nonché di regali e mani da stringere per ottenere le nomination ai GRAMMY.
🤝🎁🤑
#showbiz #racism #maneskin #billboard #spotify #charts
@BebeRexha @zaynmalik #Grammys, parte 3 🏆
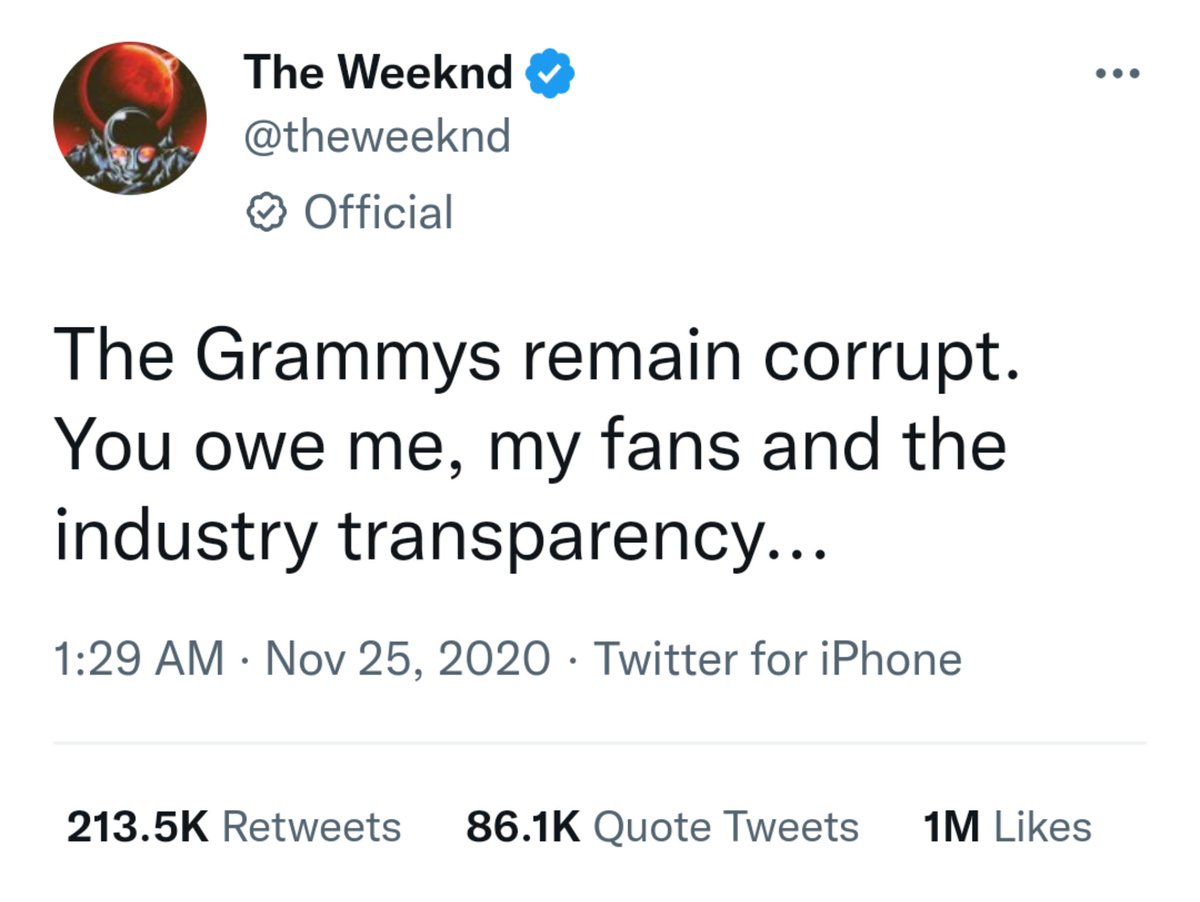
Dopo le accuse di corruzione e "comitati segreti" da parte di @theweeknd, la @RecordingAcad ha cambiato le regole ma Abel, coerentemente, 2 anni dopo ha continuato a ignorarli non presentandosi a ritirare il premio.
Anche @Drake e @silksonic li boicottano.


Dopo le accuse di corruzione e "comitati segreti" da parte di @theweeknd, la @RecordingAcad ha cambiato le regole ma Abel, coerentemente, 2 anni dopo ha continuato a ignorarli non presentandosi a ritirare il premio.
Anche @Drake e @silksonic li boicottano.


What is the Relative Strength Index (RSI), and how do you use it?
Developed by J. Welles Wilder in 1978, the Relative Strength Index(RSI) is a momentum oscillator that measures the speed and change of price movements.
#TradingSignals #RSI
🧑🏫Let's Learn!
Educational 🧵👇
1/
Developed by J. Welles Wilder in 1978, the Relative Strength Index(RSI) is a momentum oscillator that measures the speed and change of price movements.
#TradingSignals #RSI
🧑🏫Let's Learn!
Educational 🧵👇
1/

The RSI is an oscillator with a range from 0 to 100
There are 3 main values of interest:
🔵Below 30 signals that the market is oversold 📉
🔵50 signals neutral 😐
🔵Above 70 signals overbought 📈
2/
There are 3 main values of interest:
🔵Below 30 signals that the market is oversold 📉
🔵50 signals neutral 😐
🔵Above 70 signals overbought 📈
2/

The #RSI indicator has been featured in many books and articles over the years. Even though the it was created well before the computer era, it is still a widely used indicator that traders use to determine momentum in any given market.
3/
3/

TYPES OF CHARTS !!
Thread (1/10)
There are almost 10+ types of charts that are available for doing Technical Analysis.
Let's decode 6 popular type of chart that is widely used by traders.
@sahneydeepak @kuttrapali26 @Technicalchart1
A basic thread on Charts 🧵:
🧵
Thread (1/10)
There are almost 10+ types of charts that are available for doing Technical Analysis.
Let's decode 6 popular type of chart that is widely used by traders.
@sahneydeepak @kuttrapali26 @Technicalchart1
A basic thread on Charts 🧵:
🧵
If you open Tradingview charts or any other broker charts, then you would see following chart type options:
1. Line
2. Candles
3. Bar
4. Area
5. High Low
6. Heiken Ashi
7. Renko
8. Point & Figure
Let's start with top 5 basic charting.
@KommawarSwapnil @price_trader_
1. Line
2. Candles
3. Bar
4. Area
5. High Low
6. Heiken Ashi
7. Renko
8. Point & Figure
Let's start with top 5 basic charting.
@KommawarSwapnil @price_trader_

1. Line Chart:
Line chart tracks the closing prices of the stock over a specific period. While it is considered to be quite simplistic (compared to other chart types), a line chart helps traders to spot trends in the price movement.
@jitu_stock @kaushaldarshan_ @Himanshu2606
Line chart tracks the closing prices of the stock over a specific period. While it is considered to be quite simplistic (compared to other chart types), a line chart helps traders to spot trends in the price movement.
@jitu_stock @kaushaldarshan_ @Himanshu2606

Notion is a beast
But 98.9% of people are still unaware of the full potential of @NotionHQ.
Here are the best free 30 Notion tools 🧵 👇
But 98.9% of people are still unaware of the full potential of @NotionHQ.
Here are the best free 30 Notion tools 🧵 👇
Use Dynamic Visualisations (Graphs & Charts)
1. Customblocks: customblocks.io
2. Notion2Charts: notion2charts.com
3. Vizydrop: notioneverything.com/tools/vizydrop
4. Notion Charts: notioncharts.io
#charts #notiontwt #visualizations
1. Customblocks: customblocks.io
2. Notion2Charts: notion2charts.com
3. Vizydrop: notioneverything.com/tools/vizydrop
4. Notion Charts: notioncharts.io
#charts #notiontwt #visualizations
5. Chart Nerd: chart-nerd.vercel.app
6. NoChart: nochart.co
BONUS! Notion Metrics: notionmetrics.com
#charts #notiontwt #visualizations
6. NoChart: nochart.co
BONUS! Notion Metrics: notionmetrics.com
#charts #notiontwt #visualizations
There is a lot of talking around #Footprint #charts in #cryptotwitter lately. Many people smash them on their templates without even knowing the basics of #DOM reading, making many mistakes when interpreting them. This thread will get you covered 🧵👇
#Footprint candlesticks were first introduced to the public by Market Delta back in 2003. The most famous one is the Bid x Ask split view and most traders' first approach with Footprints is with this kind of visualisation, which is helpful on thick, liquid markets, like bonds. 

One of the most common mistakes that inexperienced traders make is comparing orders that hit the Bid (left side) with those that lift the offer (right side) horizontally.
The interaction among market participants always happens diagonally from the Bid to the Ask.
The interaction among market participants always happens diagonally from the Bid to the Ask.
#DeFi is a constantly moving space.✨💸
And so, it's important to be on top of all things at all times.👑
Here are 10 #tools you NEED for bettering your DeFi journey:🧵👇
And so, it's important to be on top of all things at all times.👑
Here are 10 #tools you NEED for bettering your DeFi journey:🧵👇
1. @DefiLlama: #DeFiLlama maintains all the #TVL data on #DeFi protocols.💸💎
DeFiLlama is a comprehensive tool where you can look at all the data on a #protocol and its #growth.🚀✨
DeFiLlama is a comprehensive tool where you can look at all the data on a #protocol and its #growth.🚀✨
2. @etherscan: Etherscan is a simple tool with lots of utilities.📈💰
#Etherscan is a tool that shows all the #transactions in the Ethereum ecosystem💲
Why @ethereum, though? Well, tons of protocols like @Uniswap are made on #Ethereum.💎
Knowing #ETH helps know #DeFi better.👑
#Etherscan is a tool that shows all the #transactions in the Ethereum ecosystem💲
Why @ethereum, though? Well, tons of protocols like @Uniswap are made on #Ethereum.💎
Knowing #ETH helps know #DeFi better.👑
Candlestick #charts patterns is a movement in prices shown graphically on a candlestick chart that some believe can predict a particular market movement
A thread by @GodFather_NIFTY 🧵👇
A thread by @GodFather_NIFTY 🧵👇

TECHNICAL CHARTS
This thread contains all the basic knowledge about charts used in technical analysis
#technicalanalysis #charts
This thread contains all the basic knowledge about charts used in technical analysis
#technicalanalysis #charts
1/ Charts
A stock chart is a central tool for technical analysis which provides a graphical representation of the price movement, either historical or live, of a security over a specific period of time. In a price-time series chart, price is plotted on y-axis and time on x-axis
A stock chart is a central tool for technical analysis which provides a graphical representation of the price movement, either historical or live, of a security over a specific period of time. In a price-time series chart, price is plotted on y-axis and time on x-axis
2/ Practical Efficacy of Chart
There are three premises of the technical approach:
Price discounts everything
Price moves in trends
History repeats itself
There are three premises of the technical approach:
Price discounts everything
Price moves in trends
History repeats itself
Axelar is a Decentralized Multichain bridge that has been discussed as being a pivotal bridge for the #Cosmos.
*Sips Coffee*
On that note, we though you #Cosmonauts deserved a TLDR Thread to get acquainted. ☕️
$ATOM $OSMO
🧵 1/18
*Sips Coffee*
On that note, we though you #Cosmonauts deserved a TLDR Thread to get acquainted. ☕️
$ATOM $OSMO
🧵 1/18
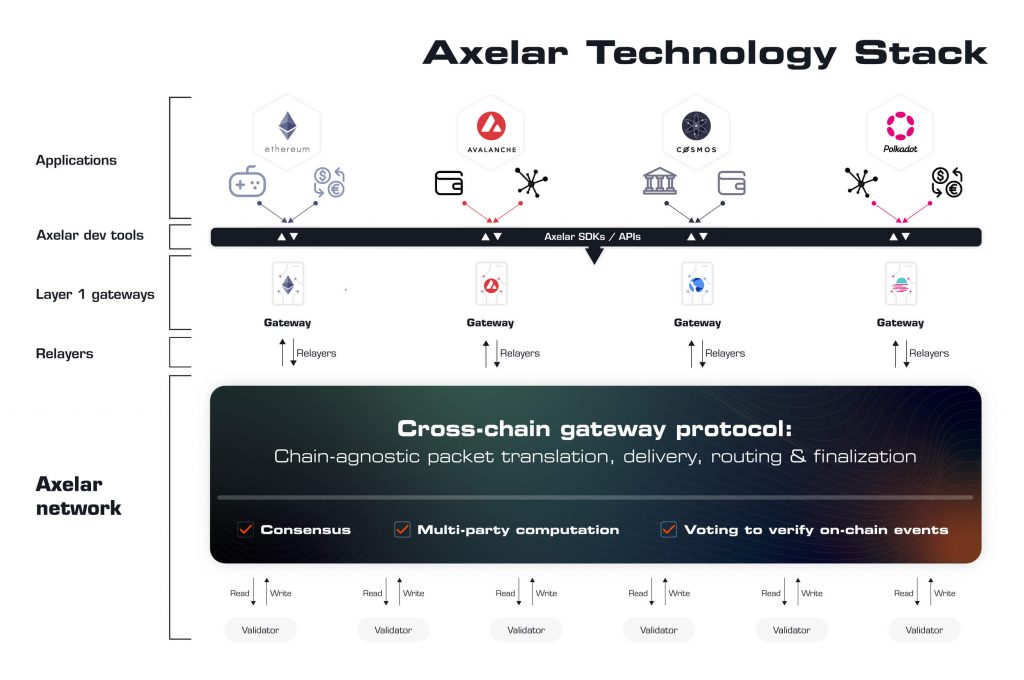
Axelar Goals:
☕️Plug and Play: Simple Bridging
☕️Cross Chain Routing: Become more like the traditional internet.
☕️Upgradeability Support: Seamless upgrades across Blockchains
☕️Uniform Language: One language for basic needs
2/x
☕️Plug and Play: Simple Bridging
☕️Cross Chain Routing: Become more like the traditional internet.
☕️Upgradeability Support: Seamless upgrades across Blockchains
☕️Uniform Language: One language for basic needs
2/x
☕️Decentralization: The Network and Protocol must be Decentralized
☕️Safety: Being a Bridge safety is a #1 Priority
☕️High Liveness: Must be able to support application load
3/x
☕️Safety: Being a Bridge safety is a #1 Priority
☕️High Liveness: Must be able to support application load
3/x
People tend to oversimplify or overcomplicate charting and don't know that #priceaction is the key to understanding it.
In this thread I share my most valuable insights I have taught myself about #charts for #trading.
In this thread I share my most valuable insights I have taught myself about #charts for #trading.

Notion is a beast.
But 99% of people are still unaware of the full potential of @NotionHQ.
Here are the best free 30 Notion tools 🧵 👇
But 99% of people are still unaware of the full potential of @NotionHQ.
Here are the best free 30 Notion tools 🧵 👇
Use Dynamic Visualisations (Graphs & Charts)
1. Notion Charts: notioncharts.io
2. Notion2Charts: notion2charts.com
3. Vizydrop: notioneverything.com/tools/vizydrop
4. Customblocks: customblocks.io
#charts #notiontwt #visualizations
1. Notion Charts: notioncharts.io
2. Notion2Charts: notion2charts.com
3. Vizydrop: notioneverything.com/tools/vizydrop
4. Customblocks: customblocks.io
#charts #notiontwt #visualizations
5. Chart Nerd: chart-nerd.vercel.app
6. NoChart: nochart.co
BONUS! Notion Metrics: notionmetrics.com
#charts #notiontwt #visualizations
6. NoChart: nochart.co
BONUS! Notion Metrics: notionmetrics.com
#charts #notiontwt #visualizations
My Long term equity investment setup
1. Identifying quality stock in watchlist
2. Selections amongst those for final watchlist
3. Final trigger to buy the stock in portfolio
4. Adding or pyramiding
(will explain this in detail step-by-step in this thread , so keep glued)
1. Identifying quality stock in watchlist
2. Selections amongst those for final watchlist
3. Final trigger to buy the stock in portfolio
4. Adding or pyramiding
(will explain this in detail step-by-step in this thread , so keep glued)
Some consideration kept in mind before following this setup
- this is a regular sip investment plan
- for 10-20 years of wealth creation
- cannot be used for trading or speculation
- not useful for those who want to allocate all the money at once
- this is a regular sip investment plan
- for 10-20 years of wealth creation
- cannot be used for trading or speculation
- not useful for those who want to allocate all the money at once
Aujourd'hui, belle baisse du #Bitcoin et vous allez probablement prendre vos plus mauvaises décisions car :
- Toutes les mauvaises news vont sortir en même temps
- FUD dans tous les sens
- Les anti- #BTC vont faire leur retour
Toujours d'actualité ⬇️
aucoindubloc.com/que-faire-lors…
- Toutes les mauvaises news vont sortir en même temps
- FUD dans tous les sens
- Les anti- #BTC vont faire leur retour
Toujours d'actualité ⬇️
aucoindubloc.com/que-faire-lors…
N'essayez pas non plus de trouver une cause à tout prix à ce genre de #baisse.
Profitez de ce temps pour construire, #apprendre et découvrir, ce sera d'autant plus intéressant et constructif.
Si vous êtes sensible, éloignez vous des #charts, ça ne vous fera que du bien.
Profitez de ce temps pour construire, #apprendre et découvrir, ce sera d'autant plus intéressant et constructif.
Si vous êtes sensible, éloignez vous des #charts, ça ne vous fera que du bien.

Si je devais donner mon avis/sentiment #crypto (je n'ai vu passé aucune news) :
- Gros sentiment d'incertitude + tensions
- Beaucoup de nouveaux
- Approche des fêtes de fin d'année
Ces baisses permettent de "purifier" le marché et de faire sortir une partie des #investisseurs.
- Gros sentiment d'incertitude + tensions
- Beaucoup de nouveaux
- Approche des fêtes de fin d'année
Ces baisses permettent de "purifier" le marché et de faire sortir une partie des #investisseurs.

Here are just few Examples of why i use ONLY #Fibonacci levels and candle stick patterns Without any other indicator
//THREAD
#trading #stocks #technicalanalysis
#CHARTS #Candlestick #patterns
#study
//THREAD
#trading #stocks #technicalanalysis
#CHARTS #Candlestick #patterns
#study
Back in 2014, when financial #education was restricted to a few, we decided to make #content accessible & affordable for all
With that resolution, in 2016 we launched #webinars with the best trainers sharing their most valuable #trading #strategies
It worked. Read why & how? -
With that resolution, in 2016 we launched #webinars with the best trainers sharing their most valuable #trading #strategies
It worked. Read why & how? -
We had the #best trainers sharing valuable strategies in 2-3 hours webinar at < ₹500, it became an instant hit and there was no looking back.
Out of our 250+ #webinars, here I have handpicked the ones which has the power to change your TRADING DESTINY.
Out of our 250+ #webinars, here I have handpicked the ones which has the power to change your TRADING DESTINY.

Sivakumar Jayachandran - @Justsiva123, a NISM Certified Professional for Equity Derivatives, talks about Scalping which refers to a style of trading where an #INTRADAY trader makes money purely on the #price momentum.
bit.ly/3sVlO2S
bit.ly/3sVlO2S
Thread 🧵explaining #CupHandle Pattern used in #TechnicalAnalysis
(Must read for #TA learners)
🙏Like & RT to spread learning with all🙏
@rohanshah619 @Mitesh_Engr
@PAlearner @Puretechnicals9
Views Welcome
#TechnicalAnalysis #StockMarket
(Must read for #TA learners)
🙏Like & RT to spread learning with all🙏
@rohanshah619 @Mitesh_Engr
@PAlearner @Puretechnicals9
Views Welcome
#TechnicalAnalysis #StockMarket

1⃣
Cup and Handle is a #bullish continuation chart pattern. It is formed by two rounded troughs, the first being deeper and wider than the second.
The first trough is known as #cup while second trough is known as #handle.
#TechnicalAnalysis #ChartPatterns #Charts #StockMarket
Cup and Handle is a #bullish continuation chart pattern. It is formed by two rounded troughs, the first being deeper and wider than the second.
The first trough is known as #cup while second trough is known as #handle.
#TechnicalAnalysis #ChartPatterns #Charts #StockMarket
2⃣
The high points of the cup and the handle are aligned on the same horizontal #resistance line known as the #neckline of the cup with handle pattern.
#TechnicalAnalysis #ChartPatterns #Charts #StockMarket
The high points of the cup and the handle are aligned on the same horizontal #resistance line known as the #neckline of the cup with handle pattern.
#TechnicalAnalysis #ChartPatterns #Charts #StockMarket
Weekend Study #charts - No recommendations. Only for study purposes.
1. #TataMotors - self-explanatory chart. Link below
invst.ly/v47gl
1. #TataMotors - self-explanatory chart. Link below
invst.ly/v47gl
3i Infotech Daily Chart
1. Stock is outperforming the NIFTY50 over the past 50 days
2. Stock is trading above the 15, 40, and 100 day SMA & it crossed the 15 day SMA yesterday
3. MACD histogram has given an uptick below the 0 line
1. Stock is outperforming the NIFTY50 over the past 50 days
2. Stock is trading above the 15, 40, and 100 day SMA & it crossed the 15 day SMA yesterday
3. MACD histogram has given an uptick below the 0 line

4. RSI14 is in the bullish zone, facing up & is in convergence with the price action. A positive crossover between RSI5 & RSI14 happened yesterday
5. The stock is on the verge of breaking its previous high of 6 years at 9.8 & will also breakout from a 6 month consolidation period
5. The stock is on the verge of breaking its previous high of 6 years at 9.8 & will also breakout from a 6 month consolidation period
6. Buy at the CMP with a stop-loss at 8 (40 day SMA) for the following targets -
- 13.55
- 18
- 22
Note - The targets are very conservative as the stock has made a rounding bottom & 2021 has recorded the highest volumes in the history of the stock, suggesting strong accumulation
- 13.55
- 18
- 22
Note - The targets are very conservative as the stock has made a rounding bottom & 2021 has recorded the highest volumes in the history of the stock, suggesting strong accumulation
Thread 🧵explaining Inverted Head & Shoulder Pattern used in #TechnicalAnalysis
(Must read for #TA learners )
🙏 Like & RT to spread learning with all 🙏
@rohanshah619 views welcome ...
#TechnicalAnalysis #ChartPatterns #Charts #StockMarket
(Must read for #TA learners )
🙏 Like & RT to spread learning with all 🙏
@rohanshah619 views welcome ...
#TechnicalAnalysis #ChartPatterns #Charts #StockMarket

1⃣An inverse Head and Shoulders (H&S) pattern is a #bullish trend reversal chart pattern.
This chart pattern is the opposite of the traditional "Head and Shoulder (H&S)” pattern.
#TechnicalAnalysis #ChartPatterns #Charts #StockMarket
This chart pattern is the opposite of the traditional "Head and Shoulder (H&S)” pattern.
#TechnicalAnalysis #ChartPatterns #Charts #StockMarket
#Charts Fans, lets do this!
Thread time!
$SPY $QQQ $DIA $TRAN $IWM $SOX $IGV $XLF $XLI $JETS $GLD $XLE #Yield #McClellan #Insiders #PanicEuphoria
#stockCharts
Thread time!
$SPY $QQQ $DIA $TRAN $IWM $SOX $IGV $XLF $XLI $JETS $GLD $XLE #Yield #McClellan #Insiders #PanicEuphoria
#stockCharts
$DIA #DJIA has been absolutely buzzing this year, Value vs Growth continues to sky rocket as Value was beaten down pretty hard during pandemic and growth rose exponentially, so far the story of 2021 has been Value! This is very very bulish still, lets see how far this extends! 


