Discover and read the best of Twitter Threads about #niftybank
Most recents (24)
#MarketAtClose | #Midcaps continue to outperform, Nifty Midcap Index posts record close
#Sensex, #Nifty & #NiftyBank close with minor gains in a range-bound session
Sensex rises 119 points to 62,547 & Nifty 46 points to 18,534
Midcap Index gains 154 points to 33,967 & Nifty Bank… twitter.com/i/web/status/1…
#Sensex, #Nifty & #NiftyBank close with minor gains in a range-bound session
Sensex rises 119 points to 62,547 & Nifty 46 points to 18,534
Midcap Index gains 154 points to 33,967 & Nifty Bank… twitter.com/i/web/status/1…

#MarketAtClose | #Metal stocks rise on improved global prices, #Hindalco up over 3%
#ApolloHospitals gains another 3% on Friday, up 8% for the week
#HeroMoto continues its positive run, less than 2% away from 52-wk high
#Auto stocks rise after strong sales in May, M&M, #Maruti,… twitter.com/i/web/status/1…
#ApolloHospitals gains another 3% on Friday, up 8% for the week
#HeroMoto continues its positive run, less than 2% away from 52-wk high
#Auto stocks rise after strong sales in May, M&M, #Maruti,… twitter.com/i/web/status/1…
#MarketAtClose | #Pharma stocks see some buying, Dr Reddy’s, Sun, Laurus up over 1% each
New-age cos like #Zomato & #Nykaa see healthy gains on Friday, up 4-8%
4 #Nifty stocks (#BajajAuto, #Britannia, #TaMo, #ApolloHosp) hit 52-week highs today
M&M Fin gains more than 1% to hit… twitter.com/i/web/status/1…
New-age cos like #Zomato & #Nykaa see healthy gains on Friday, up 4-8%
4 #Nifty stocks (#BajajAuto, #Britannia, #TaMo, #ApolloHosp) hit 52-week highs today
M&M Fin gains more than 1% to hit… twitter.com/i/web/status/1…
#MarketAtClose | #Market closes near day’s low as financial heavyweights underperform
Nifty Bank ends with a cut of 1% against a flat close for #Sensex & #Nifty
#Midcaps relatively outperform, market breadth favours advances
Nifty Bank ends with a cut of 1% against a flat close for #Sensex & #Nifty
#Midcaps relatively outperform, market breadth favours advances

#MarketAtClose | #Sensex falls 194 points to 62,429 & Nifty 47 points to 18,488
#NiftyBank slips 338 points to 43,790 while #Midcap index rises 51 points to 33,812
#NiftyBank slips 338 points to 43,790 while #Midcap index rises 51 points to 33,812
#MarketAtClose | Coal India falls as government brings #OFS at discount, non-retail portion fully subscribed
Saudi Aramco’s sharp cut in #propane price weighs on Gujarat Gas, stock down 4%
Saudi Aramco’s sharp cut in #propane price weighs on Gujarat Gas, stock down 4%

Hi Friends,
Sharing some useful #trading threads here
Like & Retweet for Max Reach for learners benefit
it's 100% FREE
by @TechTradesTT & @Stocktwit_IN
1- Technical Analysis, a candlestick pattern -- part 1
#TechnicalTrades #TradingView
Sharing some useful #trading threads here
Like & Retweet for Max Reach for learners benefit
it's 100% FREE
by @TechTradesTT & @Stocktwit_IN
1- Technical Analysis, a candlestick pattern -- part 1
#TechnicalTrades #TradingView
Some Complex candlestick patterns ---- thread Part 2
@KommawarSwapnil @nakulvibhor @Abhishekkar_ @chartmojo @KhapreVishal
@KommawarSwapnil @nakulvibhor @Abhishekkar_ @chartmojo @KhapreVishal
How to create a watch list before market opening- A thread
@tapariachandan @Rishikesh_ADX @kuttrapali26 @ProfitKing7
@tapariachandan @Rishikesh_ADX @kuttrapali26 @ProfitKing7
Candlestick #charts patterns is a movement in prices shown graphically on a candlestick chart that some believe can predict a particular market movement
A thread by Naren Joshi @valuelevels
🧵👇
#like & #Retweet for MAX Reach
A thread by Naren Joshi @valuelevels
🧵👇
#like & #Retweet for MAX Reach

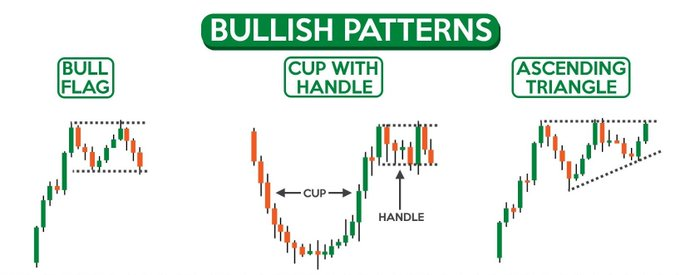
Bullish Patterns
1- BULL FLAG
2- CUP WITH HANDLE
3- ASCENDING TRIANGLE
#stocks #TradingView
#nifty #niftybank #banknifty
1- BULL FLAG
2- CUP WITH HANDLE
3- ASCENDING TRIANGLE
#stocks #TradingView
#nifty #niftybank #banknifty

BEARISH PATTERNS
1- BEAR FLAG
2- INVERTED CUP WITH HANDLE
3- DESCENDING TRIANGLE
#niftyoptions #niftyfuture
#niftytoday
1- BEAR FLAG
2- INVERTED CUP WITH HANDLE
3- DESCENDING TRIANGLE
#niftyoptions #niftyfuture
#niftytoday

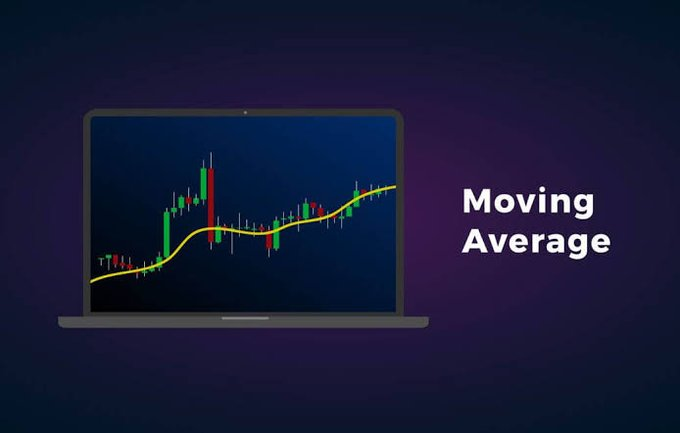
Moving average is one the simplest indicator which many traders and investor use for technical analysis.
𝗔 𝗧𝗵𝗿𝗲𝗮𝗱 𝗼𝗻 𝗠𝗼𝘃𝗶𝗻𝗴 𝗔𝘃𝗲𝗿𝗮𝗴𝗲 🧵 by @me__kaushik
Retweet ♻ for maximum reach.
𝗔 𝗧𝗵𝗿𝗲𝗮𝗱 𝗼𝗻 𝗠𝗼𝘃𝗶𝗻𝗴 𝗔𝘃𝗲𝗿𝗮𝗴𝗲 🧵 by @me__kaushik
Retweet ♻ for maximum reach.

📍What is Moving Average?
A moving average is a technical indicator that investors and traders use to determine the trend direction of a stock or to determine its support and resistance levels.
It is a trend-following or lagging indicator because it is based on past prices.
A moving average is a technical indicator that investors and traders use to determine the trend direction of a stock or to determine its support and resistance levels.
It is a trend-following or lagging indicator because it is based on past prices.
📍Types of Moving Average
👉 Simple Moving Average (SMA): SMA is a technical indicator calculated by adding the most recent data points in a set and dividing the total by the number of time periods.
👉 Simple Moving Average (SMA): SMA is a technical indicator calculated by adding the most recent data points in a set and dividing the total by the number of time periods.
Set a reminder for my upcoming Space! twitter.com/i/spaces/1kvJp…
We are going live in 5!
Follow the thread below for slides!
#nifty50 #NiftyBank #corporateindia
We are going live in 5!
Follow the thread below for slides!
#nifty50 #NiftyBank #corporateindia
Top Apps for UPI 📱
• PhonePe 48.87%
• GPay 33.86%
• Paytm 10.65%
• Cred 1.54%
• Yes Bank 1.23%
• ICICI Bank 1.22%
• BHIM 0.67%
• Amazon Pay 0.49%
(Nov 2022)
Which app do you use the most? 🤔
• PhonePe 48.87%
• GPay 33.86%
• Paytm 10.65%
• Cred 1.54%
• Yes Bank 1.23%
• ICICI Bank 1.22%
• BHIM 0.67%
• Amazon Pay 0.49%
(Nov 2022)
Which app do you use the most? 🤔
*The data is based on total transaction value.
A new digital currency, the e-Rupi was launched by the RBI on December 1.
There is no need for a bank account for the same.
#GPay #business
A new digital currency, the e-Rupi was launched by the RBI on December 1.
There is no need for a bank account for the same.
#GPay #business
Banking companies are going digital.
➡️ Track the Nifty Bank Index on ticker.finology.in/market/index/n…
• Get top-performer stocks
• Track daily gainers/losers
• Be updated with the current movement of the index.
#NiftyBank
➡️ Track the Nifty Bank Index on ticker.finology.in/market/index/n…
• Get top-performer stocks
• Track daily gainers/losers
• Be updated with the current movement of the index.
#NiftyBank
Are you searching Best Stock Broker?
Here are some Top Online Stock Brokers with their Fees & service details.
Thread 🧵👇
SELECTED BEST STOCK BROKERS IN INDIA👇
UPSTOX, ANGELOne, ALICEBLUE,STOXKART & Edelweiss
Hot Link- t.me/MONNEY_VALUE/3…
📊 START #INVESTING TODAY
Here are some Top Online Stock Brokers with their Fees & service details.
Thread 🧵👇
SELECTED BEST STOCK BROKERS IN INDIA👇
UPSTOX, ANGELOne, ALICEBLUE,STOXKART & Edelweiss
Hot Link- t.me/MONNEY_VALUE/3…
📊 START #INVESTING TODAY

UPSTOX
PRICING: Flat fees, no hidden charges
₹0-Commissions On investing in MF and IPOs
₹0- AMC
₹20-Brokerage On Eq, F&O, commodity & currency
₹0-Account Opening
Open a Demat + Trading account
tinyurl.com/LinkUPSTOX
#upstox #trading #StockMarket
PRICING: Flat fees, no hidden charges
₹0-Commissions On investing in MF and IPOs
₹0- AMC
₹20-Brokerage On Eq, F&O, commodity & currency
₹0-Account Opening
Open a Demat + Trading account
tinyurl.com/LinkUPSTOX
#upstox #trading #StockMarket

Angelone
Easy Trading - No Hidden Charges
₹0- Brokerage on Stock investments
₹20 or 0.25% (whichever is lower) Per Order For Eq, F&O, Commodities & Currencies
₹0 AMC For 1st Year
₹0 int on Margin Trade
Funding For 30 days
Open Your Account
tinyurl.com/vobqkuw
Easy Trading - No Hidden Charges
₹0- Brokerage on Stock investments
₹20 or 0.25% (whichever is lower) Per Order For Eq, F&O, Commodities & Currencies
₹0 AMC For 1st Year
₹0 int on Margin Trade
Funding For 30 days
Open Your Account
tinyurl.com/vobqkuw

Decoding Markets for Monday🧐
Where are we likely to open ?
Where are we likely to close ?
Lets Decode 😎
Thread 🧵(1/6)
@sahneydeepak @kuttrapali26 @KommawarSwapnil @price_trader_
#StockMarkets #Nifty
Kindly Like ❤️ Share & Retweet 🔁for Max Reach.
Lets get Started 🧐
Where are we likely to open ?
Where are we likely to close ?
Lets Decode 😎
Thread 🧵(1/6)
@sahneydeepak @kuttrapali26 @KommawarSwapnil @price_trader_
#StockMarkets #Nifty
Kindly Like ❤️ Share & Retweet 🔁for Max Reach.
Lets get Started 🧐
2. Before Decode on Charts, lets decode the adx strenght levels of ADX and DMI's.
@kaushaldarshan_ @Himanshu2606 @Puretechnicals9
#ADX
@kaushaldarshan_ @Himanshu2606 @Puretechnicals9
#ADX

1. ADX PARADOX DECODED !!
Bank Nifty in ADX Paradox Zone
Kindly Like ❤️ & Retweet for Max Reach 🔁
@sahneydeepak @kuttrapali26 @KommawarSwapnil @price_trader_
#stocks #Niftybank #adx #Nifty
ADX Paradox Explanation:
Thread (1/6) 🧵
👇👇👇
Bank Nifty in ADX Paradox Zone
Kindly Like ❤️ & Retweet for Max Reach 🔁
@sahneydeepak @kuttrapali26 @KommawarSwapnil @price_trader_
#stocks #Niftybank #adx #Nifty
ADX Paradox Explanation:
Thread (1/6) 🧵
👇👇👇
2. What is ADX Paradox ??
ADX traders measure volatility on the basis of where ADX on that timeframe is.
However, ADX on diffrent charts are diffrent
ADX on Japanese candlessticks charts is diffrent from ADX on Heikenashi charts.
@Rishikesh_ADX @Amit_Gulecha @Himanshu2606

ADX traders measure volatility on the basis of where ADX on that timeframe is.
However, ADX on diffrent charts are diffrent
ADX on Japanese candlessticks charts is diffrent from ADX on Heikenashi charts.
@Rishikesh_ADX @Amit_Gulecha @Himanshu2606


3. ADX on Hekenashi charts is usually higher most of the times.
But Diffrence in ADX of these charts is usually less than 10
"in normal cases" which is easier for traders to gauge volatility on that timeframes.
@Technicalchart1 @equialpha @kaushaldarshan_ @Ronak_Unadkat
But Diffrence in ADX of these charts is usually less than 10
"in normal cases" which is easier for traders to gauge volatility on that timeframes.
@Technicalchart1 @equialpha @kaushaldarshan_ @Ronak_Unadkat
#INDIA $IBN $INDA #NIFTYBANK. Wishing all my Indian friends a Happy Diwali. Thought it worth sharing some interesting charts on india. Firstly, for those bullish oil- India is extremely susceptible to oil prices. In addition, India equities relative to bonds are highly 

#india $IBN #niftybank as the patrons drink another glass of champagne unbeknownst of the impending doom. Look at the current falling import cover whilst the situation seems relatively similar to 2011-2013 when INR fell 28%. Jeffries says it isn’t exactly the same because of 


Stronger govt etc but RBI games as per
Intraday trading tips and tricks
With @Stocktwit_IN & @valuelevels
As the name suggests, Intraday Trading is the process of buying and selling stocks on the same day. Basically, you buy stocks on daily basis, you look for a reasonable price to sell it and then earn your profit.
With @Stocktwit_IN & @valuelevels
As the name suggests, Intraday Trading is the process of buying and selling stocks on the same day. Basically, you buy stocks on daily basis, you look for a reasonable price to sell it and then earn your profit.

Stock Chart Patterns ↗️↔️↘️
Stock chart patterns often signal transitions between rising and falling trends.
These patterns can be as simple as trendlines and as complex as double head-and-shoulders formations.
Stock chart patterns often signal transitions between rising and falling trends.
These patterns can be as simple as trendlines and as complex as double head-and-shoulders formations.

#PreMarketCapsule |26th September, Monday | Edition: 43
In the document ⬇️
1. #Nifty Range and Breadth
2. #Banknifty range and Breadth
3. #Sector Breadth
4. #FII Derivative Activity
5. #Summary of the analysis
In the document ⬇️
1. #Nifty Range and Breadth
2. #Banknifty range and Breadth
3. #Sector Breadth
4. #FII Derivative Activity
5. #Summary of the analysis

Elliott / ABC Wave Theory
Elliott Wave Theory, or ABC wave theory, is a term for three-wave counter trend price movement.
With @Stocktwit_IN & @TradingView_IN
#TradingView #stocks #nifty #niftybank #trading #priceaction
Elliott Wave Theory, or ABC wave theory, is a term for three-wave counter trend price movement.
With @Stocktwit_IN & @TradingView_IN
#TradingView #stocks #nifty #niftybank #trading #priceaction

Here, wave A is the first price wave that is against the trend of the entire market. B wave is a corrective wave for wave A. Wave C shows the final price move to complete the counter trend price move.
Remember👇
Alphabetical labeling helps to differentiate between the degree or level of the wave. It speaks to the span of the basic pattern.
Alphabetical labeling helps to differentiate between the degree or level of the wave. It speaks to the span of the basic pattern.
Definition of Alpha Figure
An Alpha indicates the measure by which a stock or portfolio has managed to outperform a benchmark like an index of shares.
#investing #StockMarcket
An Alpha indicates the measure by which a stock or portfolio has managed to outperform a benchmark like an index of shares.
#investing #StockMarcket

It takes into account the active returns on investment.
A positive Alpha means that the security or portfolio is beating the market while a negative Alpha means that it is lagging.
#stocks #nifty #niftybank #trading #priceaction
#StocksToTrade #stockstowatch
A positive Alpha means that the security or portfolio is beating the market while a negative Alpha means that it is lagging.
#stocks #nifty #niftybank #trading #priceaction
#StocksToTrade #stockstowatch

Alpha can also be used to measure the competence of a fund manager and their strategies.
It is also called an ‘abnormal rate of return’ or ‘excess return.’
#stockmarketindia
It is also called an ‘abnormal rate of return’ or ‘excess return.’
#stockmarketindia

Elliott / ABC Wave Theory
Elliott Wave Theory, or ABC wave theory, is a term for three-wave counter trend price movement.
#TradingView #stocks #nifty #niftybank #trading #priceaction
Elliott Wave Theory, or ABC wave theory, is a term for three-wave counter trend price movement.
#TradingView #stocks #nifty #niftybank #trading #priceaction

Here, wave A is the first price wave that is against the trend of the entire market. B wave is a corrective wave for wave A. Wave C shows the final price move to complete the counter trend price move.
Remember👇
Alphabetical labeling helps to differentiate between the degree or level of the wave. It speaks to the span of the basic pattern.
Alphabetical labeling helps to differentiate between the degree or level of the wave. It speaks to the span of the basic pattern.
Intraday trading tips and tricks
As the name suggests, Intraday Trading is the process of buying and selling stocks on the same day. Basically, you buy stocks on daily basis, you look for a reasonable price to sell it and then earn your profit.
As the name suggests, Intraday Trading is the process of buying and selling stocks on the same day. Basically, you buy stocks on daily basis, you look for a reasonable price to sell it and then earn your profit.

#PreMarketCapsule | 6th September, Tuesday | Edition: 35
In the thread⬇️
1. #Nifty Range and Breadth
2. #Banknifty range and Breadth
3. #Sector Breadth
4. #FII Derivative Activity
5. #Summary of the analysis
In the thread⬇️
1. #Nifty Range and Breadth
2. #Banknifty range and Breadth
3. #Sector Breadth
4. #FII Derivative Activity
5. #Summary of the analysis

Stock Chart Patterns ↗️↔️↘️ with @Stocktwit_IN
Stock chart patterns often signal transitions between rising and falling trends.
These patterns can be as simple as trendlines and as complex as double head-and-shoulders formations.
Stock chart patterns often signal transitions between rising and falling trends.
These patterns can be as simple as trendlines and as complex as double head-and-shoulders formations.

#PreMarketCapsule | 5th September, Monday | Edition: 34
In the document ⬇️
1. #Nifty Range and Breadth
2. #Banknifty range and Breadth
3. #Sector Breadth
4. #FII Derivative Activity
5. #Summary of the analysis
In the document ⬇️
1. #Nifty Range and Breadth
2. #Banknifty range and Breadth
3. #Sector Breadth
4. #FII Derivative Activity
5. #Summary of the analysis

Detailed analysis of #Nifty based on Quant and Technical parameters. Covered COC, COI, PCR, IVs, Breadth and Price Action on monthly, weekly, daily and hourly time frames.
#Nifty50 #NiftyBank #BankNifty #optionstrader #OptionsTrading #StocksToBuy #StockMarket #Stocks
#Nifty50 #NiftyBank #BankNifty #optionstrader #OptionsTrading #StocksToBuy #StockMarket #Stocks

Stock Chart Patterns ↗️↔️↘️
Stock chart patterns often signal transitions between rising and falling trends.
These patterns can be as simple as trendlines and as complex as double head-and-shoulders formations.
Stock chart patterns often signal transitions between rising and falling trends.
These patterns can be as simple as trendlines and as complex as double head-and-shoulders formations.


