Discover and read the best of Twitter Threads about #Candlestick
Most recents (11)
How Does Candlestick Trading Work?
#Thread 🧵(1/5)
#strategy #data #trading #candlestick #stockmarket #trading #python #coding #traderlife
#Thread 🧵(1/5)
#strategy #data #trading #candlestick #stockmarket #trading #python #coding #traderlife

Today I want to write about risk management.
I wrote awhile back about finding your trading edge & #candlestick basics:
()
My friend @Zetoveraleenzet pointed out that knowing this stuff doesn't help much without risk management.
So here's a thread
🧵/1
I wrote awhile back about finding your trading edge & #candlestick basics:
()
My friend @Zetoveraleenzet pointed out that knowing this stuff doesn't help much without risk management.
So here's a thread
🧵/1
@Zetoveraleenzet First, what is risk management?
Technically it's the identification of risks and the procedures necessary to minimize them.
However, for trading I think the more accurate terminology would be risk mitigation.
🧵/2
Technically it's the identification of risks and the procedures necessary to minimize them.
However, for trading I think the more accurate terminology would be risk mitigation.
🧵/2

@Zetoveraleenzet So, how do we mitigate risks while trading?
For proper risk management, you need three things:
1. A system
2. A stop loss (also known as an invalidation point)
3. A target
Let's go through each of these...
🧵/3
For proper risk management, you need three things:
1. A system
2. A stop loss (also known as an invalidation point)
3. A target
Let's go through each of these...
🧵/3
Upcoming webinars for you to master the art of Trading! sedg.in/qcez7pjr
💥Get a 20% discount on all using code WEB20💥
Keep Exploring the thread(🧵)...
💥Get a 20% discount on all using code WEB20💥
Keep Exploring the thread(🧵)...

A Masterclass on Crude Oil by Souradeep Dey (@Trader_souradep): sedg.in/mh6bfqgc
✅Proiftable, proven #CrudeOil strategies
✅Trade Inventory data released by EIA & API
✅Supply & Demand Dynamics of Crude Oil
✅In-depth #TechnicalAnalysis
✅Proiftable, proven #CrudeOil strategies
✅Trade Inventory data released by EIA & API
✅Supply & Demand Dynamics of Crude Oil
✅In-depth #TechnicalAnalysis
Options Strategies for Bearish & Bullish Markets by Deepak Kumar: sedg.in/5z1n6pl2
✅Basics of #Options in Hindi
✅Trading Options based on the Market
✅Selection of the right strategy of #optionstrading based on your approach
✅Basics of #Options in Hindi
✅Trading Options based on the Market
✅Selection of the right strategy of #optionstrading based on your approach
🗺What is the history of the Stock Market?
💱How did trading originate?
📈What are some of the key events of the Stock Market?
We explore the entire timeline of finance and trading leading up to the present day via this series of tweets.
#StockMarketOrigins
💱How did trading originate?
📈What are some of the key events of the Stock Market?
We explore the entire timeline of finance and trading leading up to the present day via this series of tweets.
#StockMarketOrigins

The 1300s
Venetian moneylenders began to sell debt issues to other lenders and to individual investors; and traded in government securities. They carried slates with information on the various issues for sale & meet with clients, much like a broker does today.
#StockMarketOrigins
Venetian moneylenders began to sell debt issues to other lenders and to individual investors; and traded in government securities. They carried slates with information on the various issues for sale & meet with clients, much like a broker does today.
#StockMarketOrigins
The late 1400s
Belgium (then, Antwerp), became the centre of international trade. Merchants would bring in goods anticipating that prices would rise and earn them a profit. #Bondtrading also occurred during this period.
#StockMarketOrigins
Belgium (then, Antwerp), became the centre of international trade. Merchants would bring in goods anticipating that prices would rise and earn them a profit. #Bondtrading also occurred during this period.
#StockMarketOrigins
Here are just few Examples of why i use ONLY #Fibonacci levels and candle stick patterns Without any other indicator
//THREAD
#trading #stocks #technicalanalysis
#CHARTS #Candlestick #patterns
#study
//THREAD
#trading #stocks #technicalanalysis
#CHARTS #Candlestick #patterns
#study
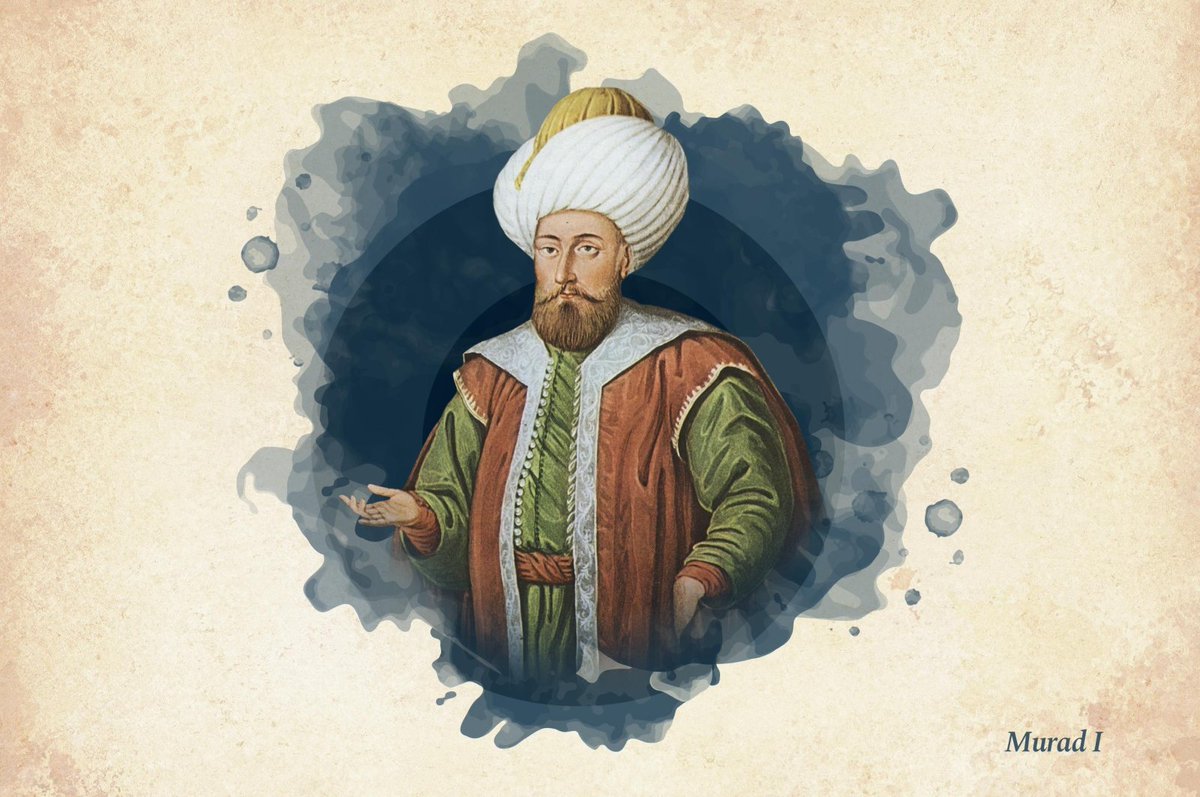
👆🏻 widely used illustration painted by court painter Konstantin Kapıdağlı in the early 19th century shows Sultan Murad I , the 3rd ruler of Ottoman beylik that turned into an empire .
👆🏻👉🏻📸 Credits : Büşra Öztürk - Daily Sabah
👆🏻👉🏻📸 Credits : Büşra Öztürk - Daily Sabah
While his predecessor , Osman & Orhan ghazis , had gathered a nation & created a state , Sultan Murad I improved his lands , making a prosperous country from it for all citizens .
Thread 🧵on how to read #Candlestick Chart.
Most basic thing to learn first if you are thinking to learn #TechnicalAnalysis
🙏RT to maximize reach 🙏
@rohanshah619 @chartmojo @ArjunB9591 @Puretechnicals9 @RTSTOCKVIEW views welcome
Most basic thing to learn first if you are thinking to learn #TechnicalAnalysis
🙏RT to maximize reach 🙏
@rohanshah619 @chartmojo @ArjunB9591 @Puretechnicals9 @RTSTOCKVIEW views welcome

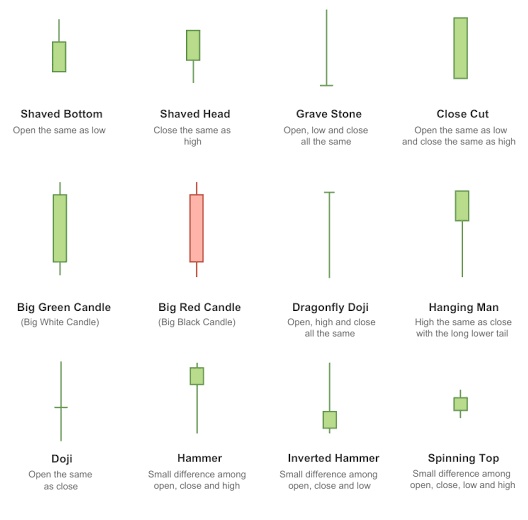
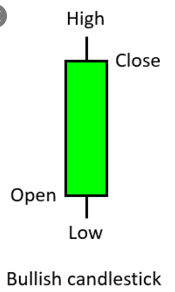
A #candlestick is a type of price #chart used in #technicalanalysis that displays the high, low, open, and closing prices of a security for a specific period.
#CandlestickCharts were originally used by 17th century rice traders in Japan, today they are used by traders and investors around the world to trade in securities.
#TechnicalAnalysis
#TechnicalAnalysis
Steve Nison - Japanese Candlestick Charting Techniques📕📗
An educational thread 🧵on #Candlestick from the book which I read and my understanding.✏️✏️
Add Additional points for learning purpose.
#nitishvanaparthi
#NV1learning
@caniravkaria Sir, small effort from my end
(1/n)
An educational thread 🧵on #Candlestick from the book which I read and my understanding.✏️✏️
Add Additional points for learning purpose.
#nitishvanaparthi
#NV1learning
@caniravkaria Sir, small effort from my end
(1/n)

Below are the topics covered in this thread
1. Candlestick Details
2. Strong Buyers
3. Weak Buyers
4. Single Candlestick pattern
5. Two Candlestick Pattern
6. Three Candlestick Pattern
7.Doji
(2/n)
1. Candlestick Details
2. Strong Buyers
3. Weak Buyers
4. Single Candlestick pattern
5. Two Candlestick Pattern
6. Three Candlestick Pattern
7.Doji
(2/n)
Reversal Patterns Simplified📒
#Candlestick
🔵There are two types of reversal patterns in candlestick
1.Bullish 🐂
2.Bearish 🐻
🔵Bullish reversal pattern mostly occurs in downtrend or during intermediate corrections of uptrend,
Vice Versa for Bearish reversal pattern
1/n
#Candlestick
🔵There are two types of reversal patterns in candlestick
1.Bullish 🐂
2.Bearish 🐻
🔵Bullish reversal pattern mostly occurs in downtrend or during intermediate corrections of uptrend,
Vice Versa for Bearish reversal pattern
1/n
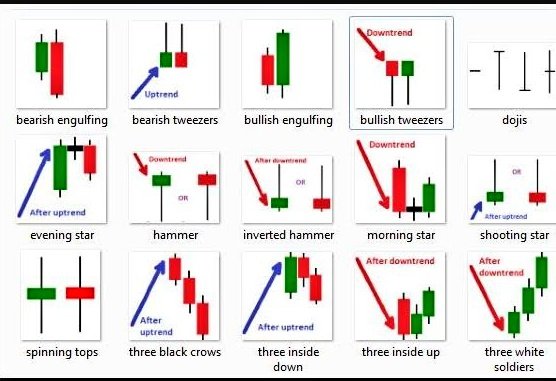
Reversal Patterns Simplified📒
Bullish 🐂
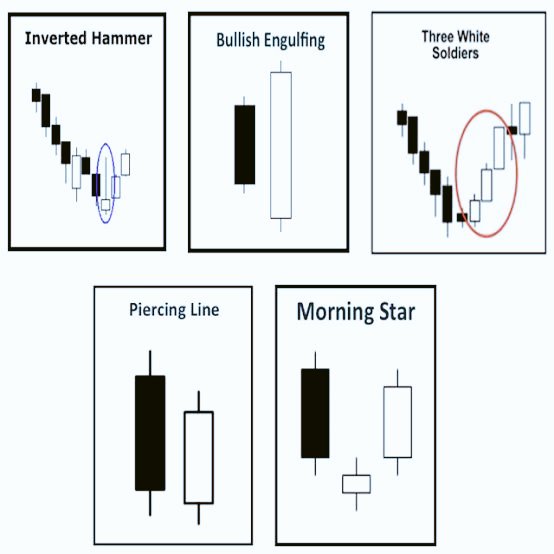
🔵Some common bullish reversal patterns identifed by traders on charts are
1.Bullish Engulfing
2.Three White Soldiers
3.Morning Star
4.Piercing Line
5.Inverted Hammer
🔵All patterns to be confirmed with price move & other indicators
2/n
Bullish 🐂
🔵Some common bullish reversal patterns identifed by traders on charts are
1.Bullish Engulfing
2.Three White Soldiers
3.Morning Star
4.Piercing Line
5.Inverted Hammer
🔵All patterns to be confirmed with price move & other indicators
2/n
Reversal Patterns Simplified📒
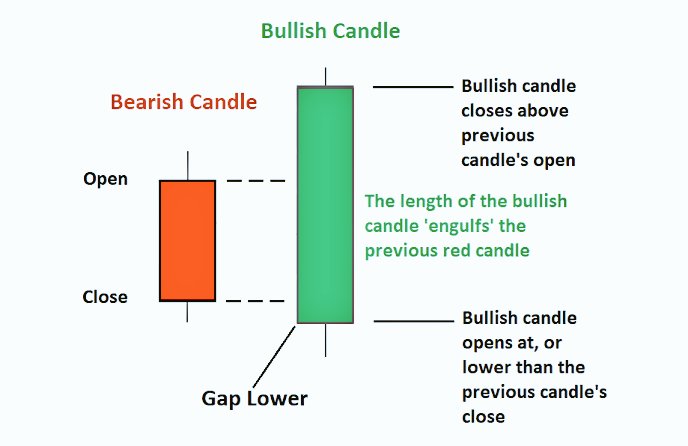
Bullish Engulfing
🔵Its a reversal pattern in which second candle (Green) completely engulfs the real body of the first(Red) candle
🔵On the second day price opens lower than the previous day low & close above previous day high
3/n
#Candlestick
Bullish Engulfing
🔵Its a reversal pattern in which second candle (Green) completely engulfs the real body of the first(Red) candle
🔵On the second day price opens lower than the previous day low & close above previous day high
3/n
#Candlestick
#Knowledgenuggets
#Technicals #Candlestick
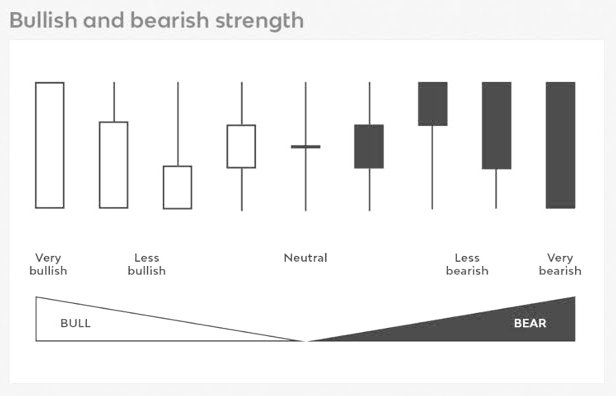
1. First & foremost thing is to know how many types of candles are formed by any security ( Doji, Bar)
2. Second thing is to know description of that candle ( Bullish/Bearish
3. Third thing is to know break down of that candle
#Technicals #Candlestick
1. First & foremost thing is to know how many types of candles are formed by any security ( Doji, Bar)
2. Second thing is to know description of that candle ( Bullish/Bearish
3. Third thing is to know break down of that candle
#Knowledgenuggets
#Technicals #Candlestick
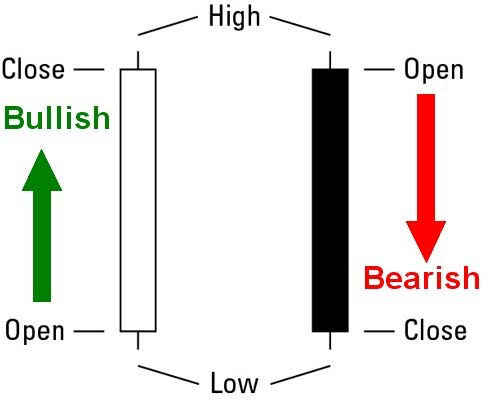
👉 Any candle formed by security has 4 components ( Open—Close, Low-Highl)
👉A candle is formed once the fight b/w 2 emotions (Buy-Sell) is got over in a certain time frame
👉Green signals bullish & Red signals bearish momentum
#Technicals #Candlestick
👉 Any candle formed by security has 4 components ( Open—Close, Low-Highl)
👉A candle is formed once the fight b/w 2 emotions (Buy-Sell) is got over in a certain time frame
👉Green signals bullish & Red signals bearish momentum
#Knowledgenuggets
#Technicals #Candlestick 📊
👉Just learn the candles name like you print the image in mind😇
👉 Once you identify the candle break it down further to get detailed info about the move
👉 Like breaking an hourly candle into four 15m candles to know the momentum
#Technicals #Candlestick 📊
👉Just learn the candles name like you print the image in mind😇
👉 Once you identify the candle break it down further to get detailed info about the move
👉 Like breaking an hourly candle into four 15m candles to know the momentum
