Discover and read the best of Twitter Threads about #Technicals
Most recents (13)
#Volume is one of the simplest indicators in #Technical Analysis but when used properly it is also one of the most powerful confirmatory indicators out there. It's all the more important in the current #market. In this thread, we'll take a detailed look at volume with examples.
1) Volume is the total no of #shares that are bought/sold. Huge volume can be associated with accumulation/distribution by FIIs, while small volume can be associated with retail investors. When #PriceAction is combined with #volume, you get some interesting Price Volume patterns.
2) If #Price goes up with increasing volume, that's a sign that big guys are accumulating, hence, a #Bullish sign. When Price goes down with declining volume, that's a sign that the small retail #investors are exiting. Nothing to worry, again a Bullish sign. 

A Detailed Thread on #JubilantIngrevia as Promised
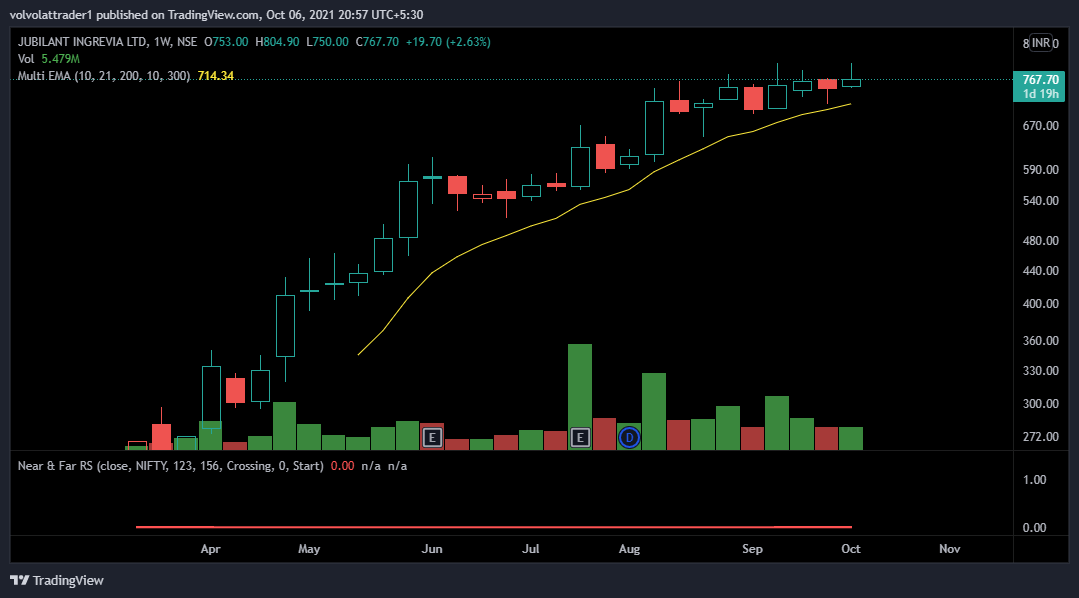
Let's start with the #Technicals to time the Entry
A perfect VCP -3 + Shakeout and crawling near the ATH and awaiting a ATH Breakout
For Investment I use the Weekly Chart with 10EMA

Let's start with the #Technicals to time the Entry
A perfect VCP -3 + Shakeout and crawling near the ATH and awaiting a ATH Breakout
For Investment I use the Weekly Chart with 10EMA

Let's Deep Dive into the Fundamentals of #JubilantIngrevia
Jubilant Ingrevia is an Integrated Speciality Chemicals Comapany
They are into Speciality Chemicals ,nutraceuticals and Life Sciences
Revenue Split and Region wise Revenue in the Below Presentation
Jubilant Ingrevia is an Integrated Speciality Chemicals Comapany
They are into Speciality Chemicals ,nutraceuticals and Life Sciences
Revenue Split and Region wise Revenue in the Below Presentation

Who are its Competitors ?
Closest peers - Laxmi Organic
Two major Products in Common Ethyl Acetate Diketene
Prices of Both have been on Steep Uptrend and Jubilant has not caught up with that
Its a competitor to other Speciality Chemicals like Balaji Amines also in some
Closest peers - Laxmi Organic
Two major Products in Common Ethyl Acetate Diketene
Prices of Both have been on Steep Uptrend and Jubilant has not caught up with that
Its a competitor to other Speciality Chemicals like Balaji Amines also in some
A thread between normal divergence and hidden divergence between price and RSI (Relative Strength Index)
If you find the thread useful, please feel free to like and retweet
#trading #investing #technicals #RSI
If you find the thread useful, please feel free to like and retweet
#trading #investing #technicals #RSI
A NORMAL divergence (henceforth, I will simply call this as divergence) occurs when RSI is at an EXTREME (around 70 & above or 30 & below). It is a REVERSAL pattern, wherein you trade against the direction of the larger trend
A HIDDEN divergence occurs when RSI is typically around the CENTER (around 40 to 60). It is a CONTINUATION pattern, wherein you trade in the direction of the larger trend
The concept of Hidden divergence was introduced by Andrew Cardwell, a renowned global authority on RSI
The concept of Hidden divergence was introduced by Andrew Cardwell, a renowned global authority on RSI
A Thread on #Laurus Labs as Promised
#Technicals - To time the entry and Price
Laurus Labs Currently near Support zones .
620 in my view is a strong support
Showing Buying Volumes since yesterday !
#Technicals - To time the entry and Price
Laurus Labs Currently near Support zones .
620 in my view is a strong support
Showing Buying Volumes since yesterday !

#Fundamentals
Laurus labs is into API , Formulations , Bio Synthesis and CDMO Bussiness
API Bussiness leader #Divis Labs - Only API . No formulations - PE Rating 66
Lowest Cost producer
#Laurus Labs - Into API and formulations . One among the lowest cost producer
Laurus labs is into API , Formulations , Bio Synthesis and CDMO Bussiness
API Bussiness leader #Divis Labs - Only API . No formulations - PE Rating 66
Lowest Cost producer
#Laurus Labs - Into API and formulations . One among the lowest cost producer
Writing threads on #Fundamentals of a stock has been trending so why not thread on explaining #Technicals of a stock!
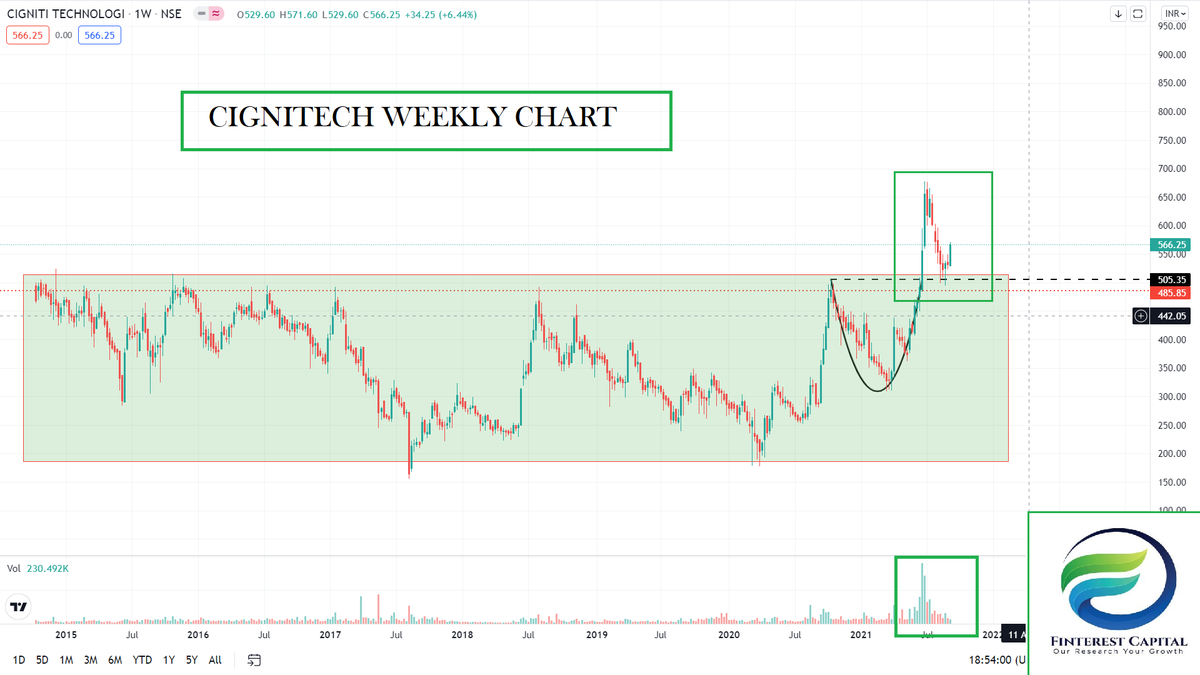
"Here is a thread analyzing Technical charts of #Cignitech" - Answer of #chart kya bolta hai.
It gave a rounding bottom + 7 yrs of consolidation breakout!
1/n
"Here is a thread analyzing Technical charts of #Cignitech" - Answer of #chart kya bolta hai.
It gave a rounding bottom + 7 yrs of consolidation breakout!
1/n
Nice Call Based on #HarmonicPatterns by Rohan Bhai ...
Even #Fundamentals are Good & Other #Technicals are giving additional confirmation ...
See Detailed Analysis in 🧵Below
Even #Fundamentals are Good & Other #Technicals are giving additional confirmation ...
See Detailed Analysis in 🧵Below
1⃣
Jubilant Pharmova Ltd, formerly Jubilant Life Sciences Ltd, is an India-based pharmaceuticals company.
The Company’s segments include Pharmaceuticals, Contract Research and Development Services, and Proprietary Novel Drugs.
#JUBLPHARMA
Jubilant Pharmova Ltd, formerly Jubilant Life Sciences Ltd, is an India-based pharmaceuticals company.
The Company’s segments include Pharmaceuticals, Contract Research and Development Services, and Proprietary Novel Drugs.
#JUBLPHARMA
2⃣
🌟Few Fundamental Positives 🌟
✅Company Market Cap – 12,418.35 Cr
✅Promoter Holding Pledge – 0%
✅Financial Ratios like P/E Ratio from TTM data are of no use as Life Science Ingredients (LSI) business demerged from it with effect from February 1, 2021.
#JUBLPHARMA
🌟Few Fundamental Positives 🌟
✅Company Market Cap – 12,418.35 Cr
✅Promoter Holding Pledge – 0%
✅Financial Ratios like P/E Ratio from TTM data are of no use as Life Science Ingredients (LSI) business demerged from it with effect from February 1, 2021.
#JUBLPHARMA
🚨 RISE AND FALL @UrbanLadder 🚨
On November 14, Reliance Retail announced an all-cash buyout of 96% stake in @UrbanLadder for ₹182 Cr.
A #Thread 🧵
@dmuthuk @SahilBloom @FundamentalGems @FinKrypt @stockskibaat @stocks_in @nifty_baba @FinancialAdda @trdessai @join2manish
On November 14, Reliance Retail announced an all-cash buyout of 96% stake in @UrbanLadder for ₹182 Cr.
A #Thread 🧵
@dmuthuk @SahilBloom @FundamentalGems @FinKrypt @stockskibaat @stocks_in @nifty_baba @FinancialAdda @trdessai @join2manish
Think for a moment, how billion-dollar edtech startup shelled out $300 Mn to acquire a smaller company within 18 months of its launch.(@whitehatjunior)
Urban Ladder, which been since 2012 & built coveted private label, took a 75% cut in paper valuations.
#StockMarket #nifty50
Urban Ladder, which been since 2012 & built coveted private label, took a 75% cut in paper valuations.
#StockMarket #nifty50
The company (@UrbanLadder) focussed on a private business model, which was not bad idea & it also got them a good brand recall.
But the furniture retail space is tough market & everything depends on strategy” says a VC requesting anonymity.
#Share #sharemarket #banknifty
But the furniture retail space is tough market & everything depends on strategy” says a VC requesting anonymity.
#Share #sharemarket #banknifty
Weekly NIFTY50 analysis thread.
September Week4.
All posts are for educational purposes.
September Week4.
All posts are for educational purposes.
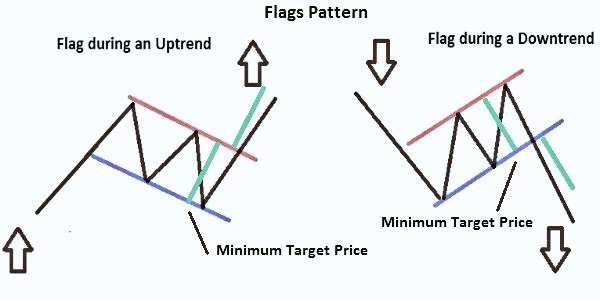
Flag Pattern Simplified📒
🔵Its a continuation price pattern occurs in a middle of an existing trend which looks like the shape of a flag
🔵Flags are areas of tight
consolidation in price for few days before actual BO occurs in a stock
1/n
#StockMarket #Technicals
🔵Its a continuation price pattern occurs in a middle of an existing trend which looks like the shape of a flag
🔵Flags are areas of tight
consolidation in price for few days before actual BO occurs in a stock
1/n
#StockMarket #Technicals
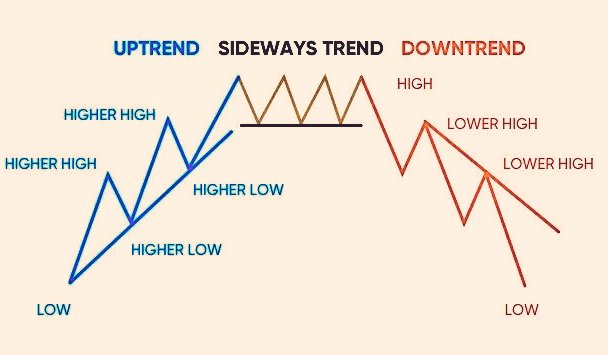
Trend Line Simplified📒
🔵A trendline is a straight line that connects two or more pivot points(high/low) to know the direction of a trend
🔵It acts as a line of support or resistance in particular trend
🔵It can be drawn on a chart of any time
1/n
#StockMarket #Technicals
🔵A trendline is a straight line that connects two or more pivot points(high/low) to know the direction of a trend
🔵It acts as a line of support or resistance in particular trend
🔵It can be drawn on a chart of any time
1/n
#StockMarket #Technicals
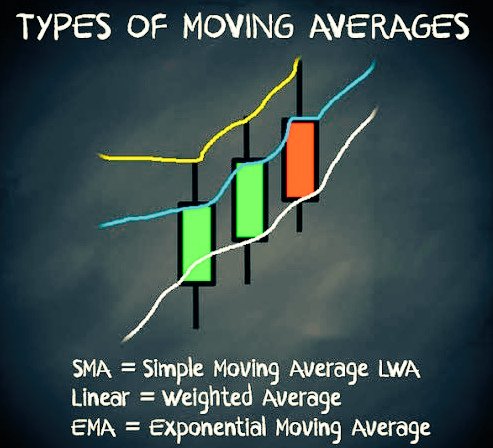
Moving Averages Simplified📒
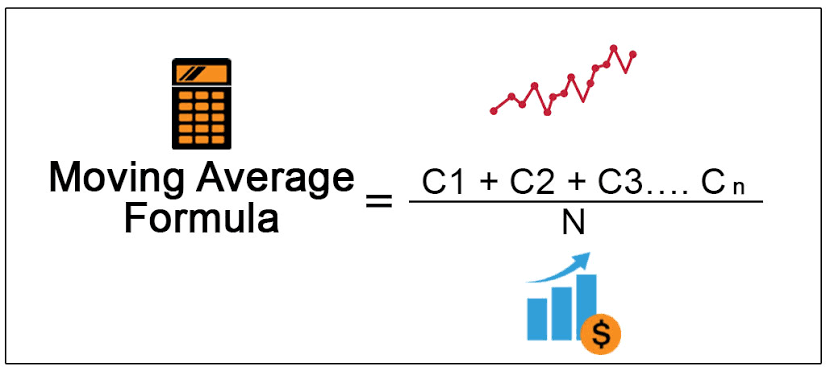
🔵Its a technical indicator used by traders to identify trading opportunities
🔵Its a Lagging indicator
🔵2 MAs which traders use more often are..
SMA(Simple moving average) & EMA(Exponential moving average)
1/n
#StockMarket #Technicals
🔵Its a technical indicator used by traders to identify trading opportunities
🔵Its a Lagging indicator
🔵2 MAs which traders use more often are..
SMA(Simple moving average) & EMA(Exponential moving average)
1/n
#StockMarket #Technicals
RSI Simplified📒
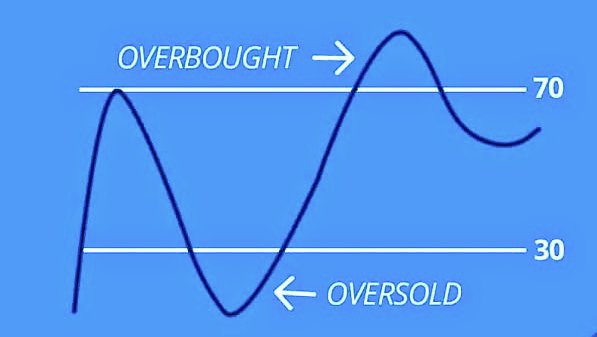
🔵Its one of the leading indicator which measures the strength of any move in price
🔵Its an oscillator which moves between two extremes (0—100)
🔵Reading above 70 indicates overbought while below 30 indicates oversold sentiments
1/n
#StockMarket #Technicals
🔵Its one of the leading indicator which measures the strength of any move in price
🔵Its an oscillator which moves between two extremes (0—100)
🔵Reading above 70 indicates overbought while below 30 indicates oversold sentiments
1/n
#StockMarket #Technicals
RSI Simplified📒
How to trade with #RSI
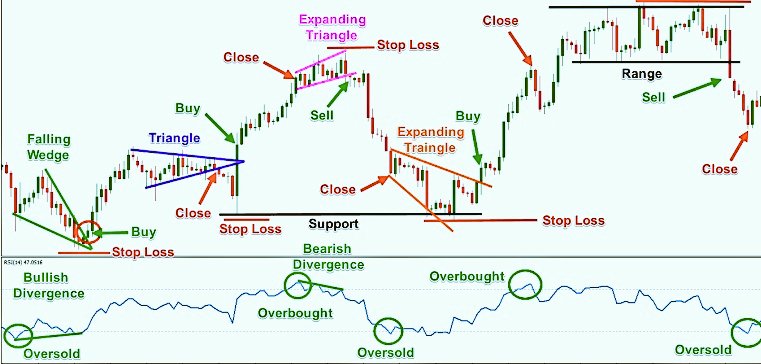
🔵50—70 is as zone where trades buy the #stocks by considering other factors (BO, Divergences)
🔵Below 40 is weakness zone where some traders do selling
🔵40-50 is an indecision zone where most of the traders avoid trading & wait for BO
How to trade with #RSI
🔵50—70 is as zone where trades buy the #stocks by considering other factors (BO, Divergences)
🔵Below 40 is weakness zone where some traders do selling
🔵40-50 is an indecision zone where most of the traders avoid trading & wait for BO
RSI Simplified📒
Trading Divergences📈
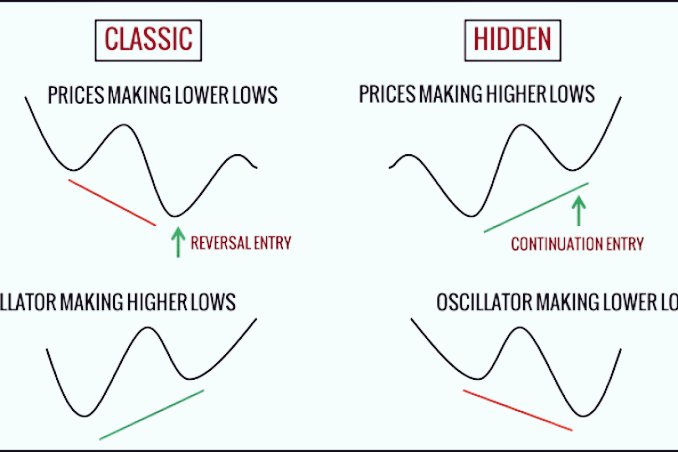
🔵There are 2 type of divergences occurs b/w RSI&Price (Bullish & Bearish)
🔵In Bullish Divergence RSI makes HH-HL while price doesn't do it
🔵In Bearish Divergence RDI makes LH-LL while price doesn't do it
3/n
#StockMarket #Technicals
Trading Divergences📈
🔵There are 2 type of divergences occurs b/w RSI&Price (Bullish & Bearish)
🔵In Bullish Divergence RSI makes HH-HL while price doesn't do it
🔵In Bearish Divergence RDI makes LH-LL while price doesn't do it
3/n
#StockMarket #Technicals
#Knowledgenuggets
#Technicals #Candlestick
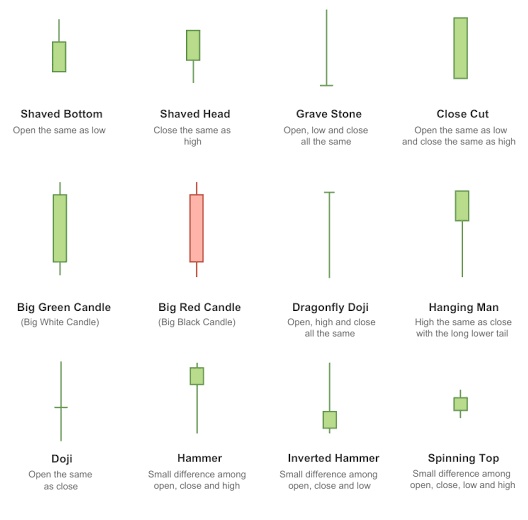
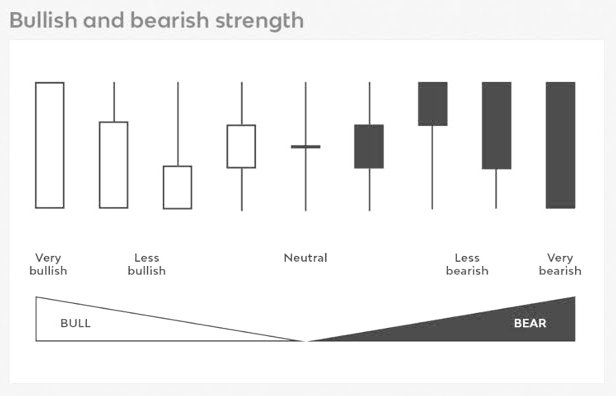
1. First & foremost thing is to know how many types of candles are formed by any security ( Doji, Bar)
2. Second thing is to know description of that candle ( Bullish/Bearish
3. Third thing is to know break down of that candle
#Technicals #Candlestick
1. First & foremost thing is to know how many types of candles are formed by any security ( Doji, Bar)
2. Second thing is to know description of that candle ( Bullish/Bearish
3. Third thing is to know break down of that candle
#Knowledgenuggets
#Technicals #Candlestick
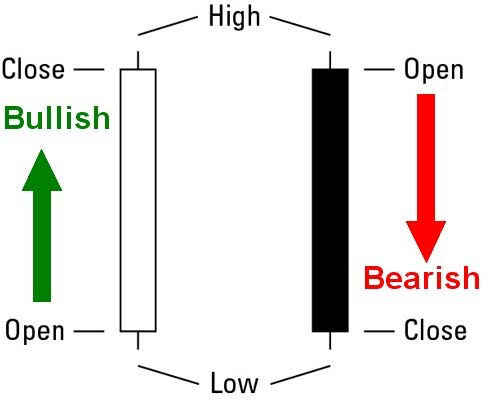
👉 Any candle formed by security has 4 components ( Open—Close, Low-Highl)
👉A candle is formed once the fight b/w 2 emotions (Buy-Sell) is got over in a certain time frame
👉Green signals bullish & Red signals bearish momentum
#Technicals #Candlestick
👉 Any candle formed by security has 4 components ( Open—Close, Low-Highl)
👉A candle is formed once the fight b/w 2 emotions (Buy-Sell) is got over in a certain time frame
👉Green signals bullish & Red signals bearish momentum
#Knowledgenuggets
#Technicals #Candlestick 📊
👉Just learn the candles name like you print the image in mind😇
👉 Once you identify the candle break it down further to get detailed info about the move
👉 Like breaking an hourly candle into four 15m candles to know the momentum
#Technicals #Candlestick 📊
👉Just learn the candles name like you print the image in mind😇
👉 Once you identify the candle break it down further to get detailed info about the move
👉 Like breaking an hourly candle into four 15m candles to know the momentum
