Discover and read the best of Twitter Threads about #Fibonacci
Most recents (24)
Until the 1200s, the abacus was being used to carry out arithmetical operations. Italian mathematician Leonardo Bonacci (1170-1250), popularly known as #Fibonacci, played a predominant role in changing mindsets and persuading Europeans to use
Modus Indorum or the method of the Hindus'. Governments of the day in Europe had not completely accepted the Arabic numerals as they were called in the twelfth century and were especially suspicious of zero. But more merchants and bankers were finding it easier to do calculations
and to balance their account books by using zero and the arithmetical operations that had been described by Al-Khwarizmi. It was at this time that Fibonacci wrote a famous textbook Liber Abaci (Abacus Book or Book of Calculation) that explained the ease of using Modus Indorum.
📌DOĞRU KULLANIM İLE 100 USDT RİSKE EDEREK 500 USDT KAZANDIRACAK BİR STRATEJİ
🔹Msb Sonrası OTE ile Açılan İşleme, Trend Tabanlı Fib Uzantısı İle Hedef Belirleme Stratejisi
(Bullish Market)
#Solana #DOGE
⬇️
🔹Msb Sonrası OTE ile Açılan İşleme, Trend Tabanlı Fib Uzantısı İle Hedef Belirleme Stratejisi
(Bullish Market)
#Solana #DOGE
⬇️

@dlauer @dlauer there us history here. You would really need to go back over a year and a half to fully grasp the complexity of this. @Finra allowed a series A perferrd share to trade that was never supposed to be traded outlined in here in the proxy sec.gov/Archives/edgar…
@dlauer @FINRA 2) A market maker (gtsx.com) or 2 (canaccordgenuity.com/capital-market…) started to create a platform to make it tradeable before the merger happened between $TRCH and $MMAT as shown on this OCC memo... Merger was not to complete till the 28th but got done a day early, context 

1/n
Una herramienta muy utilizada por traders y especuladores son los retrocesos de FIBONACCI, pero ¿cómo así surgió este indicador técnico? ¿Qué me indican sus niveles?
Vamos con un nuevo 🧵
#educacionfinanciera #trading #Fibonacci
Una herramienta muy utilizada por traders y especuladores son los retrocesos de FIBONACCI, pero ¿cómo así surgió este indicador técnico? ¿Qué me indican sus niveles?
Vamos con un nuevo 🧵
#educacionfinanciera #trading #Fibonacci

2/n
¿Quién fue Leonardo Pisano?
También conocido como Leonardo de Pisa o Fibonacci, fue el matemático occidental de mayor talento en la Edad Media y uno de los primeros europeos en abogar por el uso del sistema de numeración arábiga.
Recuerdas el problema de los 🐰
¿Quién fue Leonardo Pisano?
También conocido como Leonardo de Pisa o Fibonacci, fue el matemático occidental de mayor talento en la Edad Media y uno de los primeros europeos en abogar por el uso del sistema de numeración arábiga.
Recuerdas el problema de los 🐰

3/n
El problema era este:
Suponiendo que una pareja de conejos tarda dos meses en alcanzar la madurez, y después de eso dar a luz a otro par de conejos cada mes, ¿cuántos conejos se puede tener al cabo de un año? 🐰🐰
El problema era este:
Suponiendo que una pareja de conejos tarda dos meses en alcanzar la madurez, y después de eso dar a luz a otro par de conejos cada mes, ¿cuántos conejos se puede tener al cabo de un año? 🐰🐰
$MEGL vs $HKD PT 1: I hate when this happens. #megl #stock #cupandhandle may not be done just yet, let's begin. I began to notice the odd behavior from megl today in price action. I was curious so i began to compare #IPO's with #hkd. I noticed some rhyming... cont
$MEGL vs $HKD PT 2: Let's take a #fibonacci retracement from the first candle to the low of the day. You'll see we faced rejection @ the 1.618 ratio. Now let's take some fibs from the top of the cup to the low of the day and we can now see some higher targets that... cont 

$REV-Playout PT 1: Our previously implied #bullflag is playing out like we said. During the after hours today, we came retraced to re-test the 0.618 #fibonacci ratio ($8.27) and have now closed the day at $8.35. This tells us that #rev #stock is respecting market geometry... cont 

$REV-Playout PT 2: Price action is suggesting what we previously mentioned, #rev may want to continue in this phase for some more time and potentially reach the channel top before the next capitulation phase starts... cont 
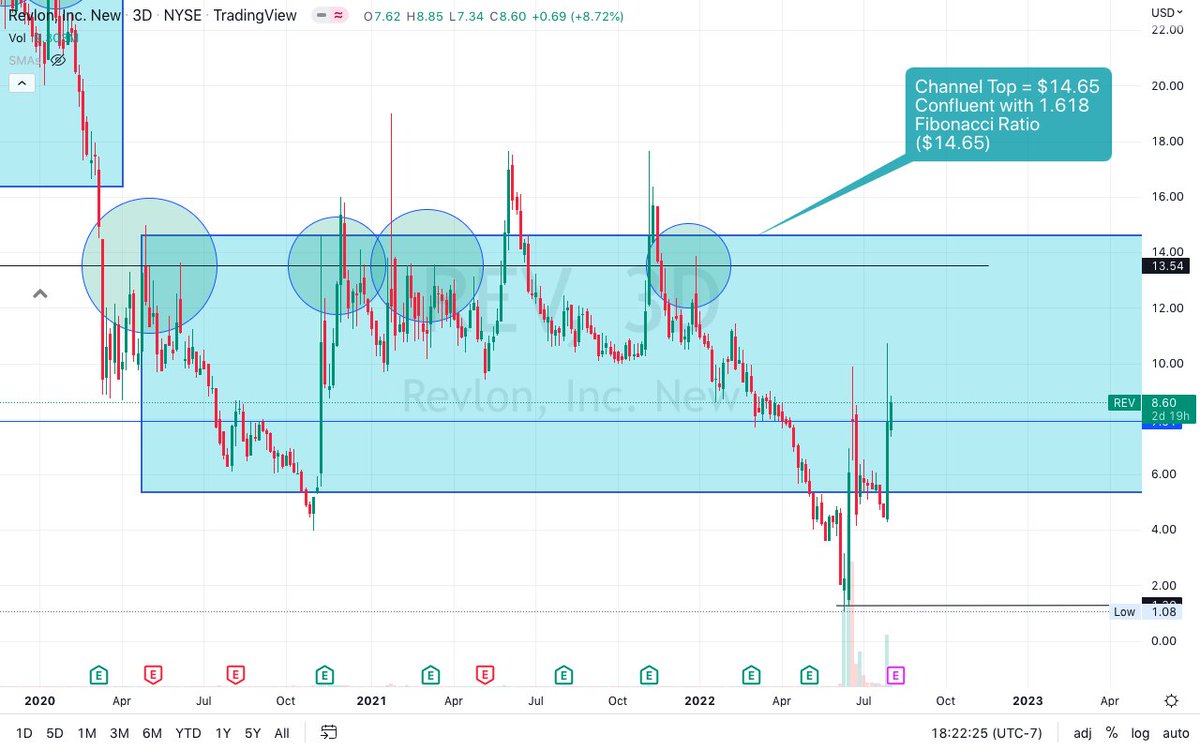
$RDBX-New Formation PT 1: The daily 10 day simple moving average is acting as support from today's run. Confirming support above this average can prove worthy for #rdbx #stock. The real obstacle would be the cross of the daily SMA100 right after... cont 

$RDBX-New Formation PT 2: The bottom rectangular support we've had for days is working perfectly and is also helping form our previously implied #bullflag formation. This candle will close in 2 trading days and still within the channel bounds... cont 

$RDBX-New Formation PT 3: Daily #RSI indicator is pivoted straight up and about to re-enter the bullish control zone. The moving average seems to have worked as a form of support... cont 

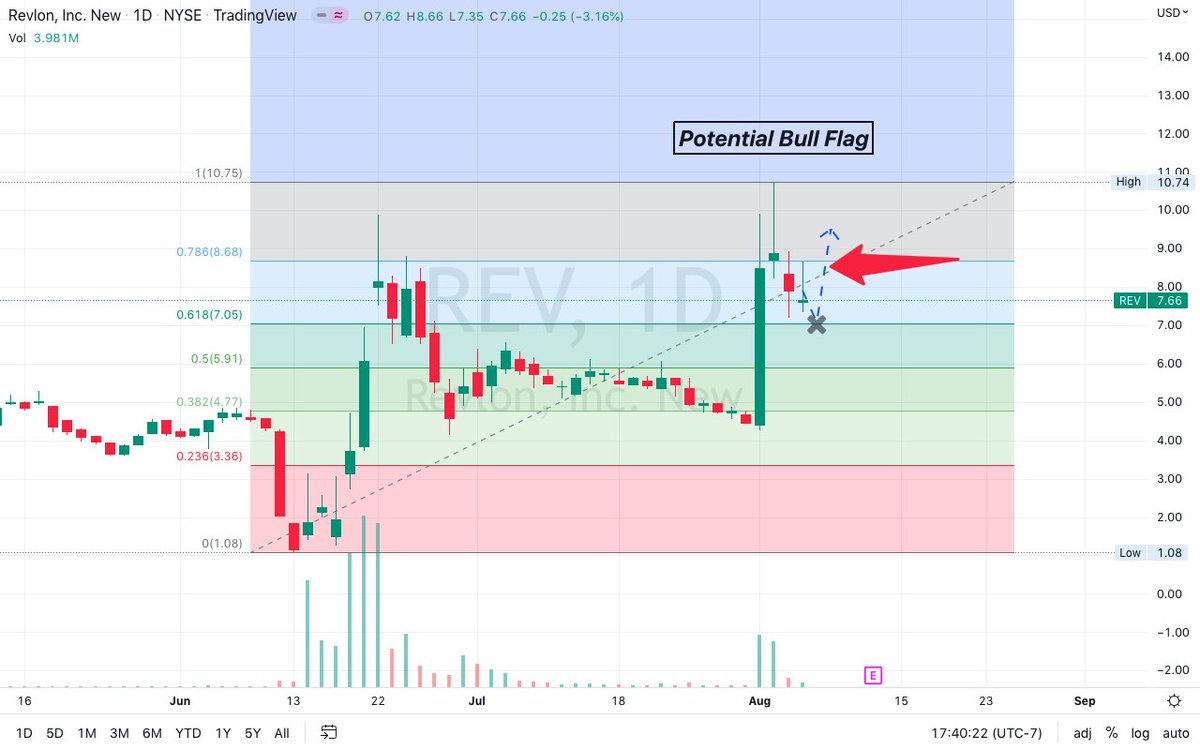
$REV-Continuation PT 2: the #bullflag we mentioned in yesterdays TA looks to be playing nicely. We would need to break through the daily SMA200 and confirm support to move to the upside... cont 

$REV-Continuation PT 3: I expect a continuation down to the 0.618 #fibonacci ratio ($7.05) to bounce passed the 0.786 ($8.68) to continue onto the 1 fib ($10.75). Confirming support at the $10.75 level can take us to interesting levels... cont 
$BBBY-Formation Confirmed PT 1: The SMA100 played the support just like we spoke about yesterday. In doing so, the pattern became more apparent. To gain an edge on an area for either take profit or interest, let's take some #Fibonacci targets... cont 

$REV-Macro Perspective PT 2: Our implied pattern is a #cupandhandle. We mentioned yesterday that we'd be able to form this candle only if we found support off of the 100 day simple moving average... cont 

#Priceaction
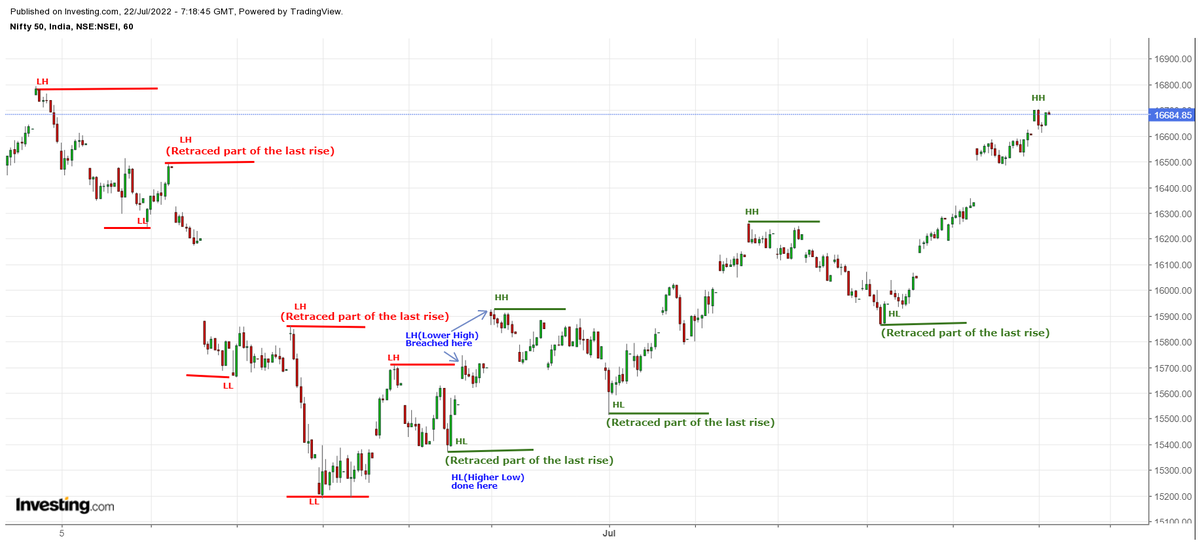
IF trader, then study "Hour chart" of at least 30 trading days
Watch how #prices are #Trending & you take a position when trend changes, say, from making "LH & LL" to "HL & HH" & Vice Versa
This is the 1st & foremost step & absolutely noiseless
#Retracement helps🙏
IF trader, then study "Hour chart" of at least 30 trading days
Watch how #prices are #Trending & you take a position when trend changes, say, from making "LH & LL" to "HL & HH" & Vice Versa
This is the 1st & foremost step & absolutely noiseless
#Retracement helps🙏
#Priceaction Step:2
All traders know Demand & Supply to exploit the difference - a basic trait of any trader/ businessman.
What captures this absolutely is #Trendline & #Channel
For Eg: When prices break out of a falling T.Line/ Channel, it means demand has overpowered supply
All traders know Demand & Supply to exploit the difference - a basic trait of any trader/ businessman.
What captures this absolutely is #Trendline & #Channel
For Eg: When prices break out of a falling T.Line/ Channel, it means demand has overpowered supply

That's first clue-buyers are asserting. LH & LL would soon change.
Next step is to look for a Fibonacci #retracement to hold @ 38% or 50% or 61.8% (to make HL) with a bullish candle like #Bullishengulfing or #Bullishpinbar @ a % of previous rise which is your perfect LRHR entry
Next step is to look for a Fibonacci #retracement to hold @ 38% or 50% or 61.8% (to make HL) with a bullish candle like #Bullishengulfing or #Bullishpinbar @ a % of previous rise which is your perfect LRHR entry
⏳4592307816 Occurs at position 60 in π. It includes the ten numbers. 666 relating to 6x6x6=216. 216 relating to the diameter of the moon 2160 Miles. 351, 26th Triangular. 26 letters in the English alphabet. 60, a whole when taking about time. 22/7=3.14... 2083 the 314th prime⌛️ 

🧵THREAD - RETRACEMENTS DE FIBONACCI
L'indicateur #Fibonacci est utilisé en analyse technique pour trouver les meilleures zones d'achat et de vente d'un actif. 🤑
C'est l'un des indicateurs les plus utilisés en #trading et devinez quoi ?
Ce n'est pas si compliqué
Le guide👇
L'indicateur #Fibonacci est utilisé en analyse technique pour trouver les meilleures zones d'achat et de vente d'un actif. 🤑
C'est l'un des indicateurs les plus utilisés en #trading et devinez quoi ?
Ce n'est pas si compliqué
Le guide👇

L'objectif est d'analyser un mouvement haussier 📈 ou baissier 📉 existant, et d'anticiper où le prix pourrait revenir selon les niveaux donnés par Fibonacci, et ce sur n'importe quel graphique (Actions, #Cryptos )
Commençons par un rapide tutoriel pour trouver l'indicateur sur le site @tradingview et le paramétrer 🔍
Dans la barre latérale de votre écran (version ordinateur), sélectionnez l'indicateur "Retracement de Fibonacci".
Dans la barre latérale de votre écran (version ordinateur), sélectionnez l'indicateur "Retracement de Fibonacci".

🧵THREAD - TRADER LES SUPPORTS ET RESISTANCES
Les supports et les résistances sont des outils de base en analyse technique, utilisés par les #Traders pour s'en mettre plein les poches.🤑
L'objectif 🎯 est de trouver les meilleurs prix d'entrées📈 et de sorties 📉
Le guide 👇
Les supports et les résistances sont des outils de base en analyse technique, utilisés par les #Traders pour s'en mettre plein les poches.🤑
L'objectif 🎯 est de trouver les meilleurs prix d'entrées📈 et de sorties 📉
Le guide 👇

[#THREAD]
35000€ DE PERTE, L'HISTOIRE DERRIERE LA CREATION DE 4 KINGS 🔥
Les Bro, vous avez été super nombreux à nous demander l'histoire derrière #4Kings. Alors là voilà ! C'est long mais vrai 🙂
Si notre histoire vous parle, un ❤️ et 🔁 ça nous fera beaucoup de bien 🙏🏻
35000€ DE PERTE, L'HISTOIRE DERRIERE LA CREATION DE 4 KINGS 🔥
Les Bro, vous avez été super nombreux à nous demander l'histoire derrière #4Kings. Alors là voilà ! C'est long mais vrai 🙂
Si notre histoire vous parle, un ❤️ et 🔁 ça nous fera beaucoup de bien 🙏🏻
1) Les Flambeurs au Casino
2) Le Chute
3) La Prise de Conscience
4) Hermes et la Stratégie des 4 Rois
5) 4 Kings
2) Le Chute
3) La Prise de Conscience
4) Hermes et la Stratégie des 4 Rois
5) 4 Kings
[#THREAD]
Vous êtes vous déjà dit : "J'ai acheté trop tard" ou "J'ai vendu trop tôt"!
Rationalisez votre stratégie d'investissement grâce à la plateforme 4kings.xyz
Venez découvrir cet outil d'aide à l'investissement et rendez vos positions lucratives sans stress
Vous êtes vous déjà dit : "J'ai acheté trop tard" ou "J'ai vendu trop tôt"!
Rationalisez votre stratégie d'investissement grâce à la plateforme 4kings.xyz
Venez découvrir cet outil d'aide à l'investissement et rendez vos positions lucratives sans stress

[DISCLAIMER]
Les méthodes et #outils présentés dans ce #thread ne constituent pas un conseil en #investissement.
Par ailleurs, s'appuyer sur cet outil ne vous dispense pas de réaliser des recherches sur les fondamentaux des projets.
Les méthodes et #outils présentés dans ce #thread ne constituent pas un conseil en #investissement.
Par ailleurs, s'appuyer sur cet outil ne vous dispense pas de réaliser des recherches sur les fondamentaux des projets.

In this thread I am sharing Trading Setup, which can be used to find 𝑹𝒆𝒗𝒆𝒓𝒔𝒂𝒍 𝑺𝒕𝒐𝒄𝒌𝒔 after a 𝑫𝒐𝒘𝒏𝒕𝒓𝒆𝒏𝒅.
I have shared such trading setups in the past as well.
Like❤️& Retweet🔄for wider reach and for more such learning thread in the future.
1/10
I have shared such trading setups in the past as well.
Like❤️& Retweet🔄for wider reach and for more such learning thread in the future.
1/10
🔴Crucial Moving Average (#EMA)
Generally, all stocks have tendencies to retrace back to EMA and this is called Mean Reversion.
200 EMA is a crucial one which can be used to find support for stocks during downtrend.
It works on Daily, Weekly and Monthly time frame.
2/10
Generally, all stocks have tendencies to retrace back to EMA and this is called Mean Reversion.
200 EMA is a crucial one which can be used to find support for stocks during downtrend.
It works on Daily, Weekly and Monthly time frame.
2/10
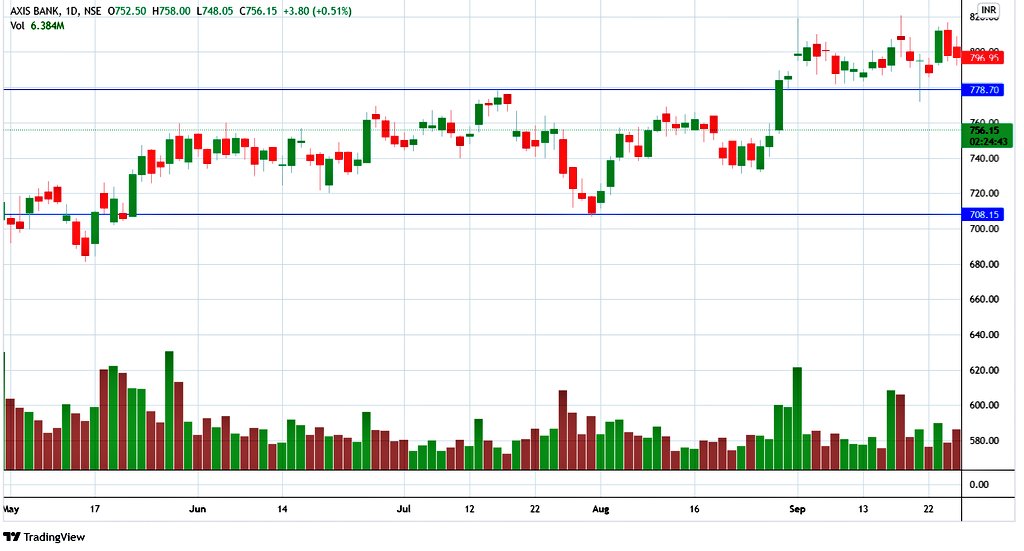
1. If the market is in a trading range or trending: Traders must know that if this happens, there's a higher probability of right #trades. Always remember, the trend is your best friend (2/18) 

#Traders must also ask if the prices are in a strong trend and if they want to continue to move along with this trend. (3/18) 
Merhaba arkadaşlar,
Bugün yine piyasada çok duyduğunuz bir terimi konuşmak istiyorum.
Bu terim Fibonacci.
Bir çok analist fibonacci seviyelerini kullanarak teknik destek noktaları ya da hedefler belirleyip bunlara göre trade yapıyor.
#BTC #Bitcoin #Fibonacci
Bugün yine piyasada çok duyduğunuz bir terimi konuşmak istiyorum.
Bu terim Fibonacci.
Bir çok analist fibonacci seviyelerini kullanarak teknik destek noktaları ya da hedefler belirleyip bunlara göre trade yapıyor.
#BTC #Bitcoin #Fibonacci
Peki, Fibonacci nedir ? nasıl hesaplanır ? Hesaplamak için çok büyük araçlara gerek var mıdır ? Herşeyden öte, Fibonacci işe yarayan bir araç mıdır ?
#BTC #Bitcoin #Fibonacci
#BTC #Bitcoin #Fibonacci
İlk sorumuza cevap verelim.
İşin tarihini merak edenler araştırabilirler, ben oraya girmiyeceğim.
Çünkü konumuzla alakasız.
#BTC #Bitcoin #Fibonacci
İşin tarihini merak edenler araştırabilirler, ben oraya girmiyeceğim.
Çünkü konumuzla alakasız.
#BTC #Bitcoin #Fibonacci
ℹ️En el siguiente hilo voy analizar técnicamente el gráfico de #Bitcoin, entendemos que los ciclos no son ni serán iguales, pero te sorprenderías de la simetría técnica que tienen, como ciclos alcistas que son.
1/
1/
El análisis fundamental y la métrica On-chain son igual de importantes para tomar decisiones a la hora de invertir.
Pero hoy nos centraremos en el análisis técnico, si eres de los que espera un tuit de Elon Musk para invertir, no es tu hilo.
2/
Pero hoy nos centraremos en el análisis técnico, si eres de los que espera un tuit de Elon Musk para invertir, no es tu hilo.
2/
Here are some ways to screen for stocks.
I use @TrendSpider but if you don't have a screener in your trading software, you can use FinViz for free.
#PupThread
🧵👇
I use @TrendSpider but if you don't have a screener in your trading software, you can use FinViz for free.
#PupThread
🧵👇
@TrendSpider 1/ Why screen for stocks?
This is one of the best ways to catch a stock before it's about to move. Having a repeatable screen that you use is a defined edge in trading.
This is one of the best ways to catch a stock before it's about to move. Having a repeatable screen that you use is a defined edge in trading.
@TrendSpider 2/ When looking for stocks, the goal is to find those true market leaders right before or right as they are about to move.
Let's take a look at some ideas to screen for below 👇
Let's take a look at some ideas to screen for below 👇
#Nifty
There are 2 Key retraces to follow for the Day.
1st is fm 17281 - 17420 @ 17330-350 (Aggressive)
2nd is fm 17064 - 17420 @ 17240-285(Conservative)
Based on Pivot tables,
17310-335 is a key support zone,
17470-500 is a key resistance zone.
There are 2 Key retraces to follow for the Day.
1st is fm 17281 - 17420 @ 17330-350 (Aggressive)
2nd is fm 17064 - 17420 @ 17240-285(Conservative)
Based on Pivot tables,
17310-335 is a key support zone,
17470-500 is a key resistance zone.

#Nifty
There are 2 Key retraces to follow for the Day.
1st is fm 17281 - 17420 @ 17330-350 (Aggressive)
2nd is fm 17064 - 17420 @ 17240-285(Conservative)
Based on Pivot tables,
17310-335 is a key support zone,
17470-500 is a key resistance zone.
There are 2 Key retraces to follow for the Day.
1st is fm 17281 - 17420 @ 17330-350 (Aggressive)
2nd is fm 17064 - 17420 @ 17240-285(Conservative)
Based on Pivot tables,
17310-335 is a key support zone,
17470-500 is a key resistance zone.

#Nifty
Based on Pivot tables,
17310-335 is a key support zone,
17470-500 is a key resistance zone.
Didn't get the "BUY" trade
BUT, a "Sell" trade emerged @ "17470-500" with a high of 17490 with OB readings and generated
100+ points with a low of "17362"
Based on Pivot tables,
17310-335 is a key support zone,
17470-500 is a key resistance zone.
Didn't get the "BUY" trade
BUT, a "Sell" trade emerged @ "17470-500" with a high of 17490 with OB readings and generated
100+ points with a low of "17362"

There's always a lot of talk about an economic and financial crash. While there are a few who think everything will keep going up, I think we are going to see a mix of both. Allow me to explain. It appears #Crypto is heading towards a market cycle top with a full fib extension.
Most prefer to "Predict" where market will reverse.
Few want to "Follow" the trend
Choose your t/f combo & ride the trend till 1 trade gets stopped
Week & Day - Down & Down
Day & Hour - Down & sideways
(Predictors looking for morning star in "Day", Evening star formed in "Hour")
Few want to "Follow" the trend
Choose your t/f combo & ride the trend till 1 trade gets stopped
Week & Day - Down & Down
Day & Hour - Down & sideways
(Predictors looking for morning star in "Day", Evening star formed in "Hour")

How do you follow "Trend" ?
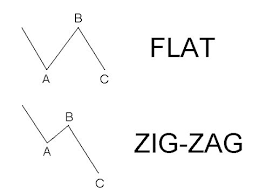
Get familiar with "ABC" correctives with the help of #Fibonacci Retracement
Have shown recently in many of the tweets, how this strategy alone produces LRHR trades
With experience, you'll learn to pull the trigger
For experience, you have to ACT/ TRADE
Get familiar with "ABC" correctives with the help of #Fibonacci Retracement
Have shown recently in many of the tweets, how this strategy alone produces LRHR trades
With experience, you'll learn to pull the trigger
For experience, you have to ACT/ TRADE
¿Cómo establecer profits en nuestras operaciones?
Si aún te cuesta establecer profits en las operaciones te interesa leer este hilo
Si aún te cuesta establecer profits en las operaciones te interesa leer este hilo
Establecer profits en nuestros trades siempre es algo complicado, siempre entran dudas como:
- ¿Y si sigue subiendo?
- Es que seguro que cierro ahora cae un poco y vuelve hacia arriba
- Venga $100 más y la cierro
O similares
- ¿Y si sigue subiendo?
- Es que seguro que cierro ahora cae un poco y vuelve hacia arriba
- Venga $100 más y la cierro
O similares
Si tenéis este tipo de dudas permitidme el atrevimiento pero, o lleváis muy poco tiempo en este mundo, o no tenéis ni idea de qué va esto
Para ser un buen trader jamás debes pensar algo de manera emocional, porque sino estás perdido
Debes establecer puntos/zonas clave de venta
Para ser un buen trader jamás debes pensar algo de manera emocional, porque sino estás perdido
Debes establecer puntos/zonas clave de venta


