Discover and read the best of Twitter Threads about #Retracement
Most recents (5)
#Priceaction
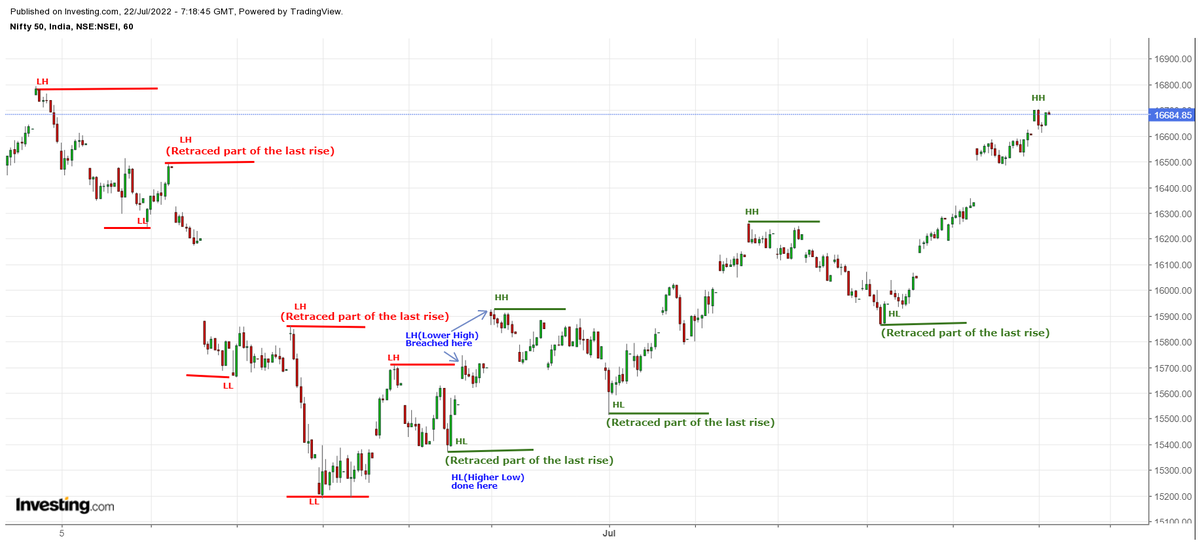
IF trader, then study "Hour chart" of at least 30 trading days
Watch how #prices are #Trending & you take a position when trend changes, say, from making "LH & LL" to "HL & HH" & Vice Versa
This is the 1st & foremost step & absolutely noiseless
#Retracement helps🙏
IF trader, then study "Hour chart" of at least 30 trading days
Watch how #prices are #Trending & you take a position when trend changes, say, from making "LH & LL" to "HL & HH" & Vice Versa
This is the 1st & foremost step & absolutely noiseless
#Retracement helps🙏

#Priceaction Step:2
All traders know Demand & Supply to exploit the difference - a basic trait of any trader/ businessman.
What captures this absolutely is #Trendline & #Channel
For Eg: When prices break out of a falling T.Line/ Channel, it means demand has overpowered supply
All traders know Demand & Supply to exploit the difference - a basic trait of any trader/ businessman.
What captures this absolutely is #Trendline & #Channel
For Eg: When prices break out of a falling T.Line/ Channel, it means demand has overpowered supply

That's first clue-buyers are asserting. LH & LL would soon change.
Next step is to look for a Fibonacci #retracement to hold @ 38% or 50% or 61.8% (to make HL) with a bullish candle like #Bullishengulfing or #Bullishpinbar @ a % of previous rise which is your perfect LRHR entry
Next step is to look for a Fibonacci #retracement to hold @ 38% or 50% or 61.8% (to make HL) with a bullish candle like #Bullishengulfing or #Bullishpinbar @ a % of previous rise which is your perfect LRHR entry
#Reliance
2 Scenarios likely.
In ST, both point towards a min. rise to 50DSma, 2615
50% - 61.8% #retracement of last fall from 2817 to 2365 @ 2591-2645
2 Scenarios likely.
In ST, both point towards a min. rise to 50DSma, 2615
50% - 61.8% #retracement of last fall from 2817 to 2365 @ 2591-2645

#Nifty
Started last fall fm "17664" on 13th with 1 & 2
Would complete 3rd @ open @ 17220-263, then 4th & 5th.
Last fall #retracement from "17512 - 172xx"
MEma-17175
WLEma-17155
50DSma-17165
Pivot's S3-17195
VF's T6: 17197
IF correction, it must limit to 17220 @ open & then 17165
Started last fall fm "17664" on 13th with 1 & 2
Would complete 3rd @ open @ 17220-263, then 4th & 5th.
Last fall #retracement from "17512 - 172xx"
MEma-17175
WLEma-17155
50DSma-17165
Pivot's S3-17195
VF's T6: 17197
IF correction, it must limit to 17220 @ open & then 17165

#Nifty @ 17108-137 of VF's trade table's key level with a low of "17130"
#Banknifty
Only with #Elliottwave & #Retracement strategy
You got 1st trade @ 36191 @ open for 36425
You got 2nd trade @ 36267-36298 for 36400 so far
Only with #Elliottwave & #Retracement strategy
You got 1st trade @ 36191 @ open for 36425
You got 2nd trade @ 36267-36298 for 36400 so far

How the grind to unfold... #Banknifty 

Analysis: #NYSE $HON
Case 268 #Honeywell International Inc.
DISCLAIMER: The analysis is strictly for educational purposes and should not be construed as an invitation to trade.
#HON 1/4
Case 268 #Honeywell International Inc.
DISCLAIMER: The analysis is strictly for educational purposes and should not be construed as an invitation to trade.
#HON 1/4

Chart 1
Weekly Chart: The steep and violent decline from Jan. 2020 has created long term damage to the #uptrend - the last time price traded below the SMA 200 was back in Oct. 2011. Formidable #resistance is .....
HON 2/4
Weekly Chart: The steep and violent decline from Jan. 2020 has created long term damage to the #uptrend - the last time price traded below the SMA 200 was back in Oct. 2011. Formidable #resistance is .....
HON 2/4


