Discover and read the best of Twitter Threads about #d3js
Most recents (9)
For a decade+, grammar-of-graphics approaches (ggplot, Tableau, #d3js, Vega/Altair) have been a leading way to make visualizations. Beyond chart templates & low-level programming, are there compelling alternatives? Or does the future lie in abstractions on top of these grammars?
There's exciting research work on new/extended grammars, including:
- probability expressions 📊 (mjskay.com/papers/chi2020…)
- responsive charts 📲 ()
- animation 🕺 (idl.cs.washington.edu/papers/gemini2, gganimate, and new @vega_vis work coming to VIS'22 from @mitvis)
- probability expressions 📊 (mjskay.com/papers/chi2020…)
- responsive charts 📲 ()
- animation 🕺 (idl.cs.washington.edu/papers/gemini2, gganimate, and new @vega_vis work coming to VIS'22 from @mitvis)
.@_mcnutt_ has written a valuable survey of JSON-style grammars (arxiv.org/pdf/2207.07998…), concluding there is "No Grammar to Rule Them All". Should we expect a proliferating multiverse of visualization grammar variants? Where might we look beyond (or building on) such grammars?
Tomorrow is the last day of #d3js a workshop I'm facilitating for @MICA_MPS. It's been a great challenge - while most of the students have dataviz skills, the majority have no coding experience. Sound like you? Peek into the thread for a D3 starter roadmap. (0/8)
1. Set your expectations. D3 has a steep learning curve. Why do you want to learn it? Will it help you attain your goals? Can you commit to least a few years? If you're still convinced, focus on D3 'literacy' - able to read & tweak pre-existing code - and lay your foundation.
2. Learn SVG, CSS, HTML and basic JS first. You won't get anywhere without it. Here's a free course with everything you need to know from @createwithdata learn.createwithdata.com/product/fundam…
Another year of #TidyTuesday now complete! 🎉Here is a collage of all the participants with more than 10 posts over 2021. Big thanks to @thomas_mock for leading the initiative🙌
Interactive version: kaustavsen.github.io/tidytuesday-co…
#RStats #d3js #dataviz
1/3
Interactive version: kaustavsen.github.io/tidytuesday-co…
#RStats #d3js #dataviz
1/3
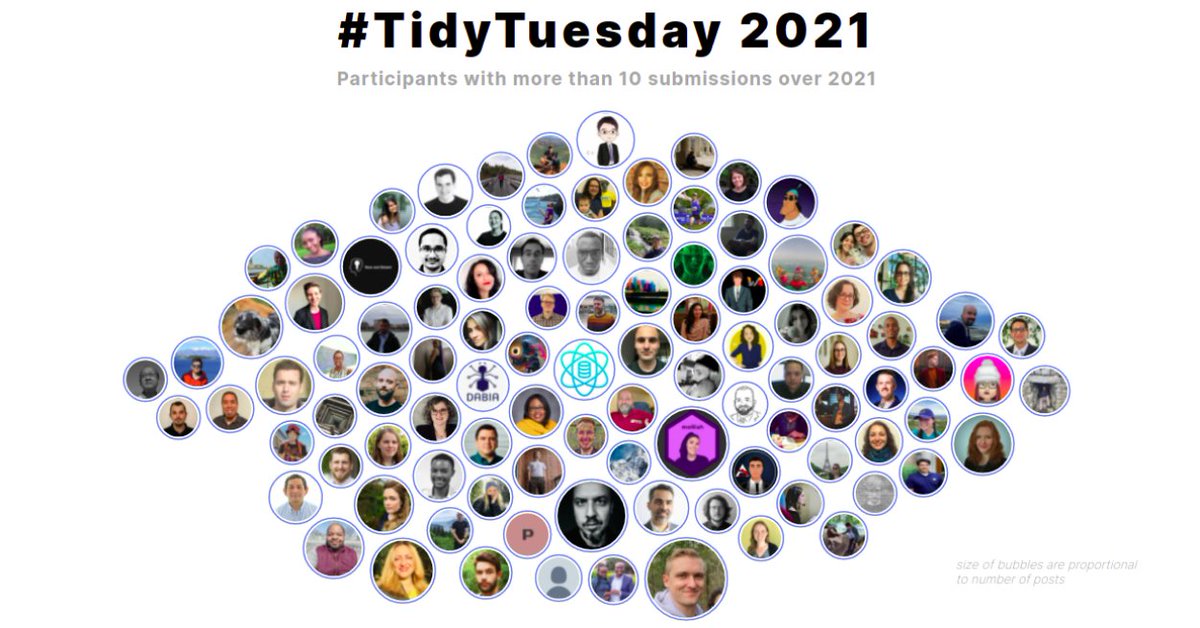
It was really fun participating and also browsing through the amazing charts by y'all.
Initial data cleaning for the collage done in R with final plot created with d3.js
All code on github here: github.com/kaustavSen/tid…
2/3
Initial data cleaning for the collage done in R with final plot created with d3.js
All code on github here: github.com/kaustavSen/tid…
2/3
Finally look forward to more plotting come 2022! (Hopefully will continue my R+d3 learning journey in the coming year 😅).
Also, do let me know in case of any comments / suggestions on how to improve this collage. Will definitely look to incorporate into the 2022 version!
3/3
Also, do let me know in case of any comments / suggestions on how to improve this collage. Will definitely look to incorporate into the 2022 version!
3/3
I have shunned MATLAB for Python, I have sipped vintage FORTRAN 77 and published Java Applets at the turn of the millennium. I want to offer a grounded perspective on the benefits of doing science online. 

woah! today was my first day at @observablehq and I am so excited 😆
if you've followed me at all, you know this is a dream job: making it easier to use / play / think with #d3js will be a big part of my focus...
i mean, just look at this stuff! observablehq.com/@d3/gallery
if you've followed me at all, you know this is a dream job: making it easier to use / play / think with #d3js will be a big part of my focus...
i mean, just look at this stuff! observablehq.com/@d3/gallery
I don't yet know exactly how this will manifest.
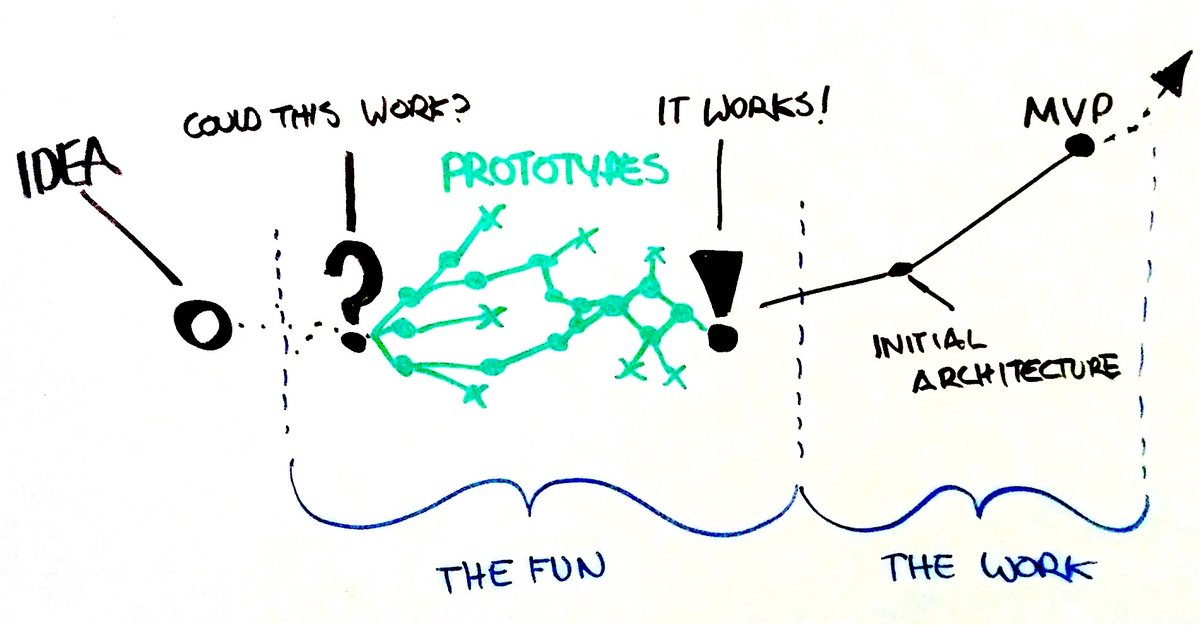
I drew this diagram 5 years ago about where I like to focus my energy in the product development process.
@observablehq notebooks basically let me stay in "the fun" all the time...
but the definition of fun is relative!
I drew this diagram 5 years ago about where I like to focus my energy in the product development process.
@observablehq notebooks basically let me stay in "the fun" all the time...
but the definition of fun is relative!
when I first started learning #d3js I banged my head against the wall for 2 reasons:
1) I didn't understand the browser (DOM, JS, CSS etc.)
2) I didn't know how to think with d3: declaratively and data-driven.
Once I got a handle on these 2, the power (and the fun) came out...
1) I didn't understand the browser (DOM, JS, CSS etc.)
2) I didn't know how to think with d3: declaratively and data-driven.
Once I got a handle on these 2, the power (and the fun) came out...
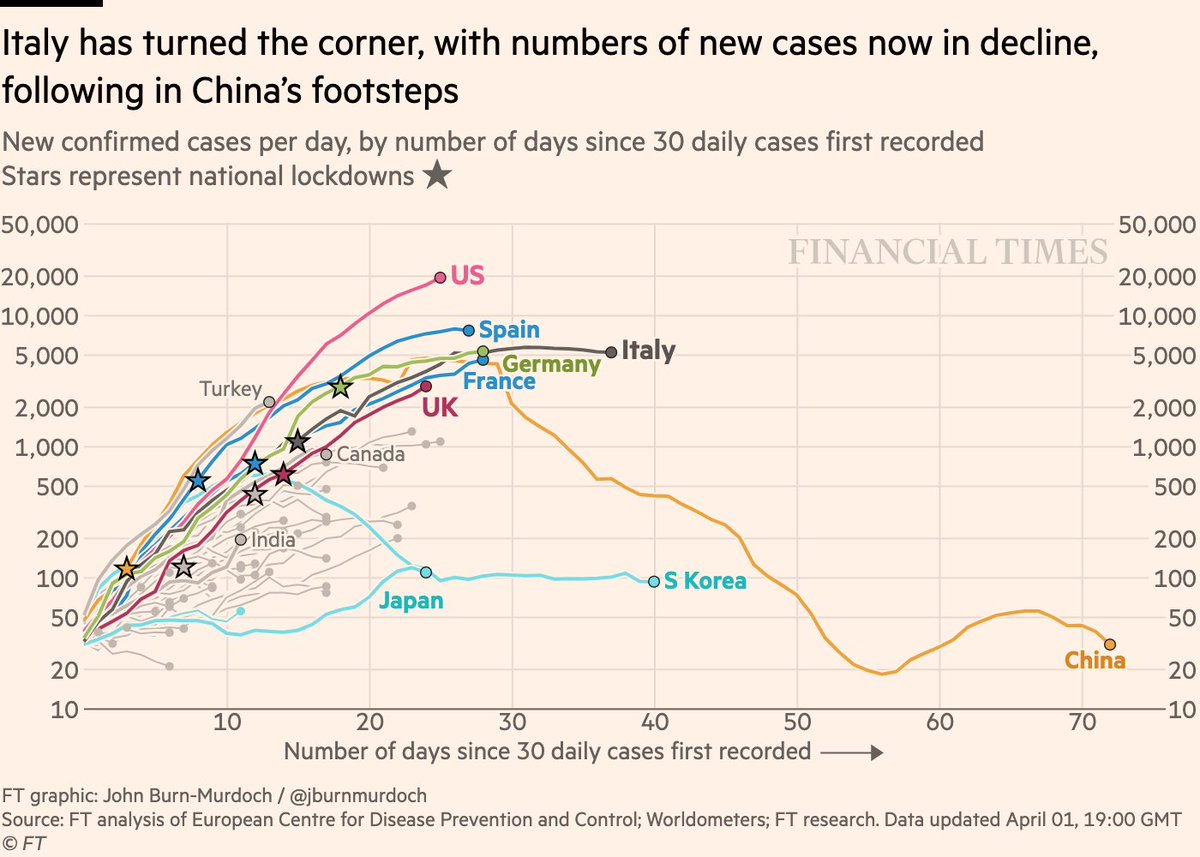
NEW: Wed 1 April update of coronavirus trajectories
First, daily new cases (rather than yesterday’s weekly version)
One of these is not like the others.
Many outbreaks are slowing but in the US every day brings more new cases than the last
Live charts: ft.com/coronavirus-la…
First, daily new cases (rather than yesterday’s weekly version)
One of these is not like the others.
Many outbreaks are slowing but in the US every day brings more new cases than the last
Live charts: ft.com/coronavirus-la…
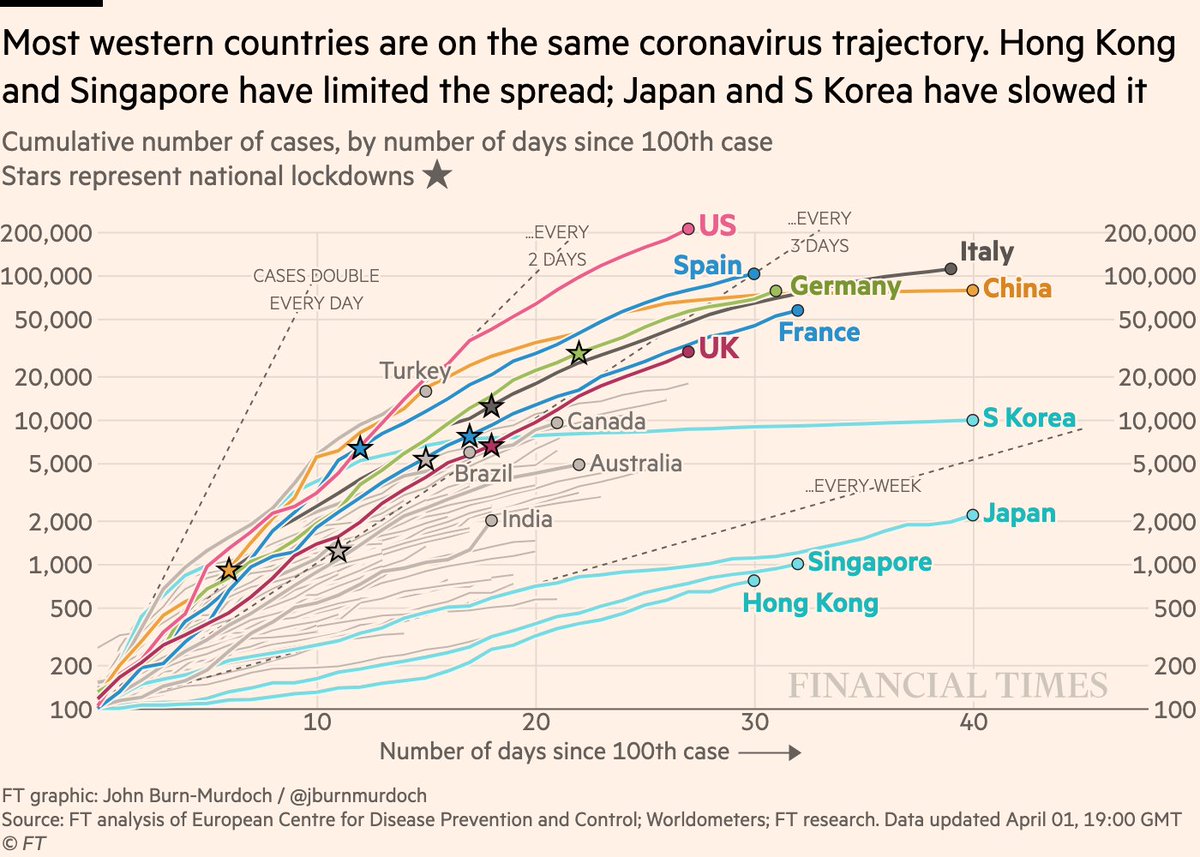
How does that look on the old cumulative chart?
I doubled the top of my y-axis from 100k to 200k cases, but the US has broken straight through it 📈
US curve is higher and steeper than any other, as the lack of early testing or lockdowns takes its toll. Action now is too late.
I doubled the top of my y-axis from 100k to 200k cases, but the US has broken straight through it 📈
US curve is higher and steeper than any other, as the lack of early testing or lockdowns takes its toll. Action now is too late.
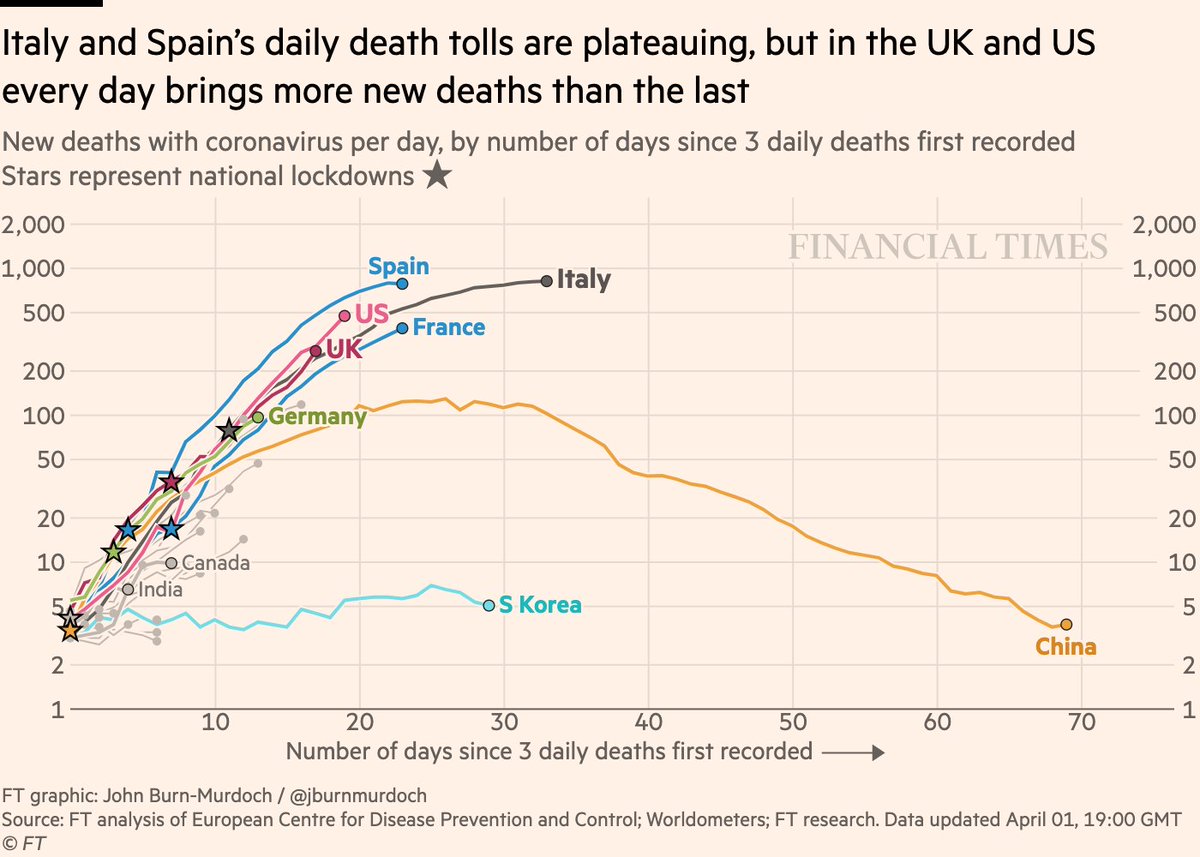
Now onto *daily new deaths*:
• Daily death tolls flattening in Italy & Spain: each new day brings fewer deaths
• But in UK & US the death toll is accelerating. More dead every day than the last, and rate of increase also rising
Live charts: ft.com/coronavirus-la…
• Daily death tolls flattening in Italy & Spain: each new day brings fewer deaths
• But in UK & US the death toll is accelerating. More dead every day than the last, and rate of increase also rising
Live charts: ft.com/coronavirus-la…
Attention web cartographers: Today I'm releasing d3-geo-scale-bar version 1! It's a JavaScript library that makes it easy to add scale bars to your #D3js maps. Here's an introduction and tutorial on @observablehq: observablehq.com/@harrystevens/… #cartography 

@observablehq Just give it a projection, and it'll give you a scale bar. It even plays nicely with transitions! observablehq.com/@harrystevens/…
@observablehq It also plays nicely with d3-zoom. observablehq.com/@harrystevens/…
love reading the threads, want to challenge myself:
Machine Learning <-> Data visualization
1 like = 1 opinion
Machine Learning <-> Data visualization
1 like = 1 opinion
1. all data is subjective.
data are measurements of systems taken by particular people from a particular perspective
data are measurements of systems taken by particular people from a particular perspective
2. the future of data visualization is machine learning.
THREAD: I wrote a post on @observablehq about a map I made today. It shows a typical day in the life of a graphics journalist: You never know what problems you'll have to solve on deadline! observablehq.com/@harrystevens/… #d3js #dataviz 1/7 
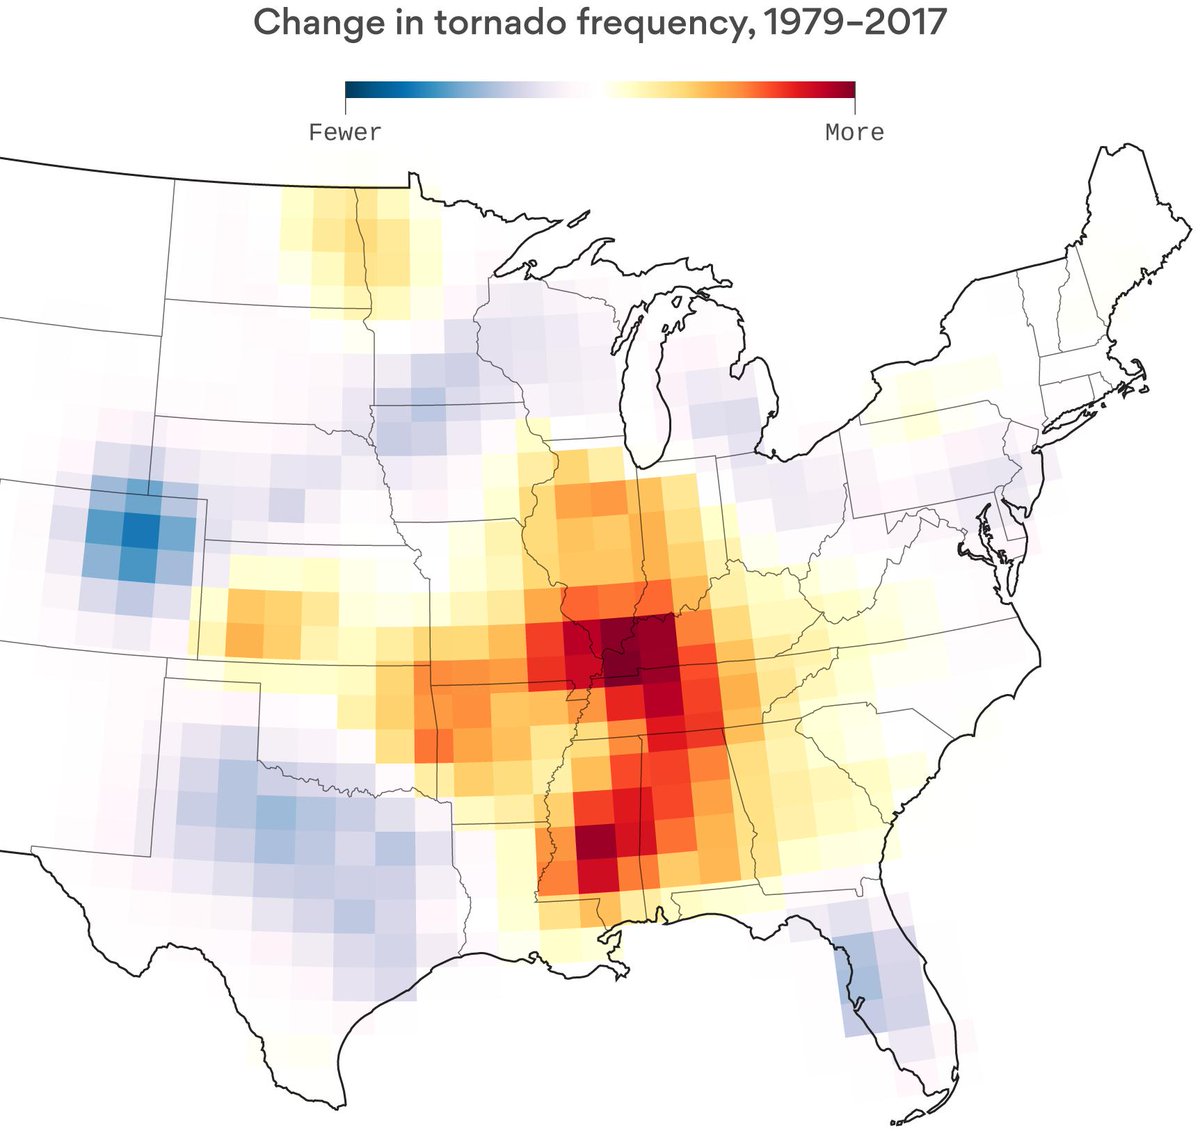
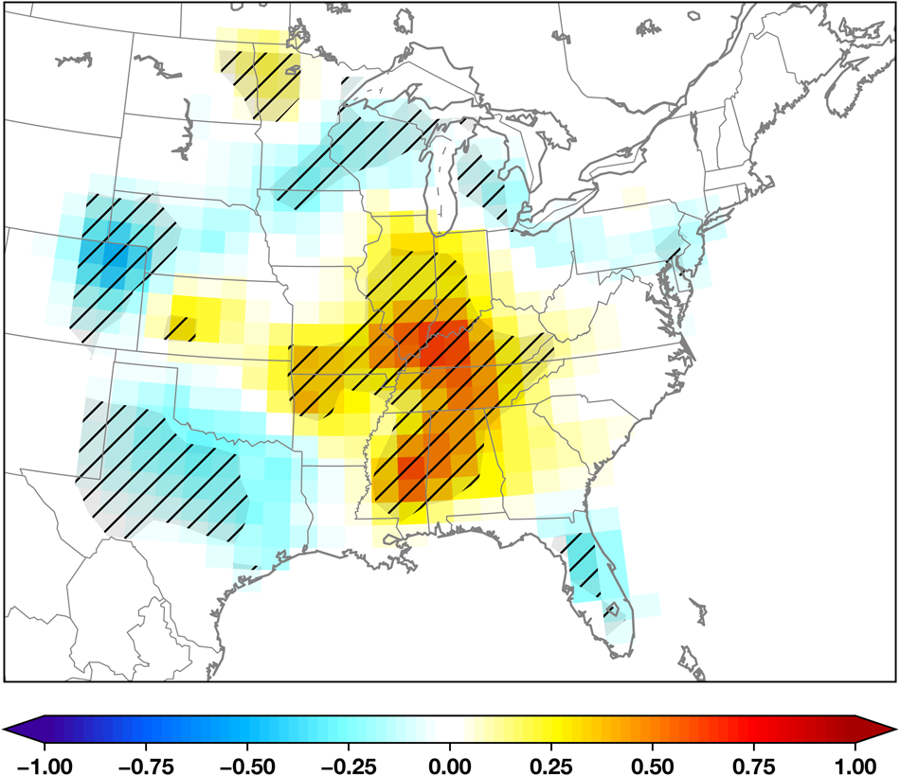
The task was to reproduce this map that appeared in a Nature article about how the frequency of tornadoes has changed in different parts of the U.S. nature.com/articles/s4161… 2/7 
I don't know why this thread got broken up, but you can pick it up here:


