Discover and read the best of Twitter Threads about #Trendlines
Most recents (24)
Technical Analysis 101: A Beginner's Guide to Trading Crypto Using Charts💸📈
1/🧵 Welcome to my #TechnicalAnalysis guide! In this thread, we'll explore what technical analysis is, how it works, and how you can use it to make informed trading decisions in the world of #crypto. Don't forget to like, retweet, and follow for more crypto content! 🚀
2/📈 What is Technical Analysis? Technical Analysis (TA) is a method of analyzing the price movements of an asset, such as a cryptocurrency, using charts and indicators. It aims to identify patterns and trends that can help traders make decisions about when to buy or sell. #TA
🚨Trend lines are lines that are drawn on a stock chart to show the direction in which the price of a security is moving. #Trendlines
1. They can be used to identify trends in the market and to make predictions about where the price of a security is likely to go in the future.
What is the Relative Strength Index (RSI), and how do you use it?
Developed by J. Welles Wilder in 1978, the Relative Strength Index(RSI) is a momentum oscillator that measures the speed and change of price movements.
#TradingSignals #RSI
🧑🏫Let's Learn!
Educational 🧵👇
1/
Developed by J. Welles Wilder in 1978, the Relative Strength Index(RSI) is a momentum oscillator that measures the speed and change of price movements.
#TradingSignals #RSI
🧑🏫Let's Learn!
Educational 🧵👇
1/

The RSI is an oscillator with a range from 0 to 100
There are 3 main values of interest:
🔵Below 30 signals that the market is oversold 📉
🔵50 signals neutral 😐
🔵Above 70 signals overbought 📈
2/
There are 3 main values of interest:
🔵Below 30 signals that the market is oversold 📉
🔵50 signals neutral 😐
🔵Above 70 signals overbought 📈
2/

The #RSI indicator has been featured in many books and articles over the years. Even though the it was created well before the computer era, it is still a widely used indicator that traders use to determine momentum in any given market.
3/
3/

#CNXSMALLCAP at a precarious junction. If we break the trendline & horizontal #resistance, then the party will continue, else 🙃. Next week and this month closing will be crucial. #Trendlines #investing #relativestrength #CCI #breakout #pricexpansion #Momentum 
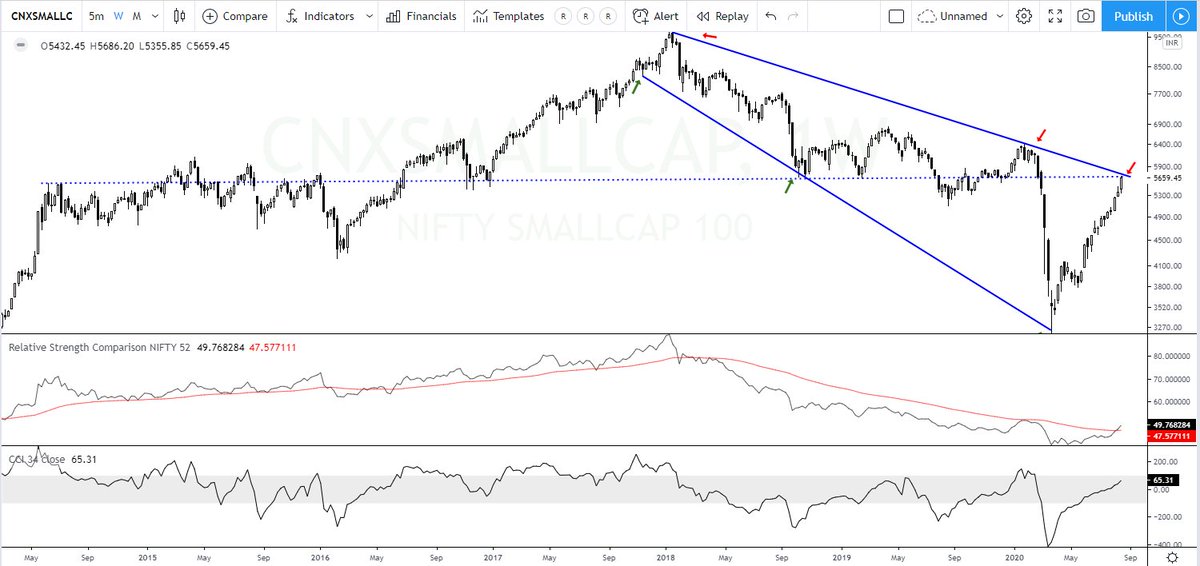
#CNXSMALLCAP still alive👀 

#CNXMIDCAP too alive😅 
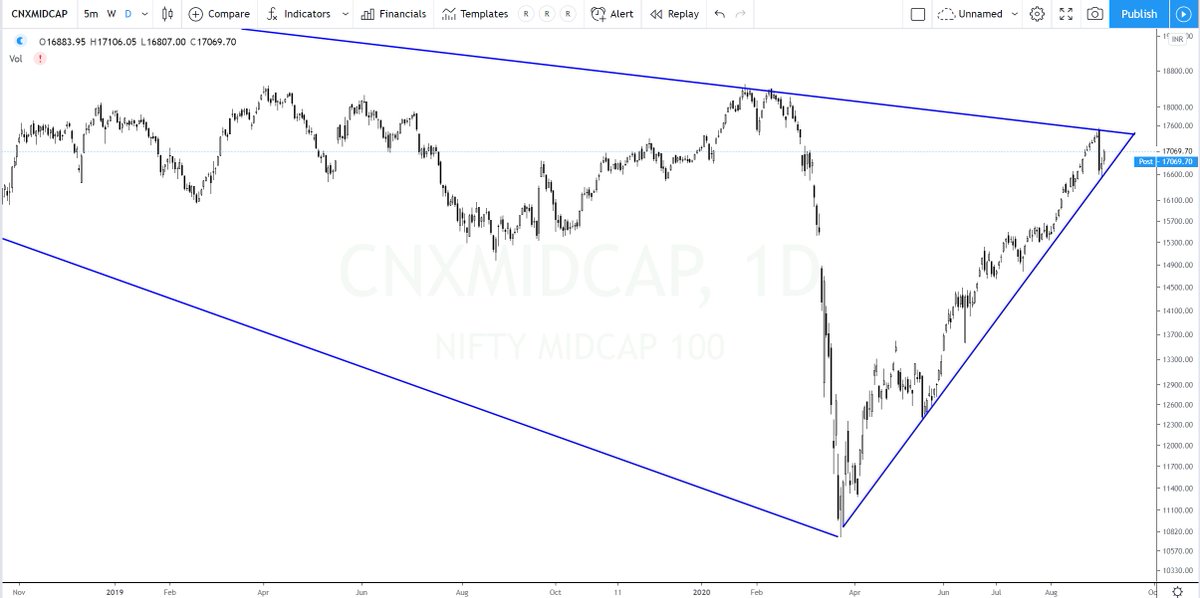
The following stocks are contracting and could possibly go up in the coming days.
SKM egg products
Shilpa medicare
Laksh Vilas bank
Kellton tech
Network18 media
Nectar Lifesciences
Career point
Manali petrochem
Morepen
Please define your risk & SL before taking the trades.
SKM egg products
Shilpa medicare
Laksh Vilas bank
Kellton tech
Network18 media
Nectar Lifesciences
Career point
Manali petrochem
Morepen
Please define your risk & SL before taking the trades.
I don't have the time to post the charts for all of them. But, these comprise some pullback and some trendline break trades. #stockideas #Trendlines #investing #relativestrength #CCI #breakout #pricexpansion #Momentum
Analysis: #NASDAQ $GRWG
Case 437 #GrowGeneration Corp.
DISCLAIMER: The analysis is strictly for educational purposes and should not be construed as an invitation to trade.
#GRWG 1/4
Case 437 #GrowGeneration Corp.
DISCLAIMER: The analysis is strictly for educational purposes and should not be construed as an invitation to trade.
#GRWG 1/4

Chart 1
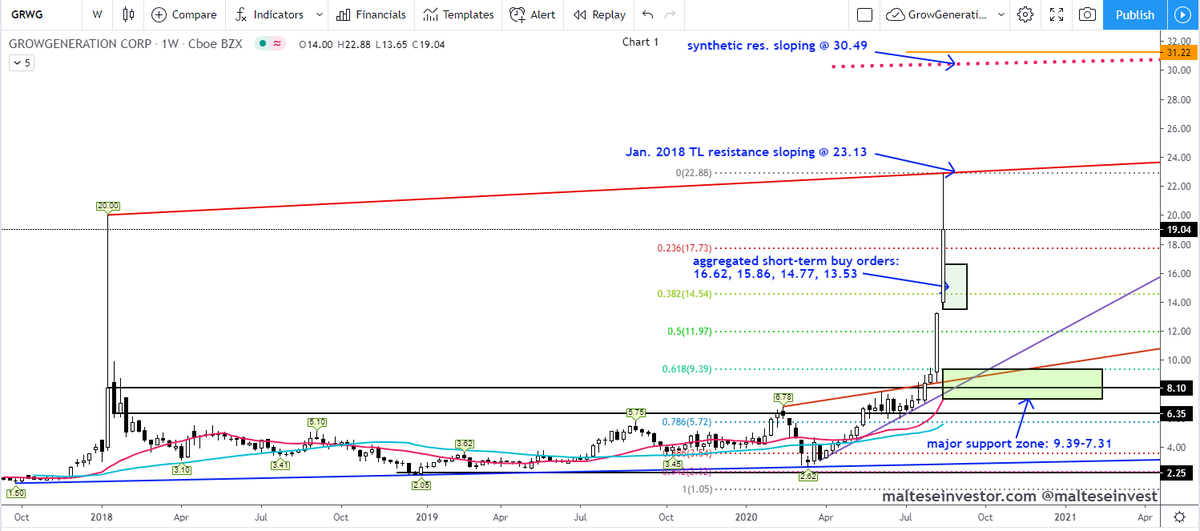
Weekly Chart: Price finally broke above the Jan. 2018 range top in July 2020, since then the price has gone #parabolic. A close/hold above 23.13 will target synthetic #resistances at 30.49-31.22 with a close above the latter targeting 38.27- 39.76. To the .....
GRWG 2/4
Weekly Chart: Price finally broke above the Jan. 2018 range top in July 2020, since then the price has gone #parabolic. A close/hold above 23.13 will target synthetic #resistances at 30.49-31.22 with a close above the latter targeting 38.27- 39.76. To the .....
GRWG 2/4
..... downside, aggregated short-term buy orders at 16.62, 15.86, 14.77 and 13.53 with the #Fib. 0.50 at 11.97, farther down the strong #support zone 9.39- 7.31 (Fib. 0.618, #trendlines and #pivots).
GRWG 3/4
GRWG 3/4
Analysis: #NYSE $GPS
Case 295 #The_Gap Inc.
DISCLAIMER: The analysis is strictly for educational purposes and should not be construed as an invitation to trade.
#GPS 1/4
Case 295 #The_Gap Inc.
DISCLAIMER: The analysis is strictly for educational purposes and should not be construed as an invitation to trade.
#GPS 1/4

Chart 1
Weekly Chart: The long term trend is very #bearish as price managed to break and close below the 10 and 30 year #trendlines. The inability to recapture and close above pivot #resistance at 9.09 is worrying. Sloping .....
GPS 2/4
Weekly Chart: The long term trend is very #bearish as price managed to break and close below the 10 and 30 year #trendlines. The inability to recapture and close above pivot #resistance at 9.09 is worrying. Sloping .....
GPS 2/4
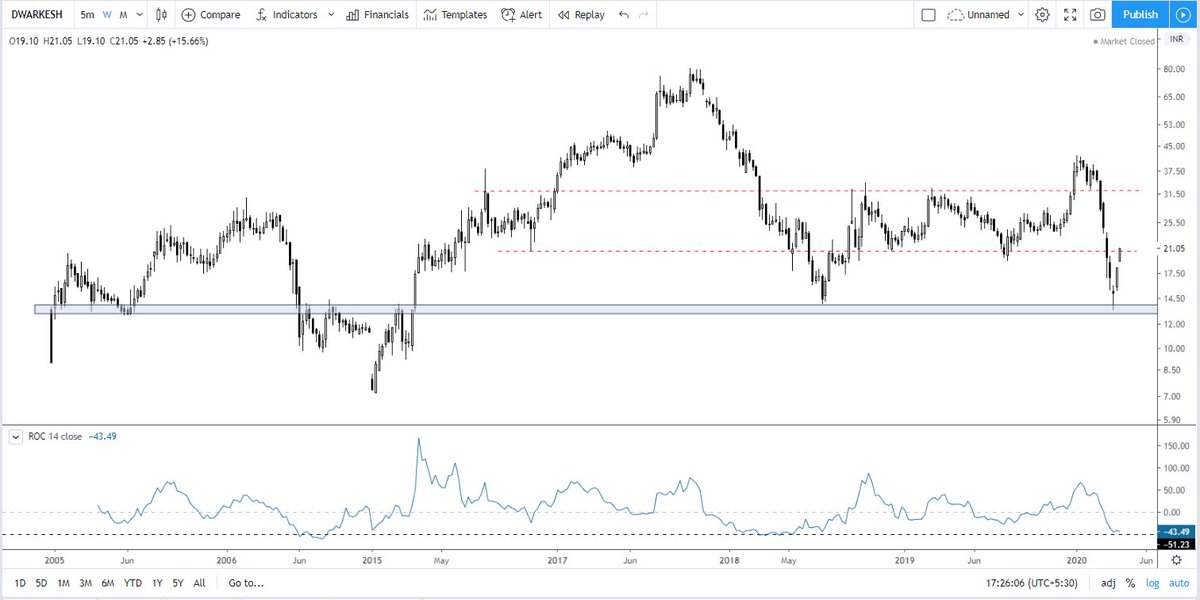
Sugar has been in a strong downtrend & the volatility is contracting in the last few years and has reversed twice already from multiyear demand zone. We witnessed a short rally from Aug'18 to Mar'20. Can we another rally again? #Sugar #commodities #trendlines #ROC #investing 1/n 

Dwarkesh already reversed from 16 levels which is also a strong demand zone and can now touch 33 again #Dwarkesh #sugar #trendlines #trading #investing #ROC 2/n 
Dhampur sugar also reversed from 70 odd levels and from a strong demand zone #Dhampursug #sugar #trendlines #trading #investing #ROC 3/n 

The Pharma sector has been in a strong downtrend after the high of Apr'15 and has been falling in a channel. The first attempt to break out was in Sep'18 but failed. Another attempt is in progress now after the stock retested 61.8% of the entire rally from Mar'09 to Apr'15. 1/n 

Will we see a breakout this time? No one knows, but the probability to breakout is clearly on the higher side after looking at last month's candle & the reversal level at 61.8% fib. What can one do? Start a SIP in one of the pharma funds & allocate a % depending on ur risk. 2/n
Cipla retraced 50% of the entire rally and reversed from trendline and horizontal support levels too. Awaiting breakout #CIPLA #trendlines #investing #fibonacci 

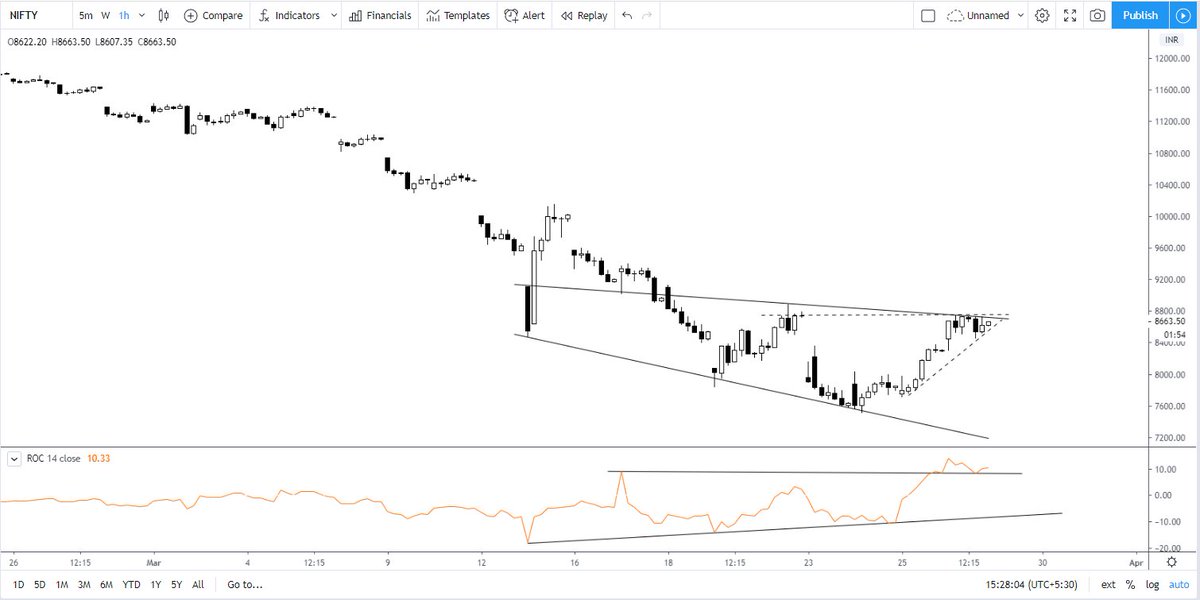
Nifty - first a divergence signalled possible short term bottom and now breaking out of the pattern. Headed to 8700-900 levels once we move above 8260-90 levels. #Nifty #trendlines #ROC #trading #coronamarketcrash 

Nifty right at some strong resistance. It seems like FM's speech can trigger downside again! #Nifty #trendlines #trading 

Nifty trying to test the upper range again and again! If we break out we are in for another rally, else back to square one! #Nifty #trendlines #trading 
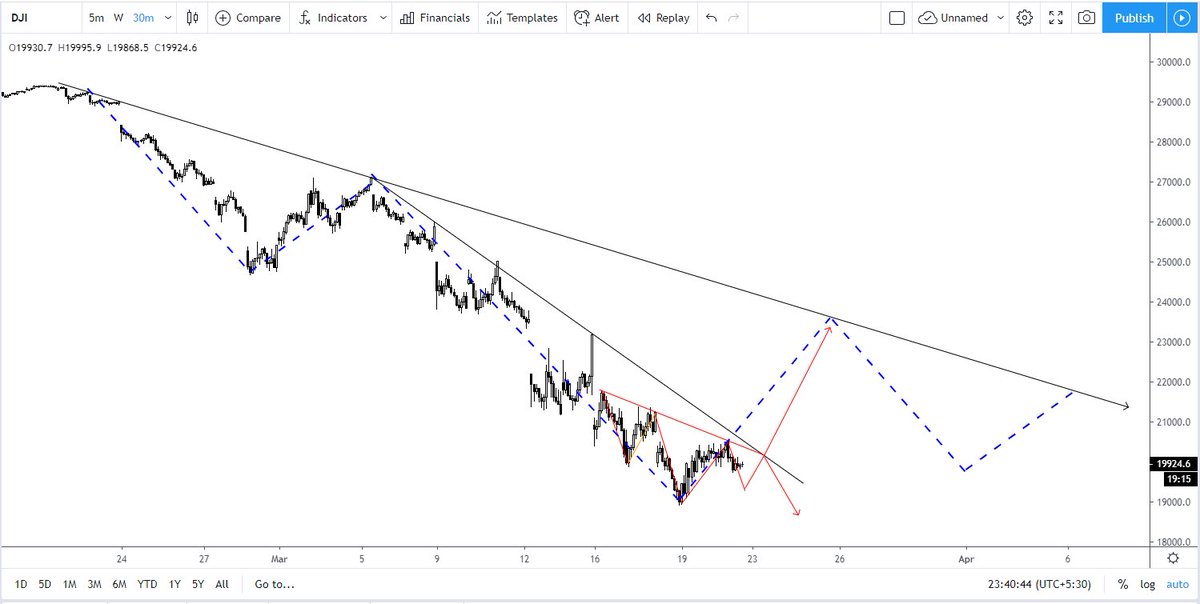
Dow Jones Possibilities - I can go 100% wrong, this is just an imagination. Forming a small HnS pattern & I expect the market to bounce next week & once we reach the resistance, another week of panic & downside, which should form the larger HnS pattern. #DJI #trendlines 
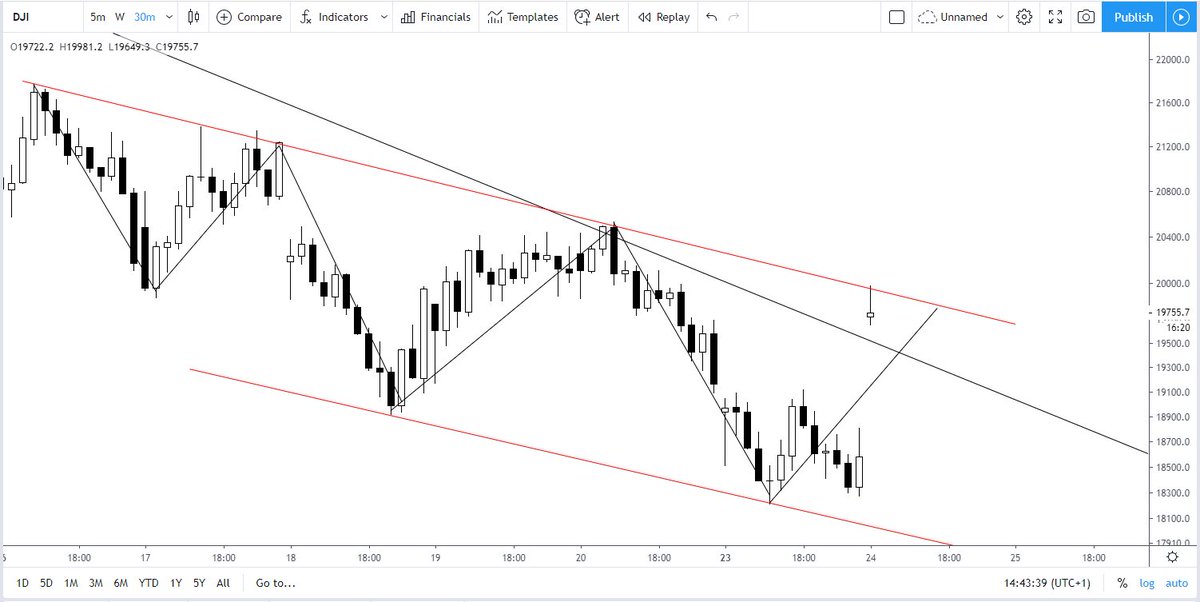
If today's low holds, we might be well in for a good bounce 🤞. #DJI #trendlines #trading #coronamarketcrash #Fedstim 

In markets, these simple but powerful lines act as very important demand and supply zones. If only we could understand them. Opened 7% up and rejected beautifully #DJI #trendlines #trading #coronomarketcrash #technicalanalysis 
Nifty still not out of the woods for long positions - stay cautious #Nifty #trendlines #trading #coronacrash 

A thread - Nifty and the sectoral Indices in India:
Nifty - A possible short term pullback from the trendline here. Nifty price is around the 38.2 fib level and trendline support. Probably a gap down and pullback tomorrow. 1/n
Nifty - A possible short term pullback from the trendline here. Nifty price is around the 38.2 fib level and trendline support. Probably a gap down and pullback tomorrow. 1/n

Nifty Auto - I see a short term pullback here too. Reasons being the price is now right at the downward sloping trendline and the price has retraced 61.8 fib levels of the entire rally from 2008 lows #CNXAUTO 2/n 

Nifty Metal - The price is right at the lows and should show some strong buying, which could lead to some pullback from here. Also, the price is at the downward sloping trendline and the lower line of the pitchfork. This convinces me of a short term pullback. #CNXMETAL 3/n 

Posting investment levels for a few good stocks. Not quite sure which levels we will get - totally depends on the market. But, one can add 25% of the planned quantity at each level. Define your risk first. 1/n
#Investing #Trendlines #Affle #Creditaccess #Dmart #Siemens


#Investing #Trendlines #Affle #Creditaccess #Dmart #Siemens


Dow Jones bulls are still putting a strong fight. Trading in a parallel channel. Can rally another 400-500 points from here!
#DJI #trading #trendlines #15mincharts
#DJI #trading #trendlines #15mincharts

Nifty Trading plan for tomorrow. Do ask questions and let me know if it helps everyone learn simple trendlines. I know there are too many lines, but observe the price action at all lines
#Nifty #trendlines #trading #5minscharts #tradingjourney #tradingplan #learning
#Nifty #trendlines #trading #5minscharts #tradingjourney #tradingplan #learning

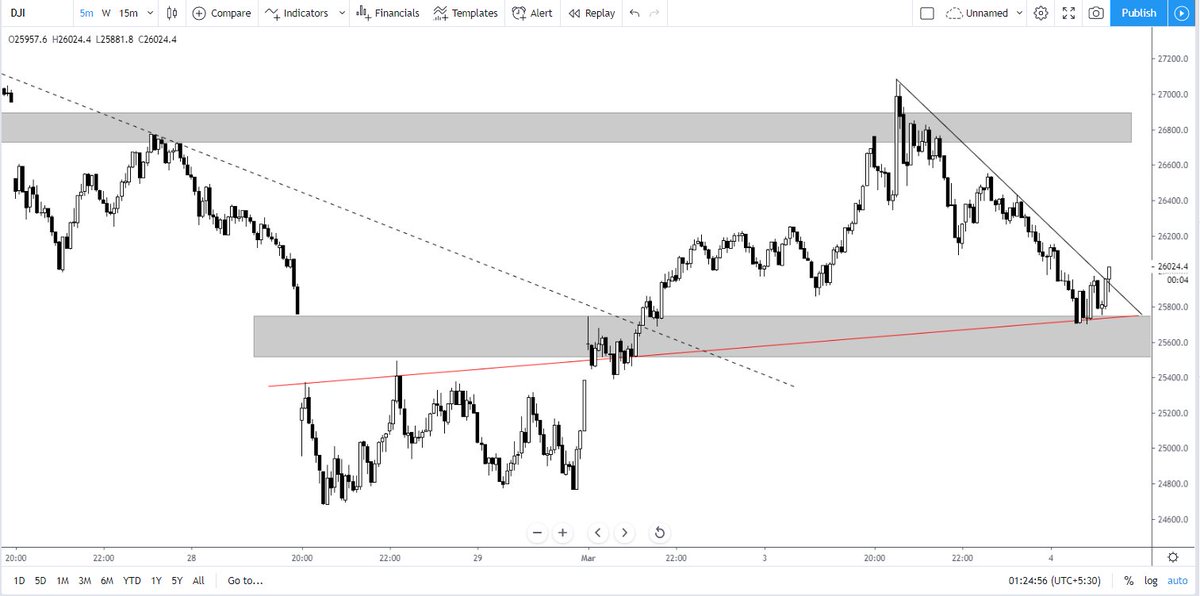
Dow Jones - Reversal still on cards if the red line holds, which acted as a resistance before breakout and support after the breakout. Also, the sloping solid black line acting as resistance needs to give up. Possibly by the close.
#DJI #trendlines #trading #intraday
#DJI #trendlines #trading #intraday
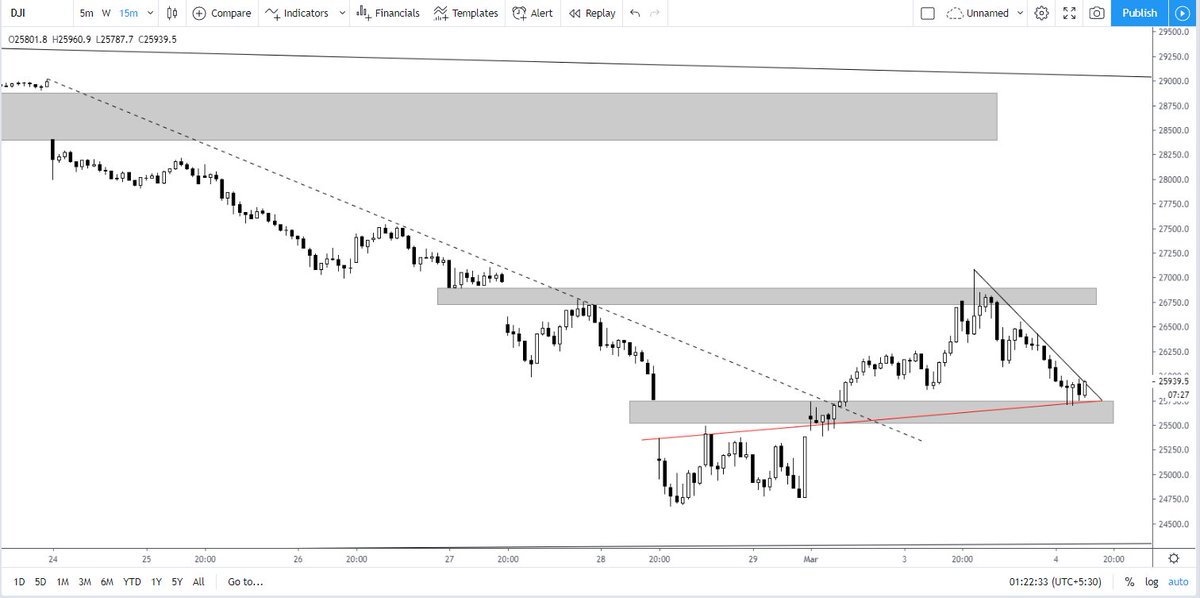
Nifty intraday charts - Why did Nifty fall at 2:00 PM today? Observe the trendline touch and massive fall after that. Why did nifty reverse again in the last 15 mins. Again, observe how the trendline was formed and the reversal happened.
#Nifty #trendlines #trading #5minscharts
#Nifty #trendlines #trading #5minscharts

One can make money just with trendlines, support, and resistances. But, it takes at least a year or two to master trendlines and to take trades based on that. Your eyes should be trained to spot it. And, you need the patience to wait for such trades.
Obviously, this is a hindsight analysis. But, that is how you start to learn. Draw trendlines, Support, and Resistances again and again in thousands of charts and master it. Over a period of time, you will gain confidence.
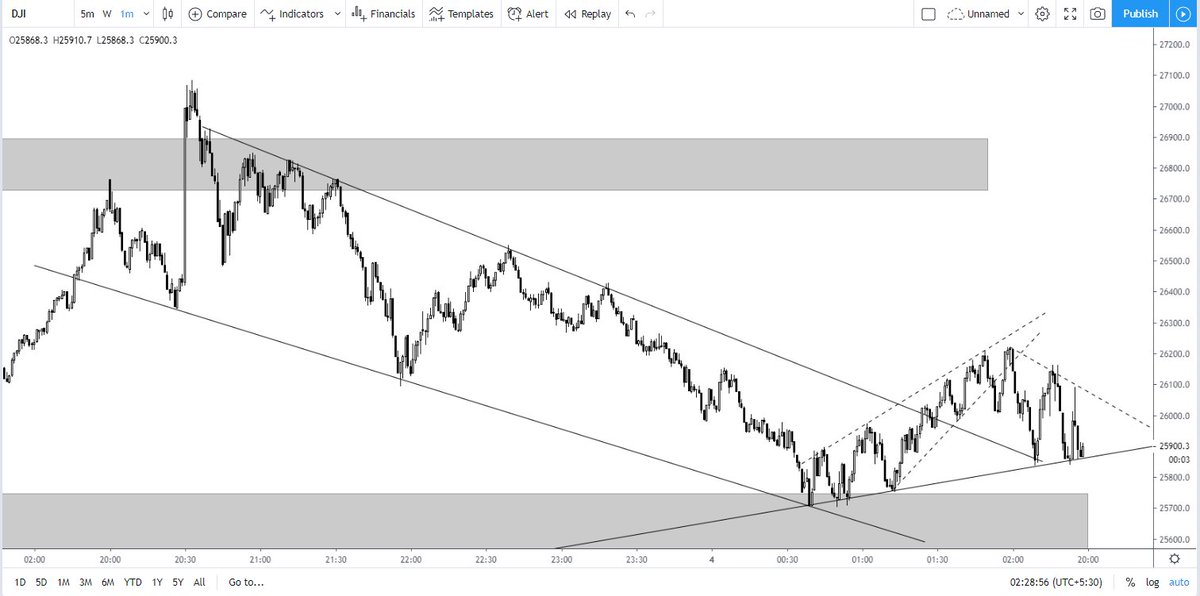
Dow Jones - Trendline Hindsight lessons! Why simple trendlines work? coz of pure demand and supply zones. Observe how the channel acted as support and resistance throughout the fall starting from the 20th Feb. Today is the 1st sign of reversal signs 1/n 
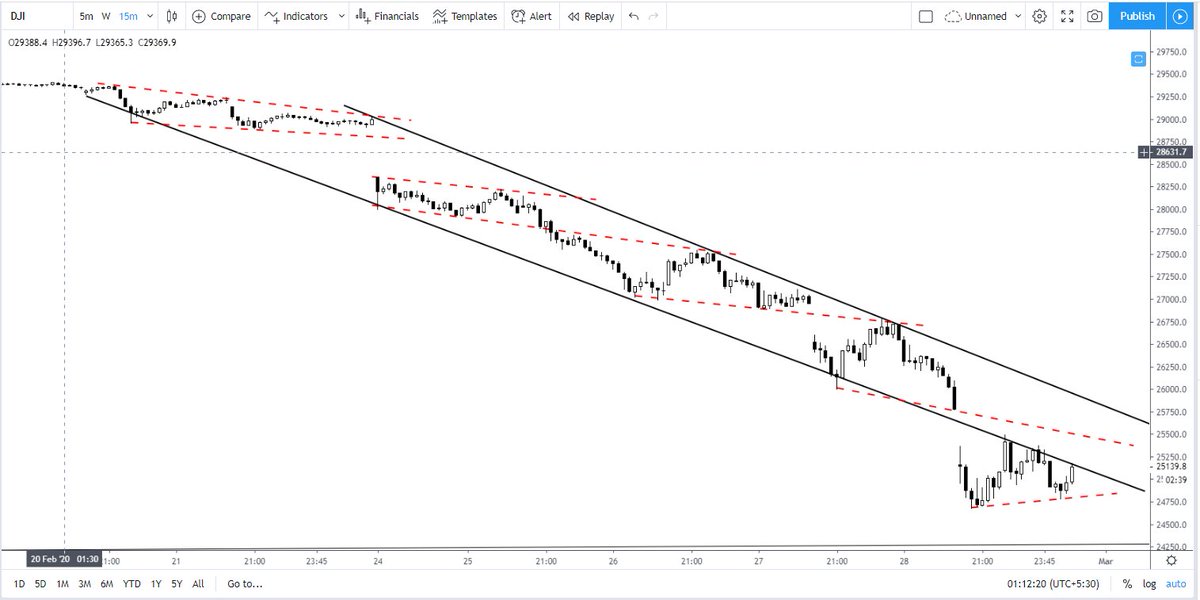
Why is it the first sign of reversal? higher low has formed for the first time in the entire fall and the price is piercing inside the channel as I post this. In a falling channel, the downward sloping channel on the right side acts as strong support always. 2/n
In an upward rising channel, the right trendline will act as support always. Another point to note is that in hindsight everything will look good, but in reality, it will be very challenging to trade this perfect downtrend #DJI #trendlines #trading #trendfollowing
Sample Investment portfolio - Fixed capital of 25000 per stock. Pyramiding to be done when a stock is moving up and breaking out of patterns on daily charts. Not more than 15 stocks in the portfolio at a time. Will replace stocks when SL hits, otherwise continue to hold. 

I will update this list every weekend based on weekly charts. This is purely for educational purposes alone - Not my portfolio. Charts are present on my timeline.
Nifty short term outlook - might face resistance around 12460-80 levels towards the upward channel. The yellow area is the point of reversal to note and for a very bearish outlook the lower channel needs to break. #Nifty #trendlines #trading #hourlycharts 

Nifty hourly charts - at the median point (yellow parallel line) of short term reversal. Tomorrow is key. #Nifty #trendlines #trading #hourlycharts 

Nifty hourly charts - watch out for reversal tomorrow at 12010-12030 levels which is also the gap support. If the bottom trendline doesn't hold, we will see a very strong correction in the coming days heading towards budget #Nifty #trendlines #trading #hourlycharts 

Dwarikesh sugar industries - Another example of reversal at trendlines. Low-risk trades are found near trendline supports and a 40% win ratio will make you profitable.. but you need to find your system and trust it #DWARKESH #trendlines #trading #5mincharts 

The stoploss is placed just below the low where the reversal happened
Dwarikesh Industries - Another chance to add.. Might spurt in the next few sessions if the parallel channel holds. #Dwarkesh #trading #trendlines #hourlycharts 

Nifty - at a crucial junction. Above 12225 we might head higher.. break of trendline which is being formed today in the 1 min chart will lead to retesting/filling today's gap. This is probably heading higher. #Nifty #trendlines #trading #15mincharts 


Tip - No trendline is perfect, but you need a trendline that touches at least 3 points to be sure it is right. The 3rd touch and reversal is the confirmation that your trendline is right. Refer to the 1 min chart today - the bars at 11:48 and 11:58 confirms the trendline is right
And again a reversal at 12:28 and 12:29 confirms it again. So the next trade for intraday would be to go
- Short: if the trendline is broken (safe players - short below 12205)
- Long: if 12220-12225 is taken out.
- Short: if the trendline is broken (safe players - short below 12205)
- Long: if 12220-12225 is taken out.
Nifty intraday view - Until the trendline on 5 mins chart that has been in formation since 12th December holds and we don't break 12020, new highs will be hit soon. #Nifty #trendlines #trading #5minschart
Tip - sometimes the trendlines from Gaps can also be drawn :)
Tip - sometimes the trendlines from Gaps can also be drawn :)

Nifty still in uptrend mode. Another chance for longs might come today possibly if trendline holds. #Nifty #trendlines #trading #15minschart 

trendline breakdown.. not valid anymore..


