Discover and read the best of Twitter Threads about #parabolic
Most recents (24)
Analysis: #NYSE $GSAT
Case 543 #Globalstar Inc.
DISCLAIMER: The analysis is strictly for educational purposes and should not be construed as an invitation to trade.
GSAT 1/3
Case 543 #Globalstar Inc.
DISCLAIMER: The analysis is strictly for educational purposes and should not be construed as an invitation to trade.
GSAT 1/3

Daily Chart: The #parabolic move seen in Feb. 2021 has made conditions messy - the correction hasn't ended and price is contained below the #SMA 20 and 50. The current target is the #pivot 1.02 with spikes down towards 0.92. Strong .....
GSAT 2/3
GSAT 2/3
..... #support 0.73/51 with the SMA 200 in between. Immediate #resistance is 1.48/56. Medium term #bullishness can only be achieved on a close above 3.53. Use price flexibility upon entering the trade.
The #Strategy is printed on the image.
GSAT 3/3
The #Strategy is printed on the image.
GSAT 3/3

۱-در ادامه بررسی بازار #اتریوم و پاسخ به این سوال که در کجای بازار هستیم، به دو معیار #onchain کابردی در زمان بندی چرخه اتریوم و (به احتمال قوی رمزارزهای مشابه) اشاره خواهیم کرد.
1- #MVRV - Market Value to Realized Value Ratio
2-
#Velocity
📌این #رشتو به معنای سیگنال نیست.
1- #MVRV - Market Value to Realized Value Ratio
2-
#Velocity
📌این #رشتو به معنای سیگنال نیست.
۲- معیار #Velocity و یا نسبت مجموع دلاری تراکنشها به میزان ارزش دلاری حال بازار #MarketValue در کنار #MVRV (نسبت میزان ارزش دلاری حال بازار به نسبت ارزش دلاری ذخیره شده بازار ) #RelizedMarketValue می توانند در تشخیص/تایید تغییر فاز بازار به کار گرفته بشوند.
۳- در مرحله انتهای بازار خرسی و تعادل نسبی خرید/فروش، بازیگران باتجربه در حال خرید ارزهای خرده فروشان ناامید از رشد بازار می باشند (#Capitulation). در این مرحله Velocity یا حجم تبادلات به ارزش کل بازار، کم نوسان و در در کمینه خود قرار دارد (خط سیاه). 

Analysis: #NASDAQ $CRSR
Case 512 #Corsair Gaming Inc.
Requested by: @physioo
DISCLAIMER: The analysis is strictly for educational purposes and should not be construed as an invitation to trade.
CRSR 1/3
Case 512 #Corsair Gaming Inc.
Requested by: @physioo
DISCLAIMER: The analysis is strictly for educational purposes and should not be construed as an invitation to trade.
CRSR 1/3

Daily Chart: Since the November 2020 #parabolic move the price corrected down to the #Fib. 0.50 but the reaction has seen little follow through and is currently confined to a triangle. A 2 day close below .....
CRSR 2/3
CRSR 2/3
Analysis: #NASDAQ $INO
Case 482 #InovioPharmaceuticals Inc
DISCLAIMER: The analysis is strictly for educational purposes and should not be construed as an invitation to trade.
#INO 1/4
Case 482 #InovioPharmaceuticals Inc
DISCLAIMER: The analysis is strictly for educational purposes and should not be construed as an invitation to trade.
#INO 1/4

Chart 1
Weekly Chart: The buy odas on the Feb. 2020 analysis failed to trigger. The strong #parabolic rise seen in June 2020 was followed by an equally strong correction which was halted at the #SMA 50. Price is currency attempting to close above .....
INO 2/4
Weekly Chart: The buy odas on the Feb. 2020 analysis failed to trigger. The strong #parabolic rise seen in June 2020 was followed by an equally strong correction which was halted at the #SMA 50. Price is currency attempting to close above .....
INO 2/4
..... the June 2020 #trendline with resistance seen at 19.27 (above the June 2009 trendline). Two balance points at 25.39 and 34.80 precede the major #resistance zone 36.00-42.00
INO 3/4
INO 3/4

Analysis: #NASDAQ $AYTU
Case 438 #Aytu BioScience Inc.
DISCLAIMER: The analysis is strictly for educational purposes and should not be construed as an invitation to trade.
#AYTU 1/5
Case 438 #Aytu BioScience Inc.
DISCLAIMER: The analysis is strictly for educational purposes and should not be construed as an invitation to trade.
#AYTU 1/5

Chart 1
Daily Chart: The #parabolic move seen in Mar.2020 stalled exactly at the one year trendline #resistance and has since corrected lower to the #Fib. 0.786 at 0.90, the gap has been partially filled - off by 0.45. #Momentum is negative and beginning to .....
AYTU 2/5
Daily Chart: The #parabolic move seen in Mar.2020 stalled exactly at the one year trendline #resistance and has since corrected lower to the #Fib. 0.786 at 0.90, the gap has been partially filled - off by 0.45. #Momentum is negative and beginning to .....
AYTU 2/5
..... fall. The range is 2.17- 0.58, heavier at the top due to short term profit taking. Price needs to close above the Mar. 2020 #trendline with #SMA 50 riding it at 1.41, then hold above 1.72 to target 2.01/05 but #bullishness will only be achieved by the .....
AYTU 3/5
AYTU 3/5
Analysis: #NASDAQ $GRWG
Case 437 #GrowGeneration Corp.
DISCLAIMER: The analysis is strictly for educational purposes and should not be construed as an invitation to trade.
#GRWG 1/4
Case 437 #GrowGeneration Corp.
DISCLAIMER: The analysis is strictly for educational purposes and should not be construed as an invitation to trade.
#GRWG 1/4

Chart 1
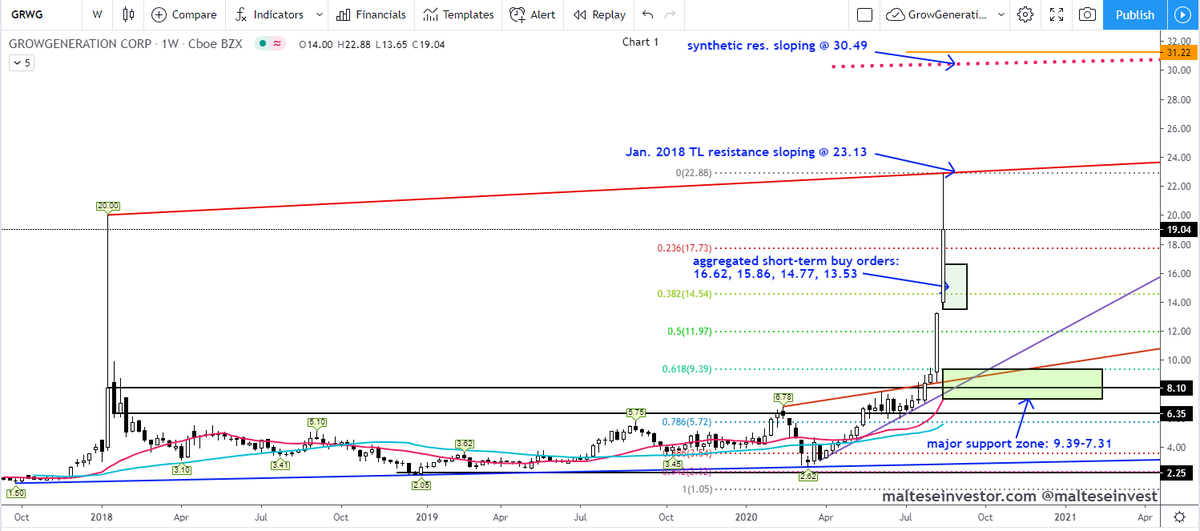
Weekly Chart: Price finally broke above the Jan. 2018 range top in July 2020, since then the price has gone #parabolic. A close/hold above 23.13 will target synthetic #resistances at 30.49-31.22 with a close above the latter targeting 38.27- 39.76. To the .....
GRWG 2/4
Weekly Chart: Price finally broke above the Jan. 2018 range top in July 2020, since then the price has gone #parabolic. A close/hold above 23.13 will target synthetic #resistances at 30.49-31.22 with a close above the latter targeting 38.27- 39.76. To the .....
GRWG 2/4
..... downside, aggregated short-term buy orders at 16.62, 15.86, 14.77 and 13.53 with the #Fib. 0.50 at 11.97, farther down the strong #support zone 9.39- 7.31 (Fib. 0.618, #trendlines and #pivots).
GRWG 3/4
GRWG 3/4
Analysis: #NYSE $SPAQ
Case 436 #SpartanEnergy Acquisition Corp.
DISCLAIMER: The analysis is strictly for educational purposes and should not be construed as an invitation to trade.
#SPAQ 1/5
Case 436 #SpartanEnergy Acquisition Corp.
DISCLAIMER: The analysis is strictly for educational purposes and should not be construed as an invitation to trade.
#SPAQ 1/5

Chart 1
Daily Chart: The #parabolic move seen in July 2020 has corrected lower and found #support around the Fib. 0.786 around 12.10. Since then activity has been lethargic with falling volumes and little interest to push either side of the range. Price needs .....
SPAQ 2/5
Daily Chart: The #parabolic move seen in July 2020 has corrected lower and found #support around the Fib. 0.786 around 12.10. Since then activity has been lethargic with falling volumes and little interest to push either side of the range. Price needs .....
SPAQ 2/5
..... to gain a foothold above the 15.45 pivot then reclaim/hold #Fib 0.382 at 16.98. Synthetic #resistance sloping at 17.48, a close/hold above is long term #bullish. To the downside support begins at .....
SPAQ 3/5
SPAQ 3/5
Analysis: #NYSE
Case 420 #Twilio Inc.
DISCLAIMER: The analysis is strictly for educational purposes and should not be construed as an invitation to trade.
#TWLO 1/4
Case 420 #Twilio Inc.
DISCLAIMER: The analysis is strictly for educational purposes and should not be construed as an invitation to trade.
#TWLO 1/4

Chart 1
Weekly Chart: May 2020 saw a strong close/hold above the Sept. 2020 #trendline resistance at 177.05, the #parabolic move targeted synthetic #resistance at 273.34 but the overextended move was unable to hold above and last .....
TWLO 2/4
Weekly Chart: May 2020 saw a strong close/hold above the Sept. 2020 #trendline resistance at 177.05, the #parabolic move targeted synthetic #resistance at 273.34 but the overextended move was unable to hold above and last .....
TWLO 2/4
Analysis: #NASDAQ $MVIS
Case 416 #MicroVision Inc
DISCLAIMER: The analysis is strictly for educational purposes and should not be construed as an invitation to trade.
#MVIS 1/4
Case 416 #MicroVision Inc
DISCLAIMER: The analysis is strictly for educational purposes and should not be construed as an invitation to trade.
#MVIS 1/4

Chart 1
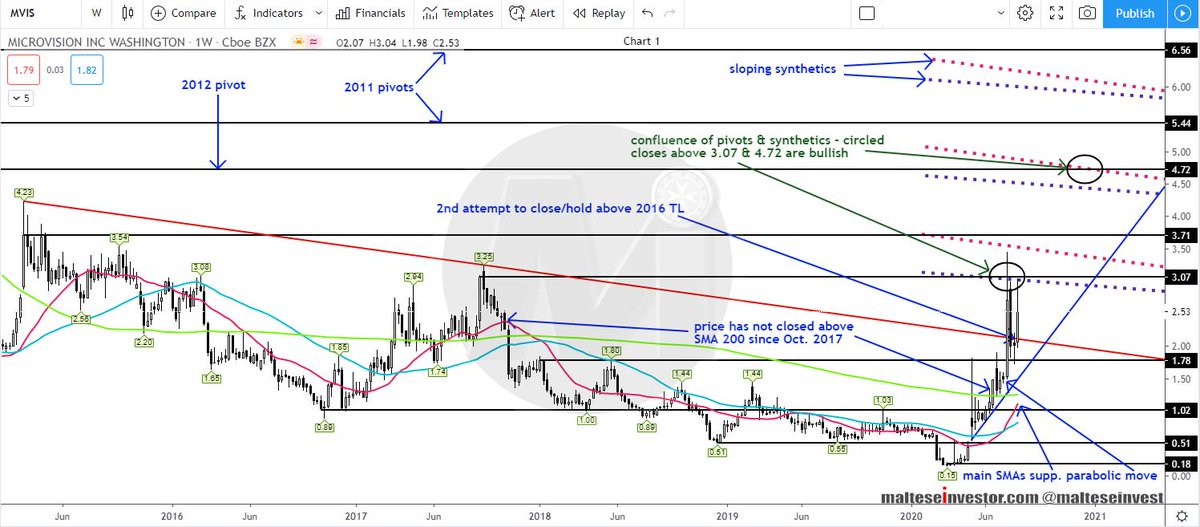
Weekly Chart: Price has gone #parabolic off the all time low at 0.15, smashing through 2016 and 2018 pivots, the #SMA 200 (last time it was above was in 2017) and Mar. 2015 #trendline resistance. However, it has .....
MVIS 2/4
Weekly Chart: Price has gone #parabolic off the all time low at 0.15, smashing through 2016 and 2018 pivots, the #SMA 200 (last time it was above was in 2017) and Mar. 2015 #trendline resistance. However, it has .....
MVIS 2/4
..... failed to close above the confluence of #pivot and synthetic #resistance at 3.07. A close/hold above targets the synthetic at 4.50 with the second confluence at 4.72 attracting - a close and hold above will eventually target 5.72 then the 2011 pivot at 6.56.
MVIS 3/4
MVIS 3/4
Analysis: #NASDAQ $LOGI
Case 409 #Logitech International S.A.
DISCLAIMER: The analysis is strictly for educational purposes and should not be construed as an invitation to trade.
#LOGI 1/4
Case 409 #Logitech International S.A.
DISCLAIMER: The analysis is strictly for educational purposes and should not be construed as an invitation to trade.
#LOGI 1/4

Chart 1
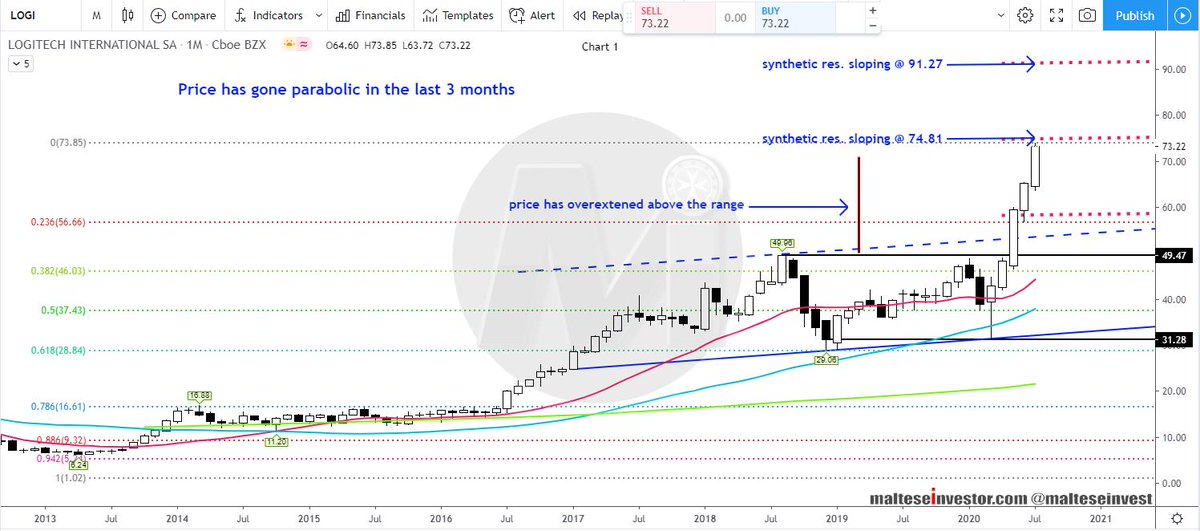
Monthly Chart: Price has gone #parabolic smashing through the 2018 #pivot and sloping #trendline resistance at 49.96-53.20 respectively and overextended way beyond the 2 year range. Synthetic #resistance at 74.81 - a close above .....
LOGI 2/4
Monthly Chart: Price has gone #parabolic smashing through the 2018 #pivot and sloping #trendline resistance at 49.96-53.20 respectively and overextended way beyond the 2 year range. Synthetic #resistance at 74.81 - a close above .....
LOGI 2/4
..... targets 91.27. Immediate #support is seen between 67.66/04, then 58.42 and 53.88 (2018 trendline turned support).
LOGI 3/4
LOGI 3/4
Analysis: #NASDAQ $DKNG
Case 387 #DraftKings Inc.
DISCLAIMER: The analysis is strictly for educational purposes and should not be construed as an invitation to trade.
#DKNG 1/4
Case 387 #DraftKings Inc.
DISCLAIMER: The analysis is strictly for educational purposes and should not be construed as an invitation to trade.
#DKNG 1/4

Chart 1
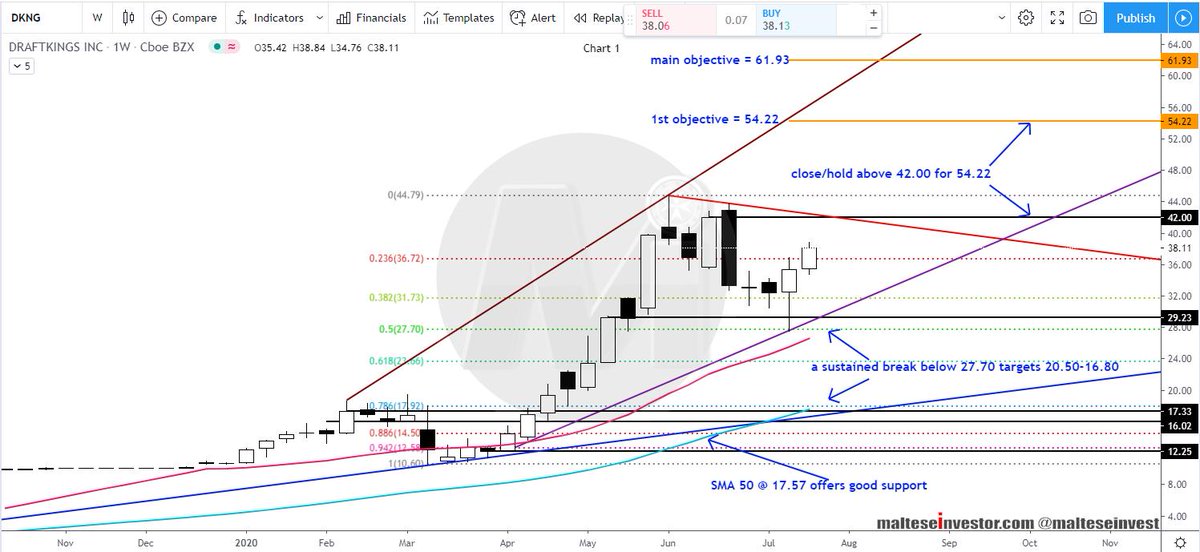
Weekly Chart: The #parabolic move seen in Apr. 2020, as expected, saw a correction down to the #Fib 0.50 (27.70) - a 2 week close below sees price fall down into strong #support 20.50 - 16.80 (Fib. 0.786, #pivot and .....
DKNG 2/4
Weekly Chart: The #parabolic move seen in Apr. 2020, as expected, saw a correction down to the #Fib 0.50 (27.70) - a 2 week close below sees price fall down into strong #support 20.50 - 16.80 (Fib. 0.786, #pivot and .....
DKNG 2/4
Analysis: #NASDAQ $AUPH
Case 377 #Aurinia Pharmaceuticals Inc.
DISCLAIMER: The analysis is strictly for educational purposes and should not be construed as an invitation to trade.
#AUPH 1/4
Case 377 #Aurinia Pharmaceuticals Inc.
DISCLAIMER: The analysis is strictly for educational purposes and should not be construed as an invitation to trade.
#AUPH 1/4

Chart 1
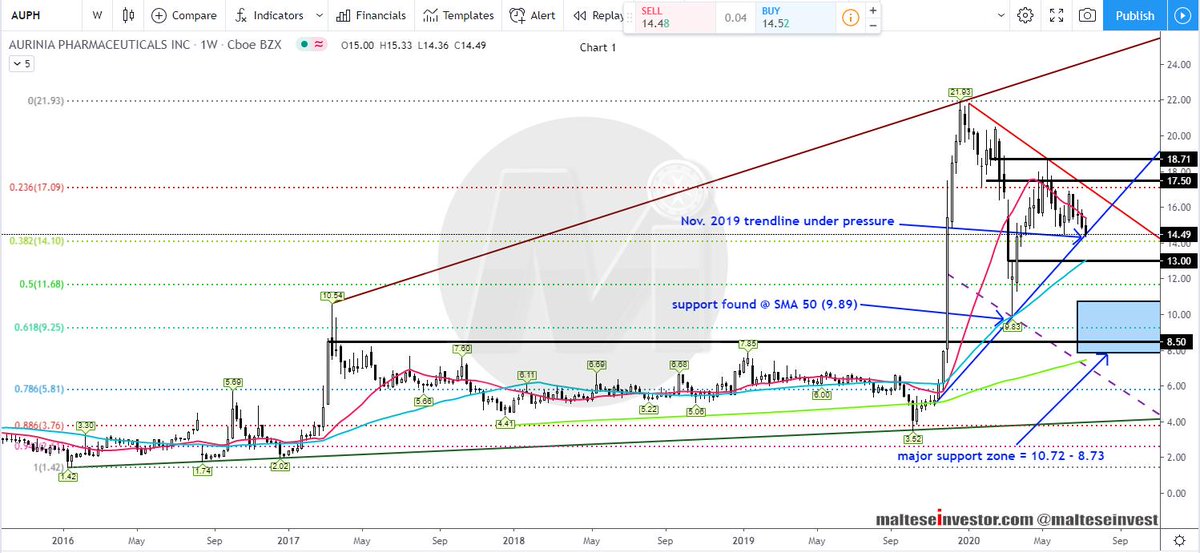
Weekly Chart: As expected the 2019 #parabolic move saw a correction taking price between the #Fib. 0.50 and 0.681, stalling at the #SMA 50 - however, the reaction has been disappointing as it failed to gain a foothold above #pivot .....
AUPH 2/4
Weekly Chart: As expected the 2019 #parabolic move saw a correction taking price between the #Fib. 0.50 and 0.681, stalling at the #SMA 50 - however, the reaction has been disappointing as it failed to gain a foothold above #pivot .....
AUPH 2/4
..... #resistances 17.50 - 18.71. The Nov. 2019 #trendline is under pressure - a close below targets 13.00.
AUPH 3/4
AUPH 3/4
Analysis: #NASDAQ $W
Case 376 #Wayfair Inc.
DISCLAIMER: The analysis is strictly for educational purposes and should not be construed as an invitation to trade.
#W 1/3
Case 376 #Wayfair Inc.
DISCLAIMER: The analysis is strictly for educational purposes and should not be construed as an invitation to trade.
#W 1/3

Chart 1
Weekly Chart: The losses seen in Q1 2020 have been absorbed and price went #parabolic, reclaiming the #SMA 200 and closing strongly above 1 year #trendline resistance. Price has also closed above 2015 trendline #resistance - the immediate target is 250.56 - 251.62.
W 2/3
Weekly Chart: The losses seen in Q1 2020 have been absorbed and price went #parabolic, reclaiming the #SMA 200 and closing strongly above 1 year #trendline resistance. Price has also closed above 2015 trendline #resistance - the immediate target is 250.56 - 251.62.
W 2/3
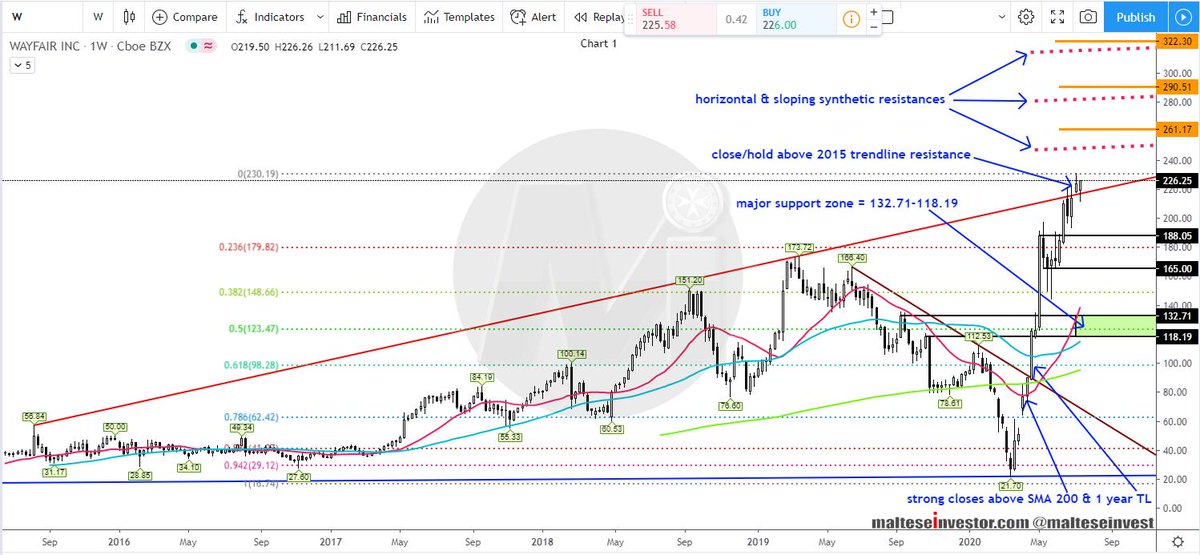
Chart 2
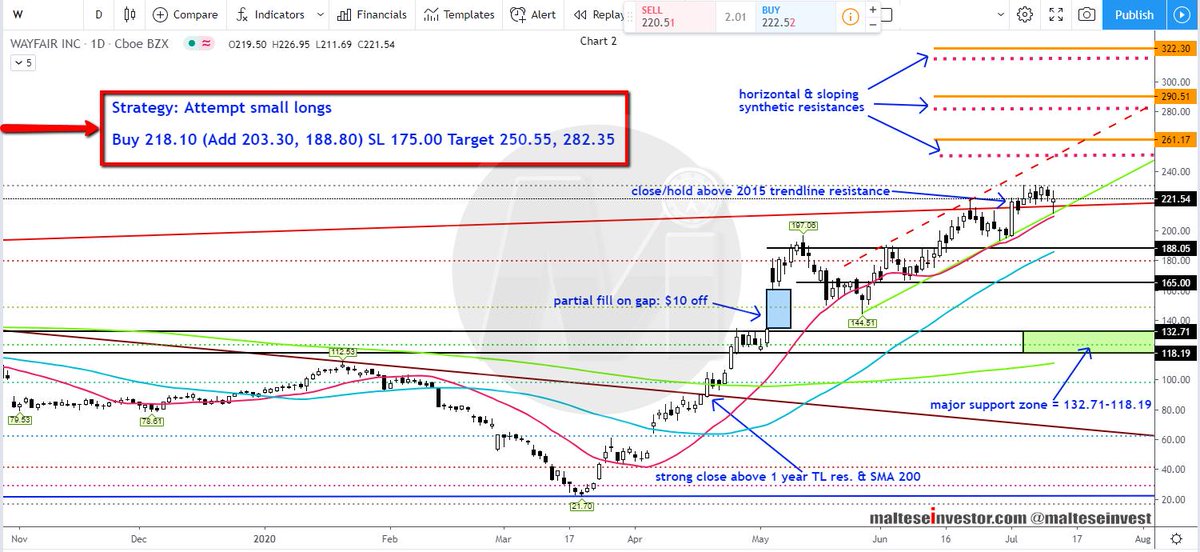
Daily Chart: A gap is still unfilled by $10. A #confluence of support: SMA 20, May 2020 trendline and SMA 50 will soon #support the 188.05 #pivot. Attempting small longs. Conditions are tricky as major support lies far below.
The #Strategy is printed on the image
$W 3/3
Daily Chart: A gap is still unfilled by $10. A #confluence of support: SMA 20, May 2020 trendline and SMA 50 will soon #support the 188.05 #pivot. Attempting small longs. Conditions are tricky as major support lies far below.
The #Strategy is printed on the image
$W 3/3
Analysis: #NASDAQ $WKHS
Case 364 #Workhorse Group Inc. - Revisited
Special Request: @AliTheTrader1
DISCLAIMER: The analysis is strictly for educational purposes and should not be construed as an invitation to trade.
#WKHS 1/4
Case 364 #Workhorse Group Inc. - Revisited
Special Request: @AliTheTrader1
DISCLAIMER: The analysis is strictly for educational purposes and should not be construed as an invitation to trade.
#WKHS 1/4

Chart 1
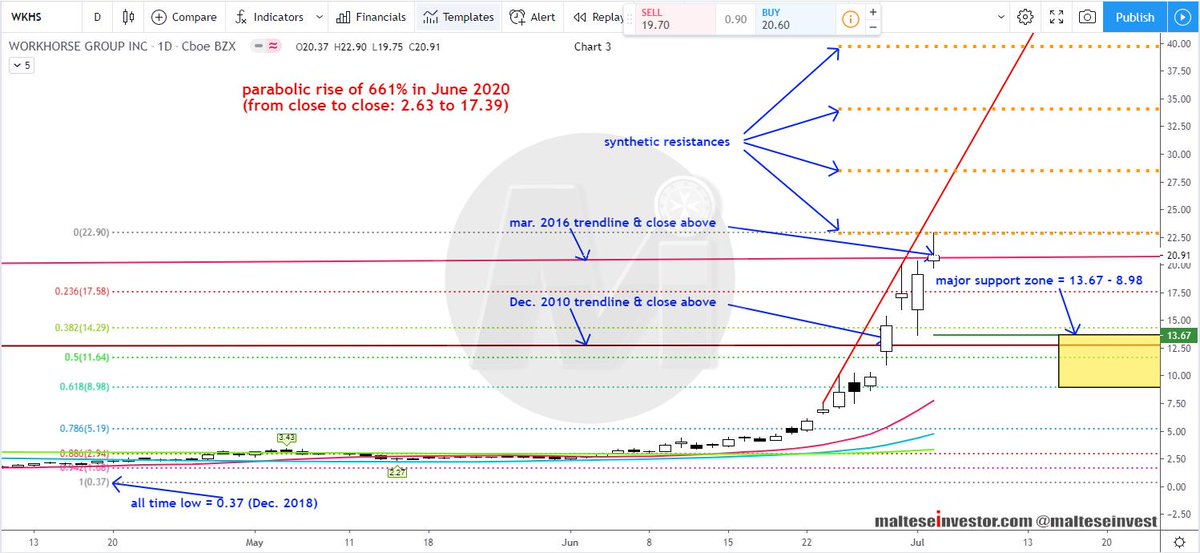
Daily Chart: The June 23rd analysis targets were easily met as price rose over 661% in the month of June (from close to close). #Parabolic moves are violent during a correction and normally target the #Fib. 0.50 and even .....
WKHS 2/4
Daily Chart: The June 23rd analysis targets were easily met as price rose over 661% in the month of June (from close to close). #Parabolic moves are violent during a correction and normally target the #Fib. 0.50 and even .....
WKHS 2/4
..... lower down. Price closed strongly above both the Dec. 2010 and Mar. 2016 #trendline resistances but failed to close above the first synthetic #resistance at 22.88.
WKHS 3/4
WKHS 3/4
Analysis: #NASDAQ $BILI
Case 361 #Bilibili Inc.
DISCLAIMER: The analysis is strictly for educational purposes and should not be construed as an invitation to trade.
#BILI 1/4
Case 361 #Bilibili Inc.
DISCLAIMER: The analysis is strictly for educational purposes and should not be construed as an invitation to trade.
#BILI 1/4

Chart 1
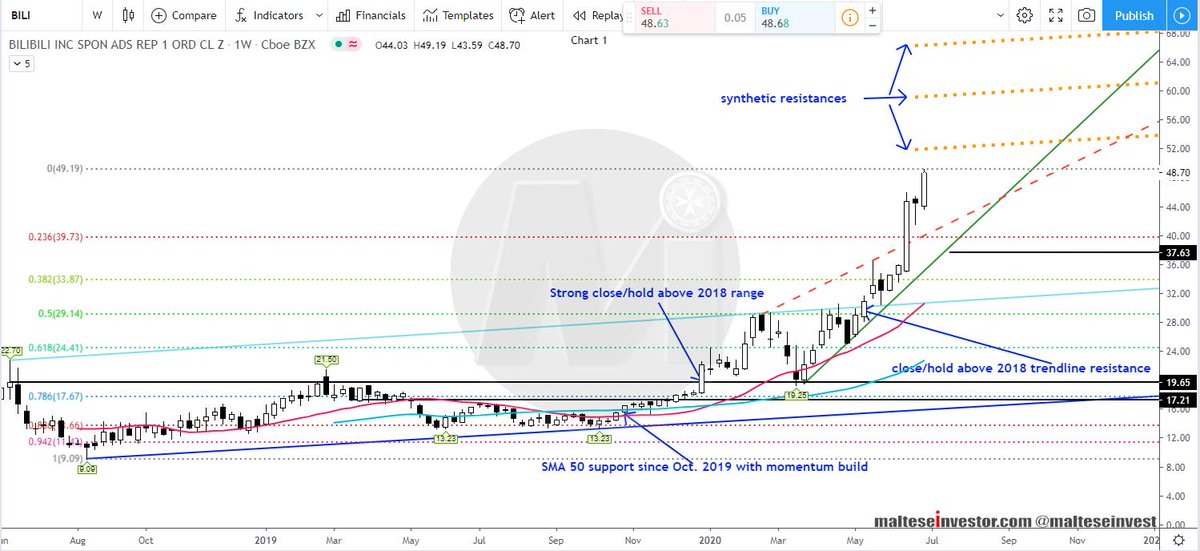
Weekly Chart: The #SMA 50 has acted as support since Oct. 2019, this was followed up by a momentum build and a subsequent break above the 2018 #pivot range, then the #parabolic move, closing/holding well .....
BILI 2/4
Weekly Chart: The #SMA 50 has acted as support since Oct. 2019, this was followed up by a momentum build and a subsequent break above the 2018 #pivot range, then the #parabolic move, closing/holding well .....
BILI 2/4
..... above 2018 #trendline resistance. Price is now targeting synthetic resistances sloping at 52.03, 59.24 and 66.52.
BILI 3/4
BILI 3/4
Analysis: #NYSE $FSLY
Case 351 #Fastly Inc.
DISCLAIMER: The analysis is strictly for educational purposes and should not be construed as an invitation to trade.
#FSLY 1/3
Case 351 #Fastly Inc.
DISCLAIMER: The analysis is strictly for educational purposes and should not be construed as an invitation to trade.
#FSLY 1/3

Chart 1
Daily Chart: A strong #parabolic move has seen price close above one year #trendline resistance and a new all time high of 82.68 has just been recorded - this has stopped short of synthetic #resistance at 83.93, a close above targets 94.34/68.
FSLY 2/3
Daily Chart: A strong #parabolic move has seen price close above one year #trendline resistance and a new all time high of 82.68 has just been recorded - this has stopped short of synthetic #resistance at 83.93, a close above targets 94.34/68.
FSLY 2/3
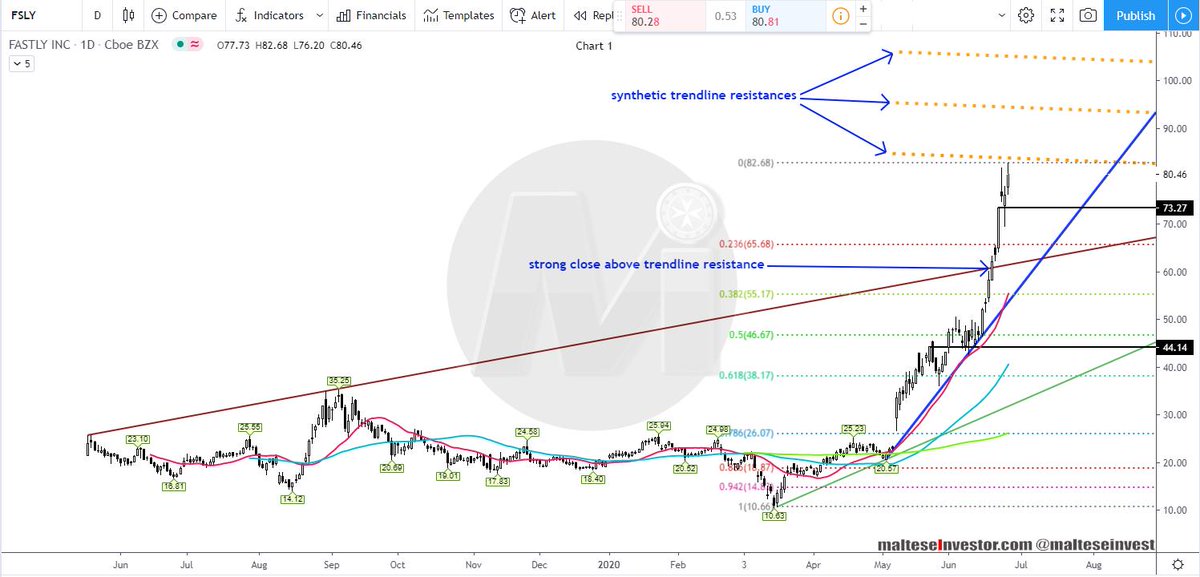
Chart 2
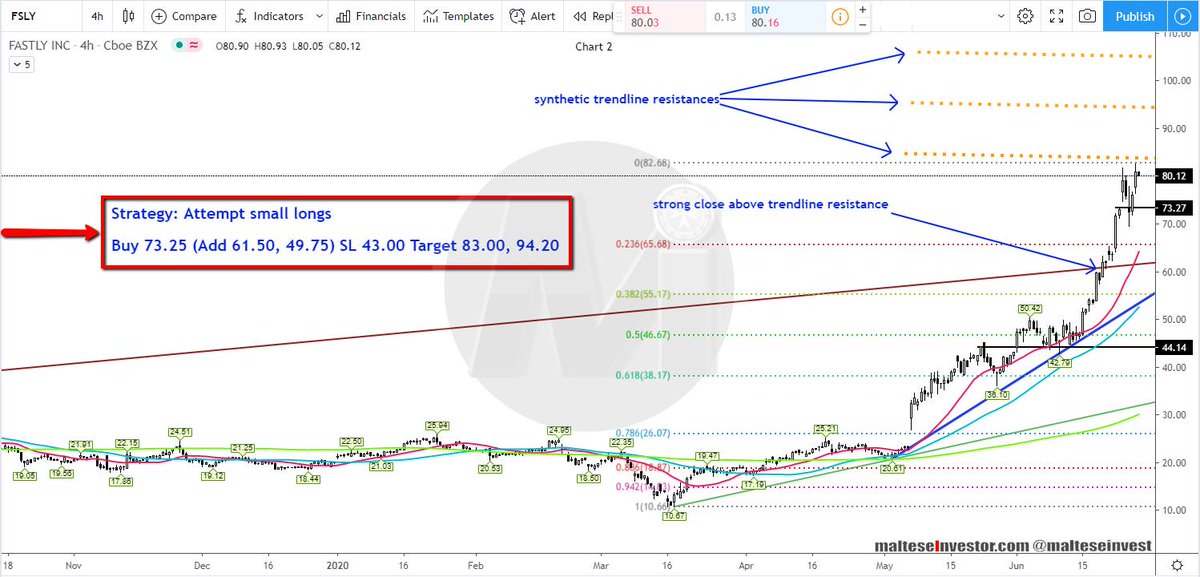
4 Hour Chart: Risk to reward considerations are poor as price has still not corrected lower since the parabolic move - attempt small buys.
The #Strategy is printed on the image.
$FSLY 3/3
4 Hour Chart: Risk to reward considerations are poor as price has still not corrected lower since the parabolic move - attempt small buys.
The #Strategy is printed on the image.
$FSLY 3/3
Analysis: #NASDAQ $WKHS
Case 346 #Workhorse Group Inc.
DISCLAIMER: The analysis is strictly for educational purposes and should not be construed as an invitation to trade.
#WKHS 1/4
Case 346 #Workhorse Group Inc.
DISCLAIMER: The analysis is strictly for educational purposes and should not be construed as an invitation to trade.
#WKHS 1/4

Chart 1
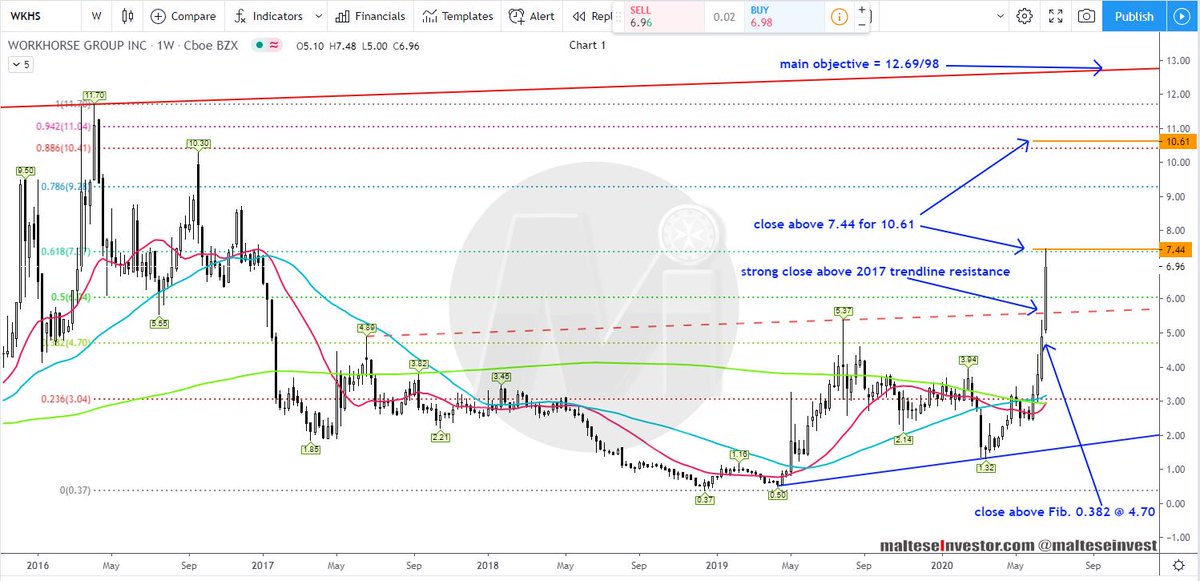
Weekly Chart: Price has recovered strongly off the Dec. 2018 low at 0.37, closing above #Fib. 0.382 at 4.70 and smashed through 2017 #trendline resistance. Currently pausing into .....
WKHS 2/4
Weekly Chart: Price has recovered strongly off the Dec. 2018 low at 0.37, closing above #Fib. 0.382 at 4.70 and smashed through 2017 #trendline resistance. Currently pausing into .....
WKHS 2/4
.....minor #resistance at 7.44 - a close above targets 10.61 and further above the main objective 12.69/98
WKHS 3/4
WKHS 3/4
Analysis: #NASDAQ $PRTS
Case 342 #US_Auto_Parts Network, Inc.
DISCLAIMER: The analysis is strictly for educational purposes and should not be construed as an invitation to trade.
#PRTS 1/4
Case 342 #US_Auto_Parts Network, Inc.
DISCLAIMER: The analysis is strictly for educational purposes and should not be construed as an invitation to trade.
#PRTS 1/4

Chart 1
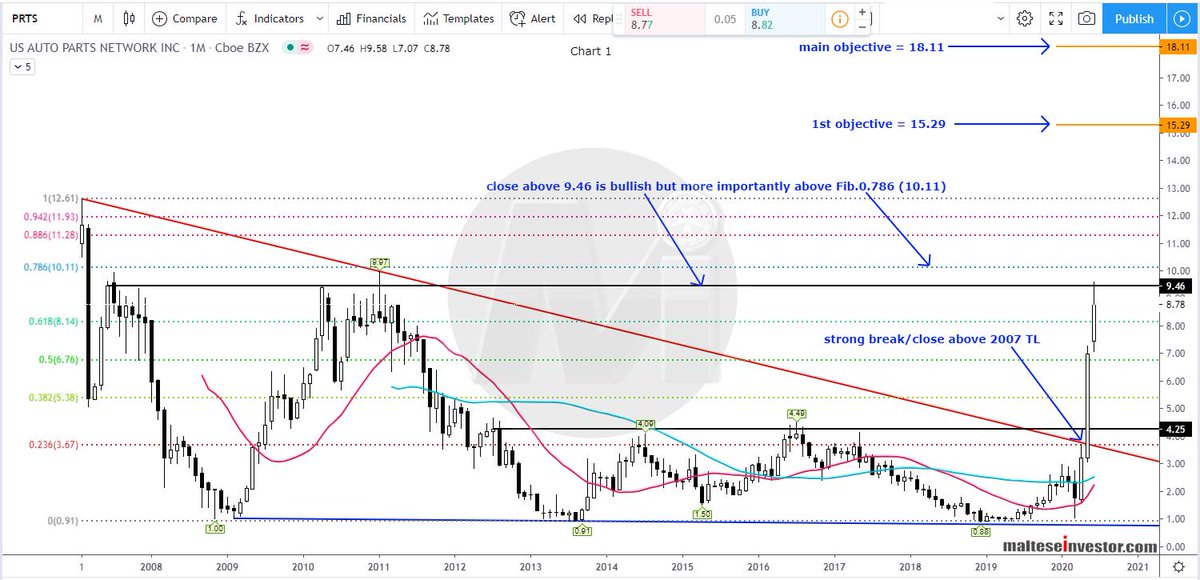
Monthly Chart: The #parabolic move seen in Apr. 2020 was strong enough to finally take out the 2007 #trendline. Price has stalled beneath the 2007 #pivot at 9.46 - a close above is #bullish but to prevent a .....
PRTS 2/4
Monthly Chart: The #parabolic move seen in Apr. 2020 was strong enough to finally take out the 2007 #trendline. Price has stalled beneath the 2007 #pivot at 9.46 - a close above is #bullish but to prevent a .....
PRTS 2/4
..... false break we'd like to see a close above the #Fib. 0.786 at 10.11. The first target is 15.29 and then the main objective 18.11.
PRTS 3/4
PRTS 3/4
Analysis: #NYSE $SPOT
Case 340 #Spotify Technology S.A.
DISCLAIMER: The analysis is strictly for educational purposes and should not be construed as an invitation to trade.
#SPOT 1/3
Case 340 #Spotify Technology S.A.
DISCLAIMER: The analysis is strictly for educational purposes and should not be construed as an invitation to trade.
#SPOT 1/3

Chart 1
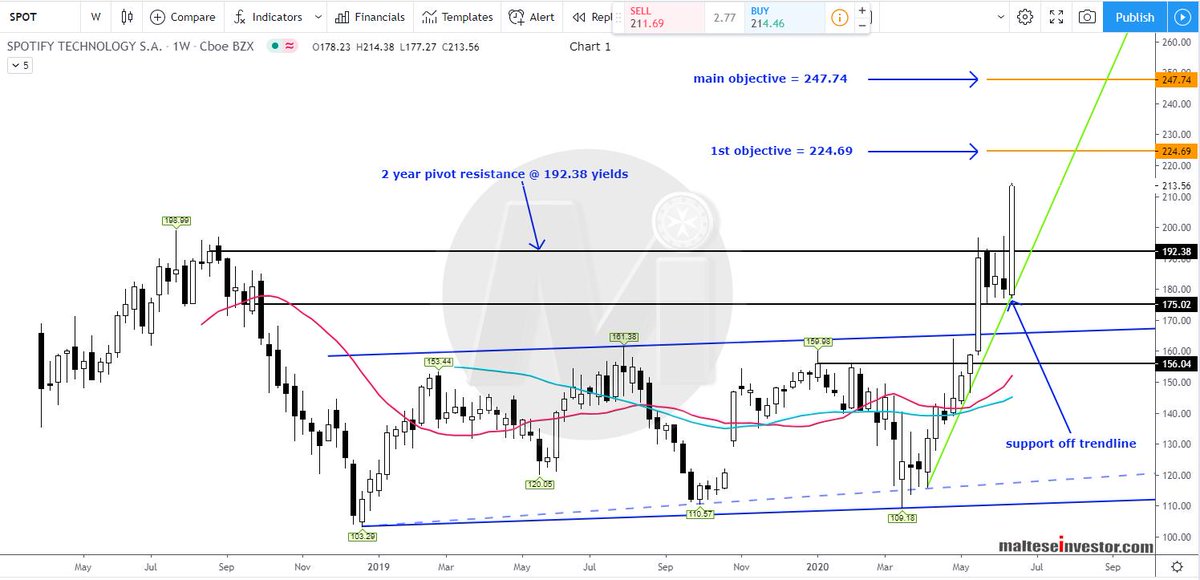
Weekly Chart: A #parabolic move which began in Apr. 2020 has seen price rise strongly, breaking above 2 year pivot #resistance at 192.38 and currently trading to new all time highs. The first objective is 224.69 with a close above targeting 247.74.
SPOT 2/3
Weekly Chart: A #parabolic move which began in Apr. 2020 has seen price rise strongly, breaking above 2 year pivot #resistance at 192.38 and currently trading to new all time highs. The first objective is 224.69 with a close above targeting 247.74.
SPOT 2/3
Analysis: #NYSE $GSX
Case 335 #GSX_Techedu Inc.
DISCLAIMER: The analysis is strictly for educational purposes and should not be construed as an invitation to trade.
#GSX 1/4
Case 335 #GSX_Techedu Inc.
DISCLAIMER: The analysis is strictly for educational purposes and should not be construed as an invitation to trade.
#GSX 1/4

Chart 1
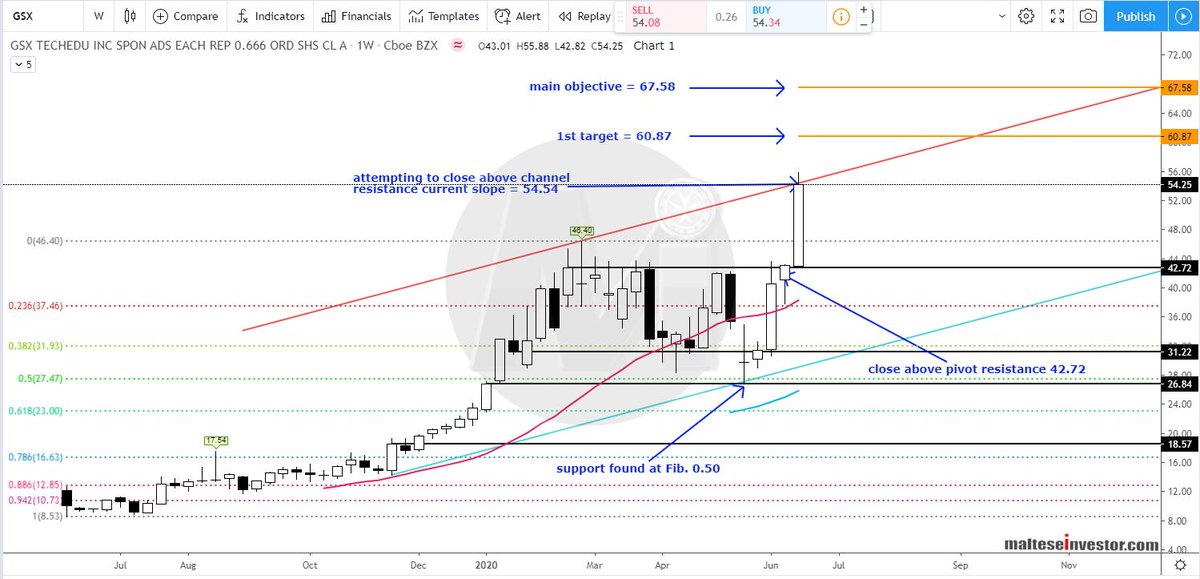
Weekly Chart: The #parabolic move from Nov. 2019 saw price correct lower and found #support at the #Fib. 0.50 at 27.47. A close above #pivot resistance at 42.72 has seen price explode higher, reaching a new all time high and .....
GSX 2/4
Weekly Chart: The #parabolic move from Nov. 2019 saw price correct lower and found #support at the #Fib. 0.50 at 27.47. A close above #pivot resistance at 42.72 has seen price explode higher, reaching a new all time high and .....
GSX 2/4
..... is currently attempting to close above channel #resistance at 54.54. The first objective is 60.87 and a close above targets 67.58.
GSX 3/4
GSX 3/4
Analysis: #NASDAQ $COUP
Case 326 #Coupa Software Incorporated
DISCLAIMER: The analysis is strictly for educational purposes and should not be construed as an invitation to trade.
#COUP 1/4
Case 326 #Coupa Software Incorporated
DISCLAIMER: The analysis is strictly for educational purposes and should not be construed as an invitation to trade.
#COUP 1/4

Chart 1
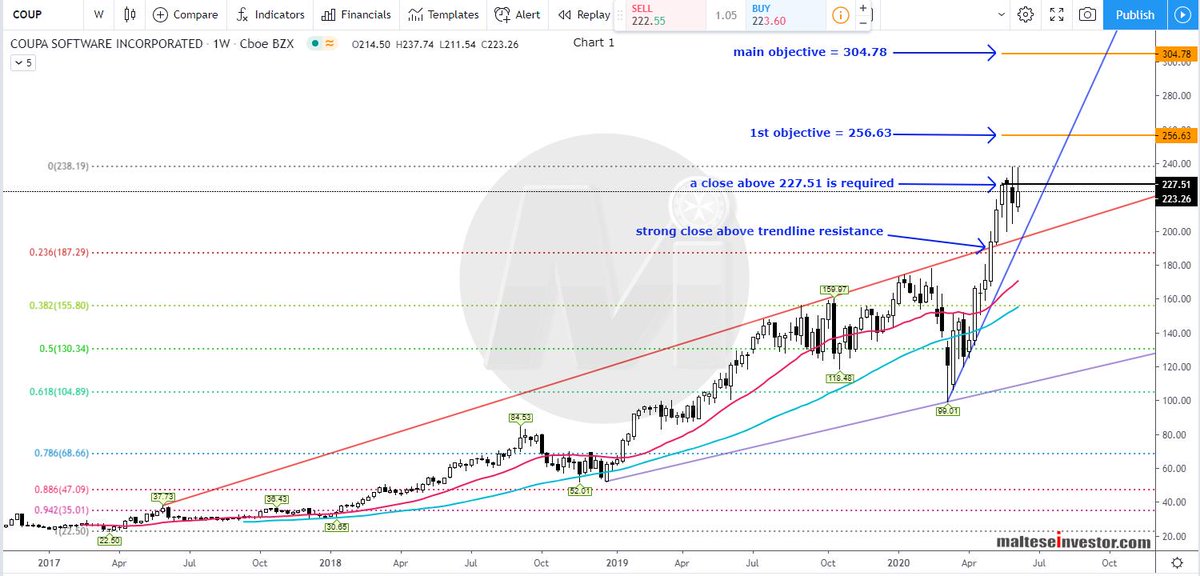
Weekly Chart: Following the declines of Feb - Mar 2020 price has gone #parabolic, smashing through long term #resistance and reaching a new all time high. #Momentum has fallen and .....
COUP 2/4
Weekly Chart: Following the declines of Feb - Mar 2020 price has gone #parabolic, smashing through long term #resistance and reaching a new all time high. #Momentum has fallen and .....
COUP 2/4
..... price needs to close above the 227.51 #pivot to target 256.63 then further up, the main objective, 304.78.
COUP 3/4
COUP 3/4
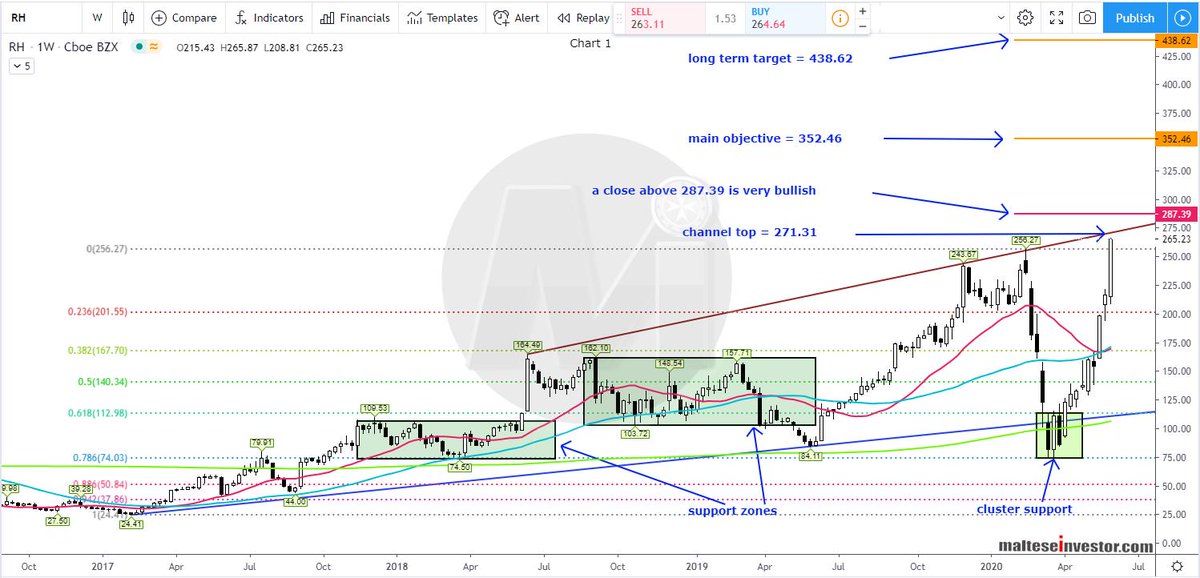
Analysis: #NYSE $RH
Case 320 #RH
DISCLAIMER: The analysis is strictly for educational purposes and should not be construed as an invitation to trade.
#RH 1/4
Case 320 #RH
DISCLAIMER: The analysis is strictly for educational purposes and should not be construed as an invitation to trade.
#RH 1/4

Chart 1
Weekly Chart: The large declines in Feb. - Mar. 2020 found #support at the #Fib. 0.786 and 2nd #support zone. #Momentum is very strong and a new all time high has just been recorded, the immediate .....
RH 2/4
Weekly Chart: The large declines in Feb. - Mar. 2020 found #support at the #Fib. 0.786 and 2nd #support zone. #Momentum is very strong and a new all time high has just been recorded, the immediate .....
RH 2/4
..... target is the channel top 271.31. A close above 287.39 is #bullish and the main objective is 352.46.
RH 3/4
RH 3/4
Analysis: #NYSE $AQN
Case 170 #Algonquin Power & Utilities Corp.
DISCLAIMER: The analysis is strictly for educational purposes and should not be construed as an invitation to trade.
#AQN 1/4
Case 170 #Algonquin Power & Utilities Corp.
DISCLAIMER: The analysis is strictly for educational purposes and should not be construed as an invitation to trade.
#AQN 1/4

Chart 1
Weekly Chart: Trendline #resistance was finally overcome in June 2019 and the stock has gone #parabolic - the main objective is 21.75. Strong #support is seen at 13.30 via the rising #trendline and .....
AQN 2/4
Weekly Chart: Trendline #resistance was finally overcome in June 2019 and the stock has gone #parabolic - the main objective is 21.75. Strong #support is seen at 13.30 via the rising #trendline and .....
AQN 2/4


