Discover and read the best of Twitter Threads about #Tradingview
Most recents (24)
In Technical Analysis, a candlestick pattern is a movement in prices shown graphically on a candlestick chart that some believe can predict a particular market movement.
A thread 🧵 with @Stocktwit_IN & @TradingView_IN
#TechnicalTrades #TradingView
A thread 🧵 with @Stocktwit_IN & @TradingView_IN
#TechnicalTrades #TradingView

History: Some of the earliest technical trading analysis was used to track prices of rice in the 18th century. Much of the credit for candlestick charting goes to Munehisa Homma (1724–1803), a rice merchant from Sakata, Japan who traded in the Ojima Rice market in Osaka
#stocks
#stocks
Formation of the candlestick: Candlesticks are graphical representations of price movements for a given period of time. They are commonly formed by the opening, high, low, and closing prices of a financial instrument.
#priceaction #StocksToTrade
#priceaction #StocksToTrade
Hi Friends,
Sharing some useful #trading threads here
Like & Retweet for Max Reach for learners benefit
it's 100% FREE
by @TechTradesTT & @Stocktwit_IN
1- Technical Analysis, a candlestick pattern -- part 1
#TechnicalTrades #TradingView
Sharing some useful #trading threads here
Like & Retweet for Max Reach for learners benefit
it's 100% FREE
by @TechTradesTT & @Stocktwit_IN
1- Technical Analysis, a candlestick pattern -- part 1
#TechnicalTrades #TradingView
Some Complex candlestick patterns ---- thread Part 2
@KommawarSwapnil @nakulvibhor @Abhishekkar_ @chartmojo @KhapreVishal
@KommawarSwapnil @nakulvibhor @Abhishekkar_ @chartmojo @KhapreVishal
How to create a watch list before market opening- A thread
@tapariachandan @Rishikesh_ADX @kuttrapali26 @ProfitKing7
@tapariachandan @Rishikesh_ADX @kuttrapali26 @ProfitKing7
Candlestick #charts patterns is a movement in prices shown graphically on a candlestick chart that some believe can predict a particular market movement
A thread by Naren Joshi @valuelevels
🧵👇
#like & #Retweet for MAX Reach
A thread by Naren Joshi @valuelevels
🧵👇
#like & #Retweet for MAX Reach

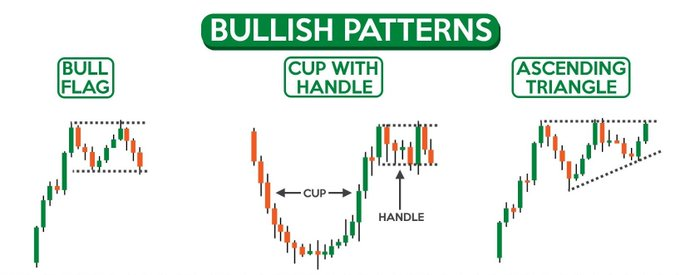
Bullish Patterns
1- BULL FLAG
2- CUP WITH HANDLE
3- ASCENDING TRIANGLE
#stocks #TradingView
#nifty #niftybank #banknifty
1- BULL FLAG
2- CUP WITH HANDLE
3- ASCENDING TRIANGLE
#stocks #TradingView
#nifty #niftybank #banknifty
BEARISH PATTERNS
1- BEAR FLAG
2- INVERTED CUP WITH HANDLE
3- DESCENDING TRIANGLE
#niftyoptions #niftyfuture
#niftytoday
1- BEAR FLAG
2- INVERTED CUP WITH HANDLE
3- DESCENDING TRIANGLE
#niftyoptions #niftyfuture
#niftytoday

Moving average is one the simplest indicator which many traders and investor use for technical analysis.
𝗔 𝗧𝗵𝗿𝗲𝗮𝗱 𝗼𝗻 𝗠𝗼𝘃𝗶𝗻𝗴 𝗔𝘃𝗲𝗿𝗮𝗴𝗲 🧵 by @me__kaushik
Retweet ♻ for maximum reach.
𝗔 𝗧𝗵𝗿𝗲𝗮𝗱 𝗼𝗻 𝗠𝗼𝘃𝗶𝗻𝗴 𝗔𝘃𝗲𝗿𝗮𝗴𝗲 🧵 by @me__kaushik
Retweet ♻ for maximum reach.
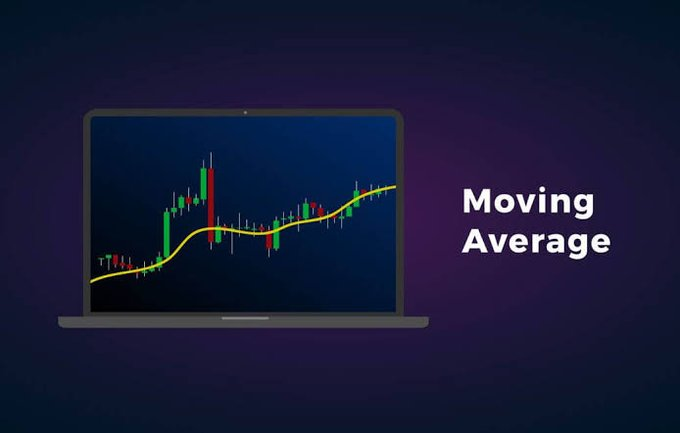
📍What is Moving Average?
A moving average is a technical indicator that investors and traders use to determine the trend direction of a stock or to determine its support and resistance levels.
It is a trend-following or lagging indicator because it is based on past prices.
A moving average is a technical indicator that investors and traders use to determine the trend direction of a stock or to determine its support and resistance levels.
It is a trend-following or lagging indicator because it is based on past prices.
📍Types of Moving Average
👉 Simple Moving Average (SMA): SMA is a technical indicator calculated by adding the most recent data points in a set and dividing the total by the number of time periods.
👉 Simple Moving Average (SMA): SMA is a technical indicator calculated by adding the most recent data points in a set and dividing the total by the number of time periods.
Sometimes studying @I_Am_The_ICT concepts I sit and think this can't be real 🤯
Just backtesting $ES and $DXY between 8.30-11 am NY (mainly 9.30-11 am)
This be real crazy...
Would need hardly any bias by looks of it.
🧵🧵
#tradingstrategy
#TradingView
#trading
Just backtesting $ES and $DXY between 8.30-11 am NY (mainly 9.30-11 am)
This be real crazy...
Would need hardly any bias by looks of it.
🧵🧵
#tradingstrategy
#TradingView
#trading
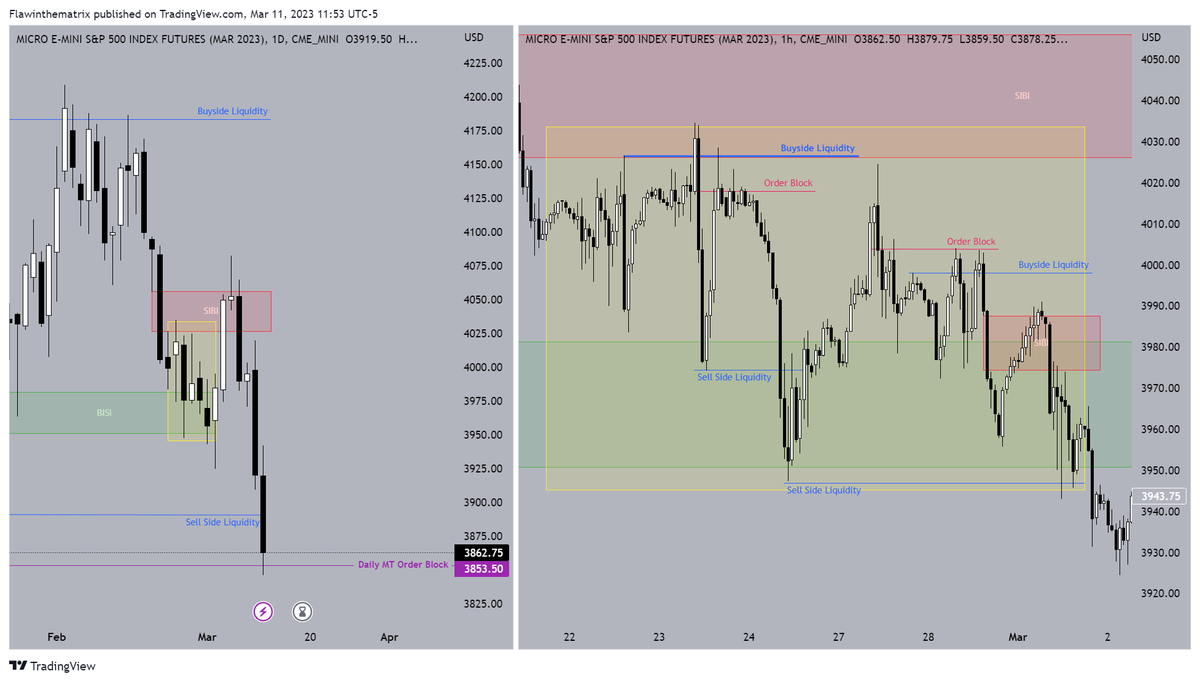
Visual aid watching $MES $ES price print.
Liquidity
Imbalance
Order blocks
MMXM
(like stated in previous post you don't need more "we have jade in our hands")
PO3 example below
Orderflow examples below
$NQ $YM
#TradingView
#tradingstrategy
Liquidity
Imbalance
Order blocks
MMXM
(like stated in previous post you don't need more "we have jade in our hands")
PO3 example below
Orderflow examples below
$NQ $YM
#TradingView
#tradingstrategy
Whether you like it or not, we're in an #economic #reset & nothing can stop it
The #macro chart of the #USA #economy reveals a crucial insight everyone should pay attention to
US #GDP & M2 money supply in #USD tn
Read on...
#tradingview chart👉bit.ly/3IwTBrt
1/🧵
The #macro chart of the #USA #economy reveals a crucial insight everyone should pay attention to
US #GDP & M2 money supply in #USD tn
Read on...
#tradingview chart👉bit.ly/3IwTBrt
1/🧵

Untill 2011, money supply M2 consistently remained below 60% of #GDP
#Growth in M2 kept pace with GDP growth
Enabling low #inflation secular growth #economy
Despite popular #fintwit narrative, even GFC of 2008 did not upset M2 GDP⚖️balance
This is what GFC did...
2/🧵
#Growth in M2 kept pace with GDP growth
Enabling low #inflation secular growth #economy
Despite popular #fintwit narrative, even GFC of 2008 did not upset M2 GDP⚖️balance
This is what GFC did...
2/🧵

In Technical Analysis, a candlestick pattern is a movement in prices shown graphically on a candlestick chart that some believe can predict a particular market movement.
thread 🧵 👇 with @valuelevels
& @TradingView_IN
#TechnicalTrades #TradingView
thread 🧵 👇 with @valuelevels
& @TradingView_IN
#TechnicalTrades #TradingView

History:
Some of the earliest technical trading analysis was used to track prices of rice in the 18th century. Much of the credit for candlestick charting goes to Munehisa Homma (1724–1803), a rice merchant from Sakata, Japan who traded in the Ojima Rice market in Osaka
#stocks
Some of the earliest technical trading analysis was used to track prices of rice in the 18th century. Much of the credit for candlestick charting goes to Munehisa Homma (1724–1803), a rice merchant from Sakata, Japan who traded in the Ojima Rice market in Osaka
#stocks
Formation of the candlestick:
Candlesticks are graphical representations of price movements for a given period of time. They are commonly formed by the opening, high, low, and closing prices of a financial instrument.
#priceaction #StocksToTrade
Candlesticks are graphical representations of price movements for a given period of time. They are commonly formed by the opening, high, low, and closing prices of a financial instrument.
#priceaction #StocksToTrade
1⃣Golden cross yani altın kesişim de olan hisse senetleri nasıl bulunur ?
Kısa vadeli hareketli ortalamanın, uzun vadeli hareketli ortalamayı aşağıdan yukarıya doğru keserek üzerine çıktığı modele "Golden Cross" denir.
Golden cross genelde bir yükselişin başlayacağına işaret eder
Kısa vadeli hareketli ortalamanın, uzun vadeli hareketli ortalamayı aşağıdan yukarıya doğru keserek üzerine çıktığı modele "Golden Cross" denir.
Golden cross genelde bir yükselişin başlayacağına işaret eder
2⃣Golden cross genellikle '' Günlük Periyotta '' 50 Günlük Hareketli Ortalamanın , 200 günlük hareketli ortalamayı yukarı kesmesi ile başlar. Hisse senetlerine tek tek bakmak yerine bu tarama nasıl yapılır şimdi onu anlatacağım.
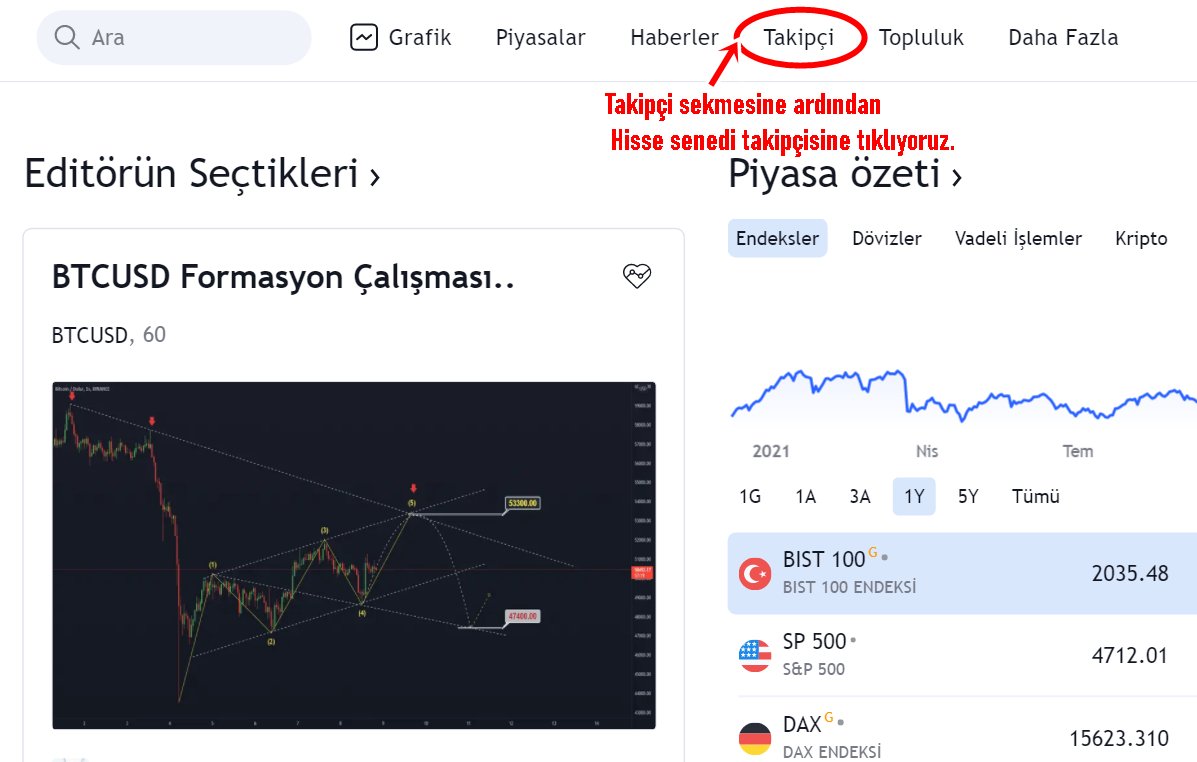
3⃣İlk önce #tradingview uygulamasını açıyoruz. Ordan aşağıdaki görseldeki gibi ''TAKİPÇİ'' sekmesine tıklıyoruz. Ardından açılan sekmede HİSSE SENEDİ TAKİPÇİSİNİ seçiyoruz. 
NDR auto components Ltd - The next OEM beneficiary for the EV revolution ?
A thread
#auto #ndr #investing #relangroup
A thread
#auto #ndr #investing #relangroup

NDR Auto Components Limited(NACL) is a part of the Rohit Relan Group
.
NDR was listed post-demerger of the automobile seating business from Sharda Motor Industries Ltd…
.
NDR was listed post-demerger of the automobile seating business from Sharda Motor Industries Ltd…
NDR operates in the auto components industry and manufactures seat frames and trims for four-wheelers and two-wheeler vehicles and other accessories relating to car seats .
If you had to ask me to draw @I_Am_The_ICT YouTube 22 mentorship in the simplest form here it would be.
Note the white box in the image are a balance BISI/SIBI creating the ITL/ITH
Red box is FVG entry after MSS.
#TradingView
#TradingStrategies
#Trader
Note the white box in the image are a balance BISI/SIBI creating the ITL/ITH
Red box is FVG entry after MSS.
#TradingView
#TradingStrategies
#Trader

@WarrenHunter16 keep it this simple. With 4H/1H/15M POI and general dialy direction
🔁 Antero Resource ($AR) 💮 Gas Natural para exportación LNG.
es.tradingview.com/chart/AR/cNbgu…
Nueva idea en largo #trading - Esquemáticamente en #TradingView, gracias si podéis darle un "Boost".
es.tradingview.com/chart/AR/cNbgu…
Nueva idea en largo #trading - Esquemáticamente en #TradingView, gracias si podéis darle un "Boost".
🔸Inventario de #GasNatural en terminales de #GNL en la #UE a partir del 28 de enero. Alguien está empezando a posicionarse en $UNG... 

🔸Energy investors flee the market, dumping their natural gas-weighted stocks as unseasonably warm weather pushes $UNG prices lower, I am taking the opportunity to increase my natural gas holdings. European prices remain at high levels, and #LNG exports remain highly profitable. 

Our ace chartist @bbrijesh posts the Index chart in his video. Let us understand on how he creates this index in Tradingview to analyze the charts. #Index #TechnicalAnalysis #charting
#Learning
Best #intraday setup
If you are struggling to take entry at the right spot, this will be very helpful for you
Read all below messages.
🧵 1/3


Best #intraday setup
If you are struggling to take entry at the right spot, this will be very helpful for you
Read all below messages.
🧵 1/3


Use below mentioned parameters at your charting platform (tradingview).
1. Previous day's close
2.Today's open
3.Previous day, Week & Month High
4.Previous day, Week & Month Low
5.Camerilla pivot level (Only R3,S3)
6.EMA : 9&32
7.RSI
8.Volume
🧵 2/3
1. Previous day's close
2.Today's open
3.Previous day, Week & Month High
4.Previous day, Week & Month Low
5.Camerilla pivot level (Only R3,S3)
6.EMA : 9&32
7.RSI
8.Volume
🧵 2/3
In Technical Analysis, a candlestick pattern is a movement in prices shown graphically on a candlestick chart that some believe can predict a particular market movement.
thread 🧵 👇 with @valuelevels
& @TradingView_IN
#TechnicalTrades #TradingView
thread 🧵 👇 with @valuelevels
& @TradingView_IN
#TechnicalTrades #TradingView

@valuelevels @TradingView_IN History:
Some of the earliest technical trading analysis was used to track prices of rice in the 18th century. Much of the credit for candlestick charting goes to Munehisa Homma (1724–1803), a rice merchant from Sakata, Japan who traded in the Ojima Rice market in Osaka
#stocks
Some of the earliest technical trading analysis was used to track prices of rice in the 18th century. Much of the credit for candlestick charting goes to Munehisa Homma (1724–1803), a rice merchant from Sakata, Japan who traded in the Ojima Rice market in Osaka
#stocks
@valuelevels @TradingView_IN Formation of the candlestick:
Candlesticks are graphical representations of price movements for a given period of time. They are commonly formed by the opening, high, low, and closing prices of a financial instrument.
#priceaction #StocksToTrade
Candlesticks are graphical representations of price movements for a given period of time. They are commonly formed by the opening, high, low, and closing prices of a financial instrument.
#priceaction #StocksToTrade
How to create your own "Trading systems"
🧵
🐦Retweet 🇮🇳 to share the knowledge 🙏
@bhatiamanu @AdityaTodmal
#StockMarket #Trading
🧵
🐦Retweet 🇮🇳 to share the knowledge 🙏
@bhatiamanu @AdityaTodmal
#StockMarket #Trading
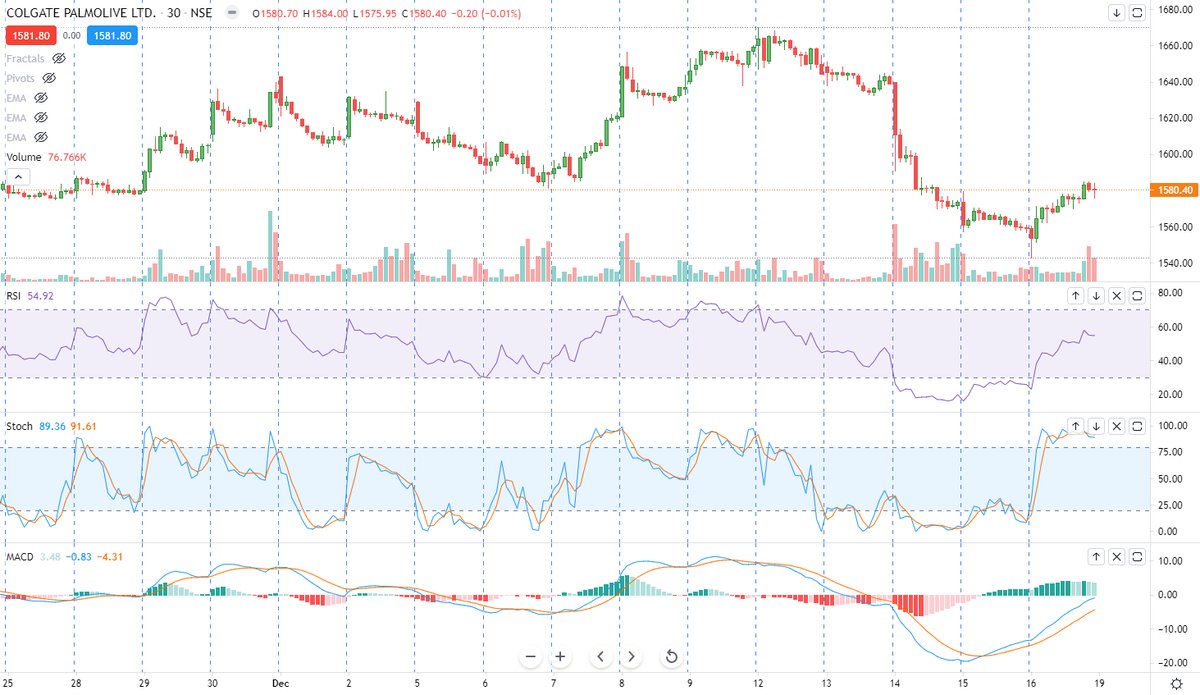
What do you think is wrong with this system
🟢The 1st thought would be too many indicators, you are right to some degree.
🟢But the major issue is all the indicators are momentum indicator
🟢They all represent the same parameter
hence not directly adding value.
🟢The 1st thought would be too many indicators, you are right to some degree.
🟢But the major issue is all the indicators are momentum indicator
🟢They all represent the same parameter
hence not directly adding value.
Mistakes to avoid while creating your system
1⃣ Don't use indicators that represent the same parameters
2⃣ Try to keep the system simple
3⃣ Create a system that can define entry, stop loss, and exit as clearly as possible. or at least help you to gauge the market correctly
1⃣ Don't use indicators that represent the same parameters
2⃣ Try to keep the system simple
3⃣ Create a system that can define entry, stop loss, and exit as clearly as possible. or at least help you to gauge the market correctly
The following Things are used in this strategy
1⃣ Triple RSI indicator - to filter
2⃣ 50 EMA - to identify the trend and dynamic support/resistance
3⃣ ADX - to identify the strength behind the trend
4⃣ Time frame to be used is 15 min
1⃣ Triple RSI indicator - to filter
2⃣ 50 EMA - to identify the trend and dynamic support/resistance
3⃣ ADX - to identify the strength behind the trend
4⃣ Time frame to be used is 15 min
How to use triple RSI in strategy
1⃣ On #TradingView apply triple RSI indicator
2⃣ +ve signal if redline crossing up
3⃣ Bullish trades only when all the lines above 50
4⃣ Trade to be initiated by using support
1⃣ On #TradingView apply triple RSI indicator
2⃣ +ve signal if redline crossing up
3⃣ Bullish trades only when all the lines above 50
4⃣ Trade to be initiated by using support

1) Merhaba, uzun bir akışa hoş geldiniz.😱💁🏻♂️
2023 portföy planlarını yapmaya başlayalı 3 hafta kadar oldu ve bu ay, gerek Twitter gerekse de blog yazılarımda hazırlayacağım içeriği paylaşmıştım.
Bugün, ikinci maddede yer alan #abonelikler konusu var.
2023 portföy planlarını yapmaya başlayalı 3 hafta kadar oldu ve bu ay, gerek Twitter gerekse de blog yazılarımda hazırlayacağım içeriği paylaşmıştım.
Bugün, ikinci maddede yer alan #abonelikler konusu var.
2) Öncelikle abonelikler konusunda yaptığım seçimlerin tamamen kişisel, bu paylaşımın da bilgi aktarımı amaçlı olduğunu belirtmek isterim.
Herhangi bir kurum, kuruluş, kişi ya da yayın ile reklam, iş birliği vb. anlaşmam yoktur. Bu yılki başlıca aboneliklerim şöyledir:
Herhangi bir kurum, kuruluş, kişi ya da yayın ile reklam, iş birliği vb. anlaşmam yoktur. Bu yılki başlıca aboneliklerim şöyledir:

3) Ekonomi ve finans dünyasında çok sayıda program, içerik üreticisi ve veri sunucusu var. Haber akışından finansal tablolara, anlık fiyat verilerinden detaylı analiz platformlarına, her gün de gelişen önemli bir lükse sahibiz. Ancak seçerken iki kere düşünmek gerekiyor.
(1/8) Profit Sharing 2.0 evriminin son aşamasındaki 🎱. güncelleme ile karşınızdayız, bu hafta daha da heyecanlıyız!📢
Kapalı beta sürecinde kullanıcılarımız yeni arayüzü bir haftadan uzun süredir test ediyor ve her geçen gün daha fazla kullanıcıya erişim sağlıyoruz! ⚙️📅 💪
Kapalı beta sürecinde kullanıcılarımız yeni arayüzü bir haftadan uzun süredir test ediyor ve her geçen gün daha fazla kullanıcıya erişim sağlıyoruz! ⚙️📅 💪
(2/8) İyi haberler için sesimizi yükseltelim:) Güncellemeleri duyurduğumuzdan bu yana her şey planlandığı gibi ilerliyor ve geri bildirimler pozitif! Ayrıca daha önce de belirttiğimiz gibi arka uçtaki süreç tamamlandığı için görsel çalışmalarda da eksiksiz durumdayız🤫✨
(3/8) Bu hafta dört konuya odaklandık. i) Hizmet profillerindeki ilk metrikler... #Yatırımcılar artık yola çıkmadan önce stratejilerin gelişimini görebilecekler. Yakın gelecekte birçok yeni metrik eklemeyi planlıyoruz ⌚️ 🚀
(1/8) This is the eighth update on this final stage of the evolution of Profit Sharing 2.0. 📢 📢
This week we are very excited. Users have been testing the interface for more than a week, and we are giving access to more users every day! ⚙️📅 💪
This week we are very excited. Users have been testing the interface for more than a week, and we are giving access to more users every day! ⚙️📅 💪

(2/8) Hear the good news out loud: So far, #everything is working as planned and the feedback have been very positive! As we mentioned before, another positive thing is that all the visual work is complete since everything is finished from the #backend 🤫✨
(3/8) This week, we concentrated on four things. i) moving forward with the first #metrics for the service profiles. #Investors are now able to see the #evolution of the strategies before they start investing. We plan to add a lot of metrics going ahead ⌚ 🚀
In Technical Analysis, a candlestick pattern is a movement in prices shown graphically on a candlestick chart that some believe can predict a particular market movement.
thread 🧵 👇 with
@valuelevels
&
@TradingView_IN
#TechnicalTrades #TradingView
thread 🧵 👇 with
@valuelevels
&
@TradingView_IN
#TechnicalTrades #TradingView

History:
Some of the earliest technical trading analysis was used to track prices of rice in the 18th century. Much of the credit for candlestick charting goes to Munehisa Homma (1724–1803), a rice merchant from Sakata, Japan who traded in the Ojima Rice market in Osaka
Some of the earliest technical trading analysis was used to track prices of rice in the 18th century. Much of the credit for candlestick charting goes to Munehisa Homma (1724–1803), a rice merchant from Sakata, Japan who traded in the Ojima Rice market in Osaka
Formation of the candlestick:
Candlesticks are graphical representations of price movements for a given period of time. They are commonly formed by the opening, high, low, and closing prices of a financial instrument.
Candlesticks are graphical representations of price movements for a given period of time. They are commonly formed by the opening, high, low, and closing prices of a financial instrument.
#EngineersIndia - Safe bet for good gains in medium term.
CMP – 73.20 (7/11/22)
Strong Momentum in PSUs, Highly Undervalued, Breakout on Cards
🌟#TechnicalAnalysis inputs by @rohanshah619 🌟
(Must read🧵for Investors & Traders!)
@KommawarSwapnil Views Invited
#TechnoFunda
CMP – 73.20 (7/11/22)
Strong Momentum in PSUs, Highly Undervalued, Breakout on Cards
🌟#TechnicalAnalysis inputs by @rohanshah619 🌟
(Must read🧵for Investors & Traders!)
@KommawarSwapnil Views Invited
#TechnoFunda

1⃣
#EngineersIndia (EIL) is a public sector undertaking which is a leading global engineering consultancy & EPC company.
Company provides engineering consultancy & EPC services principally focused on the oil & gas & petrochemical industries.
#StockMarket #Trading #Investing
#EngineersIndia (EIL) is a public sector undertaking which is a leading global engineering consultancy & EPC company.
Company provides engineering consultancy & EPC services principally focused on the oil & gas & petrochemical industries.
#StockMarket #Trading #Investing

2⃣
#EIL has diversified into infrastructure, water and waste management, solar & nuclear power & fertilizers sectors.
Company has also initiated business development activities in sectors like Bio Fuels, SMART Cities, LNG Terminals, Ports & Harbours, Defence.
#StockMarket
#EIL has diversified into infrastructure, water and waste management, solar & nuclear power & fertilizers sectors.
Company has also initiated business development activities in sectors like Bio Fuels, SMART Cities, LNG Terminals, Ports & Harbours, Defence.
#StockMarket
Master Class on ⭕️How to use CPR Indicator⭕️
🧵
You will learn the following application of CPR
- Use to plot Support/Resistance
- Identify Trending, volatile and sideways market
- Correctly identify the market trend
🔖bookmark to save
@kuttrapali26 @KommawarSwapnil @bhatiamanu
🧵
You will learn the following application of CPR
- Use to plot Support/Resistance
- Identify Trending, volatile and sideways market
- Correctly identify the market trend
🔖bookmark to save
@kuttrapali26 @KommawarSwapnil @bhatiamanu
Building blocks of Central Pivot Range (CPR)
🟢How to apply CPR
1⃣ Open #TradingView website
2⃣ apply CPR with pivot levels - CPR by KGS
3⃣ Keep on Daily pivot, Daily BC and Daily TC checked
🟢How to apply CPR
1⃣ Open #TradingView website
2⃣ apply CPR with pivot levels - CPR by KGS
3⃣ Keep on Daily pivot, Daily BC and Daily TC checked


