Discover and read the best of Twitter Threads about #Tidyverse
Most recents (24)
BREAKING NEWS: #ChatGPT Breaks #Python VS #R Barriers For #DataScience Teams Everywhere...
And Data Scientists everywhere are in shock.
Here's the LIVE story as it's unfolding.🧵
#rstats #pydata
And Data Scientists everywhere are in shock.
Here's the LIVE story as it's unfolding.🧵
#rstats #pydata
It's NOT #R VS #Python ANYMORE!
Let me explain with an example that was MIND BLOWING to me.
Here's the background:
Let me explain with an example that was MIND BLOWING to me.
Here's the background:
I'm an R guy.
I use R for research.
It's quick to make analysis.
And now I'm super good with it.
I use R for research.
It's quick to make analysis.
And now I'm super good with it.
As the #rstats course material is not public (yet?) or available as online training (yet?), I thought I am sharing some slides from the deck.
The course covers all steps of the #DataScience workflow as featured in @hadleywickham's fantastic #R4DS 📕 r4ds.had.co.nz/index.html


The course covers all steps of the #DataScience workflow as featured in @hadleywickham's fantastic #R4DS 📕 r4ds.had.co.nz/index.html


1/ Some big changes are coming to the #tidyverse in the coming months, so I thought I'd break them down here for my #Rstats friends:
2/ Two cool functions are coming to stringr - str_like() function to use SQL wildcard characters, and str_sub_all() function to return multiple substrings
3/ dplyr is getting a case_match() function that matches on values rather than logical expressions, and group_by() is getting a faster algorithm
Embarrassed by your #R code?
Here are 4 mistakes beginner R coders make AND how to avoid them.
#rstats #datascience
Here are 4 mistakes beginner R coders make AND how to avoid them.
#rstats #datascience

The reality is you aren't going to become a master R programmer over night.
But I see beginners making the same mistakes time and time again.
And they are easy to correct.
Here are the 4 most common mistakes and how to easily correct them.
But I see beginners making the same mistakes time and time again.
And they are easy to correct.
Here are the 4 most common mistakes and how to easily correct them.
1. Not using comments
This is a huge no-no.
Why?
Because comments help others understand your code INCLUDING future you.
This is a huge no-no.
Why?
Because comments help others understand your code INCLUDING future you.
Do you want to learn #RStats, but aren't quite sure where to start?
Myself and some great colleagues from @_bios2 wrote down our best tips for learning R on your own, out today in @PLOSCompBiol 🔓
✨Ten Simple Rules for Teaching Yourself R✨
journals.plos.org/ploscompbiol/a…
🧵:
Myself and some great colleagues from @_bios2 wrote down our best tips for learning R on your own, out today in @PLOSCompBiol 🔓
✨Ten Simple Rules for Teaching Yourself R✨
journals.plos.org/ploscompbiol/a…
🧵:
RULE 1: Prepare for a steep learning curve 📈
#RStats is a language, and as such, won't be picked up in a day. When learning R, remember that progress will be slow and you may have some growing pains. As you get more practice, you'll become better at picking up new techniques.
#RStats is a language, and as such, won't be picked up in a day. When learning R, remember that progress will be slow and you may have some growing pains. As you get more practice, you'll become better at picking up new techniques.

RULE 2: Take the time to read a book 📚
No matter how general or specific an R skill you want to
learn, there is probably a great book on that skill!
One great place to look is the "Books" section on the
@rstudio website:
rstudio.com/resources/book…, but plenty more exist, too!
No matter how general or specific an R skill you want to
learn, there is probably a great book on that skill!
One great place to look is the "Books" section on the
@rstudio website:
rstudio.com/resources/book…, but plenty more exist, too!
It was 2014, and I was having a really tough time learning data science.
I was working on a project for work. Just sitting there staring at my computer...
Hoping the code would write itself.
I was working on a project for work. Just sitting there staring at my computer...
Hoping the code would write itself.
I took a break to check my email.
Hadley Wickham, the biggest name in data science had introduced this new R package called "dplyr".
What's this? I took a look...
Hadley Wickham, the biggest name in data science had introduced this new R package called "dplyr".
What's this? I took a look...
People are shocked when they learn that I picked #R over Python. It’s a true story.
I began learning data science with Python. This decision actually cost me 2-months and caused me to quit data science for a little bit.
Why? (a 🧵)
#rstats
I began learning data science with Python. This decision actually cost me 2-months and caused me to quit data science for a little bit.
Why? (a 🧵)
#rstats

2/n Python was too much like coding. And I came from a business background. My main tool was Excel. Python was unnatural.
A friend of mine recommended me to try #R.
I was instantly surprised at how much more intuitive it was for me given my Excel background. Here's what R had:
A friend of mine recommended me to try #R.
I was instantly surprised at how much more intuitive it was for me given my Excel background. Here's what R had:
Thread 🧵
Each #dataviz you create needs to tell a story. It doesn't help if we just group a bunch of graphs together on different metrics.
So here are 5 pointers that might help create a story out of your #Datavisualization. Follow along :)
#RStats #Tidyverse #DataScience
Each #dataviz you create needs to tell a story. It doesn't help if we just group a bunch of graphs together on different metrics.
So here are 5 pointers that might help create a story out of your #Datavisualization. Follow along :)
#RStats #Tidyverse #DataScience
1. Understand what question you're trying to answer - the one key question that ties together all the charts in your #dataviz, and align all the metrics accordingly.
Eg: How #Covid brought down the economy in 2020 - Put together charts on GDP, inflation, employment
#RStats
Eg: How #Covid brought down the economy in 2020 - Put together charts on GDP, inflation, employment
#RStats
2. Set the context for the audience right at the beginning of your visualization. This will let them know what they can expect from your visual story, and give them an idea of what conclusions you're trying to draw.
#Rstats #datascience #tidyverse
#Rstats #datascience #tidyverse
Thread 🧵-
Here's how you can produce a clean chart that your audience can easily read and understand, without much ado.
Follow along 🤗
#RStats #DataScience #dataviz #DataAnalytics #DataFam
Here's how you can produce a clean chart that your audience can easily read and understand, without much ado.
Follow along 🤗
#RStats #DataScience #dataviz #DataAnalytics #DataFam
1. Remove gridlines and axis lines from your chart, unless it's difficult to track the points you've plotted without them.
#RStats #tidyverse #datafam #dataviz #DataScience
#RStats #tidyverse #datafam #dataviz #DataScience
2. Add trend lines/reference lines to guide the audience on what the numbers were expected to look like vis-a-vis what they actually look like.
Ensure the color scheme of the trend lines doesn't overshadow the plot. Keep them subtle, probably in grey
#RStats #dataviz #tidyverse
Ensure the color scheme of the trend lines doesn't overshadow the plot. Keep them subtle, probably in grey
#RStats #dataviz #tidyverse
Thread 🧵-
Creating a good #dataviz with the right colours might seem like a herculean task, but it's not.
So, here are six pointers that might help ease your process. Follow along 🤗
#datafam #DataAnalytics #RStats #DataScience
Creating a good #dataviz with the right colours might seem like a herculean task, but it's not.
So, here are six pointers that might help ease your process. Follow along 🤗
#datafam #DataAnalytics #RStats #DataScience
1. Use as few colours as possible to convey your idea - try & look for means to group your variables in such a way that fewer colours can be used to convey your point better.
Eg: Top N products in one colour & the others in another, instead of one colour for each product
Eg: Top N products in one colour & the others in another, instead of one colour for each product
📊🧵 Collection of tweets featuring open-access materials that I have shared over the last years:
Talks, seminars, blog posts, hands-on notebooks, codes, and more!
#rstats #ggplot2 #tidyverse #dataviz 🧙♂️


Talks, seminars, blog posts, hands-on notebooks, codes, and more!
#rstats #ggplot2 #tidyverse #dataviz 🧙♂️


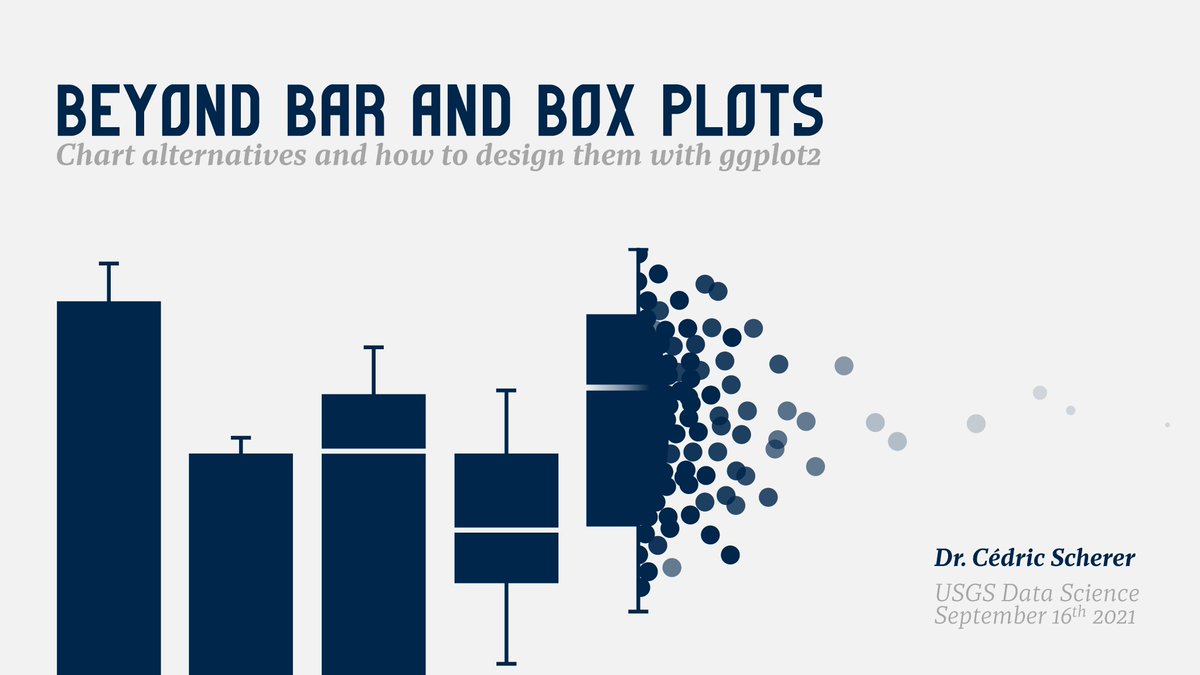
"Evolution of a #ggplot2" — blog post
I am *overjoyed* to announce that our newest @OpenIntroOrg book "Introduction to Modern Statistics" (co-authored with the fantastic @jo_hardin47) is out!
🔗 openintro.org/book/ims/online
Read the 🧵 for more!
1/n
#statsed #datascied #rstats #openeducation #OERR
🔗 openintro.org/book/ims/online
Read the 🧵 for more!
1/n
#statsed #datascied #rstats #openeducation #OERR

The book is also available in PDF (for free) and in paperback (for $20). You can find out more about these formats and the supplementary materials that come with the book at openintro.org/book/ims.
2/n
2/n
Some highlights of the book that are near and dear to our hearts:
💻 Focus on computational methods for statistical inference
🔗 Clear linking of computational and mathematical models
📈 Early introduction to multivariable modeling
✅ Emphasis on multivariable thinking
...
3/n
💻 Focus on computational methods for statistical inference
🔗 Clear linking of computational and mathematical models
📈 Early introduction to multivariable modeling
✅ Emphasis on multivariable thinking
...
3/n
Daily Bookmarks to GAVNet 04/16/2021 greeneracresvaluenetwork.wordpress.com/2021/04/16/dai…
Statistical rethinking with brms, ggplot2, and the tidyverse: Second edition
bookdown.org/content/4857/
#BayesianRegressionModels #statistics #tidyverse #OrdinalModelPlots
bookdown.org/content/4857/
#BayesianRegressionModels #statistics #tidyverse #OrdinalModelPlots
Why a Chinese invasion of Taiwan would be a catastrophe for China and the world
doxa.substack.com/p/why-a-chines…
#china #taiwan #MilitaryConflict #consequences
doxa.substack.com/p/why-a-chines…
#china #taiwan #MilitaryConflict #consequences
New preprint from me @PawarLab and @hjosullivan123 on fitting thermal performance curves in R. We created an R package to fit 24 different TPC model formulations. This is the R package I wished existed at the start of my PhD... bit.ly/2WoDc0x 


Models are fit using nonlinear least squares regression and instead of creating new pipelines, we harness the power of the #tidyverse to multiple models to multiple TPCs at same time. This makes our code more useable across workflows if you don't want to use the whole workflow...
Interested to learn about #tidyverse?
Happy to share that @JHUDataScience just released a 5 course Specialization on @Coursera:
Tidyverse Skills for Data Science in R! 🎉
coursera.org/specialization…
#rstats #dataviz #datascience #statistics @jhubiostat @JohnsHopkinsSPH
A 🧵 1/n
Happy to share that @JHUDataScience just released a 5 course Specialization on @Coursera:
Tidyverse Skills for Data Science in R! 🎉
coursera.org/specialization…
#rstats #dataviz #datascience #statistics @jhubiostat @JohnsHopkinsSPH
A 🧵 1/n

First, I wrote a blogpost giving a few highlights about the Specialization, what someone will learn, and a bit about the instructors who built the series: @mirnas22 @Shannon_E_Ellis @rdpeng and me! 👩🏫👨🏫
stephaniehicks.com/blog/tidyverse…
2/n
stephaniehicks.com/blog/tidyverse…
2/n

The first course, Introduction to the #Tidyverse, begins with what are "tidy" data, how this helps data organization, how non-tidy can be transformed to tidy data, the data science project life cycle, and an overview of the #tidyverse ecosystem!
coursera.org/learn/tidyverse
3/n
coursera.org/learn/tidyverse
3/n

I spent the weekend putting together a "Meta RMarkdown" blog post!
4 R Markdown Strategies:
1 - Literate Programming
2 - Data Product
3 - Control Document
4 - Template
themockup.blog/posts/2020-07-…
#rstats #datascience #tidyverse
4 R Markdown Strategies:
1 - Literate Programming
2 - Data Product
3 - Control Document
4 - Template
themockup.blog/posts/2020-07-…
#rstats #datascience #tidyverse
1 - Literate Programming
Use RMarkdown like a reproducible scientific notebook, capturing code, comments, and specific outputs in a output document.
All in plain text that is easily human-readable in version control!
Use RMarkdown like a reproducible scientific notebook, capturing code, comments, and specific outputs in a output document.
All in plain text that is easily human-readable in version control!
2 - Data Product
Generate all sorts of fancy outputs from RMarkdown, such as:
- Presentations (Powerpoint or web native like remark.js)
- Dashboards w/ flexdashboards
- Reports as HTML, PDF, Word, etc
- Entire websites w/ blogdown, hugodown, distill
Generate all sorts of fancy outputs from RMarkdown, such as:
- Presentations (Powerpoint or web native like remark.js)
- Dashboards w/ flexdashboards
- Reports as HTML, PDF, Word, etc
- Entire websites w/ blogdown, hugodown, distill
1/13) This semester's teaching on Bayesian stats and cognitive modeling is over! Thanks to COVID (ironically!), I recorded all my teaching sessions w/ @zoom_us, and they are available on #Youtube.
Wondered what have we covered to the cog-neuro audience? A thread.
Wondered what have we covered to the cog-neuro audience? A thread.

2/13) After the overall intro, we had two sessions on #R #Rstudio to bring everyone onto the same page. I am rather old-schooled, so we only covered base R (not #tidyverse)
L01 Intro,
L02 R (P1)
L03 R (P2)
L01 Intro,
L02 R (P1)
L03 R (P2)
3/13) Then we covered foundations of probability theory, and the Bayes' rule. We used a simple and classic binomial example to show how posterior is updated in light of prior and incoming data.
L04 Prob & Bayes'
L05 Binomial
L04 Prob & Bayes'
L05 Binomial
Going over @rlmcelreath's latest book in #rstats. However, I am using #tidyverse tools. So far, I have watched the lectures, completed homework for week 1 and the exercises in chapter 2 of the book. Hope to make it till the end!
Btw, the book is amazing.
david-salazar.github.io/2020/04/19/sta…

Btw, the book is amazing.
david-salazar.github.io/2020/04/19/sta…
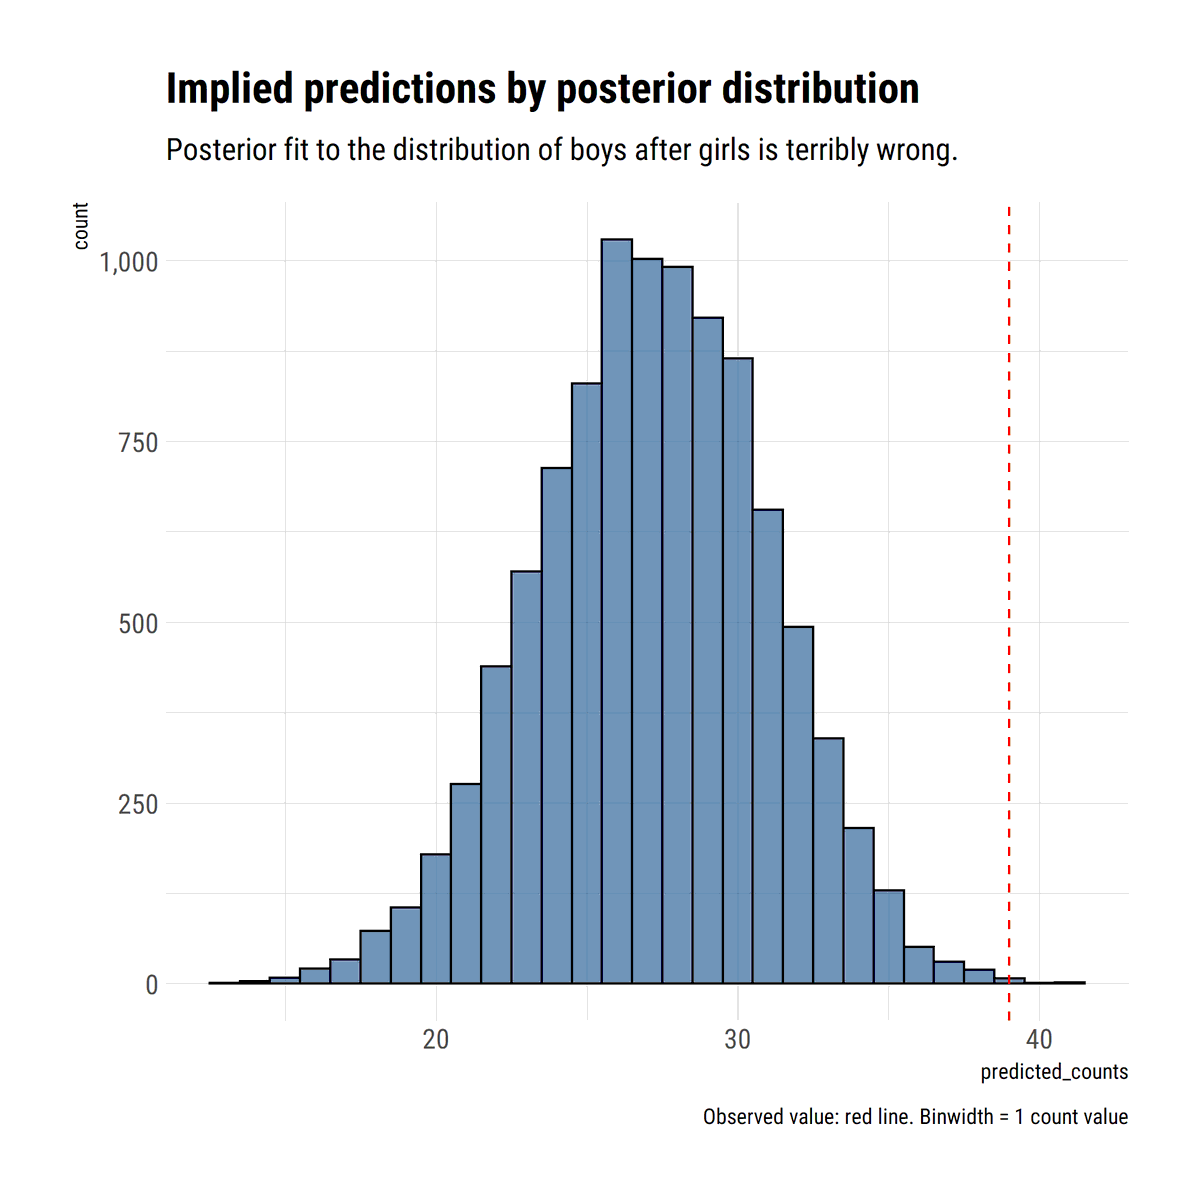
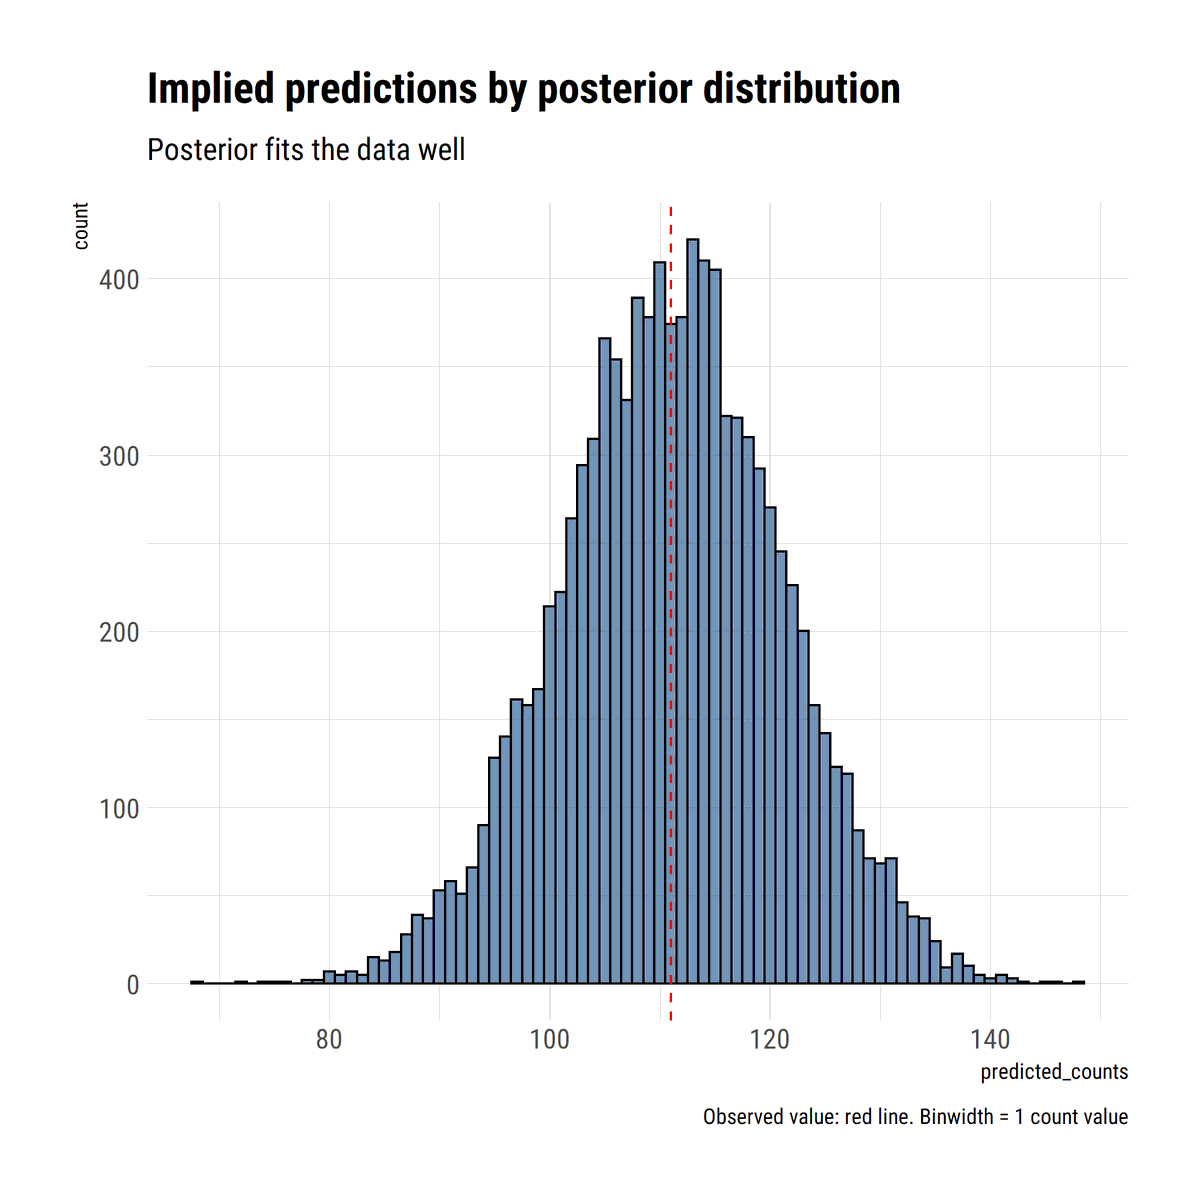
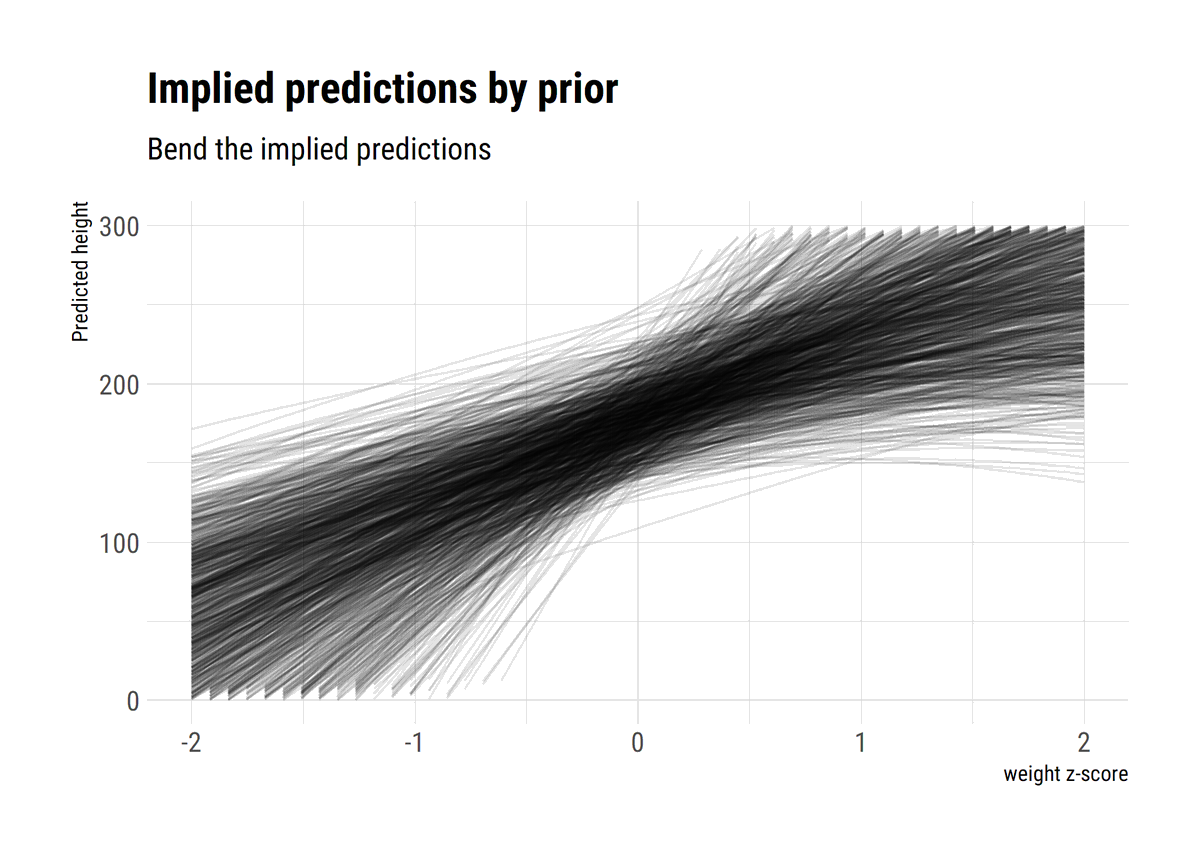
Week 2 of Statistical Rethinking! Lectures and homework completed. @rlmcelreath is equal parts entertaining and knowledgeable. Homework made crystal clear how difficult it is to set priors for polynomial models #tidyverse #rstats
david-salazar.github.io/2020/04/28/sta…

david-salazar.github.io/2020/04/28/sta…
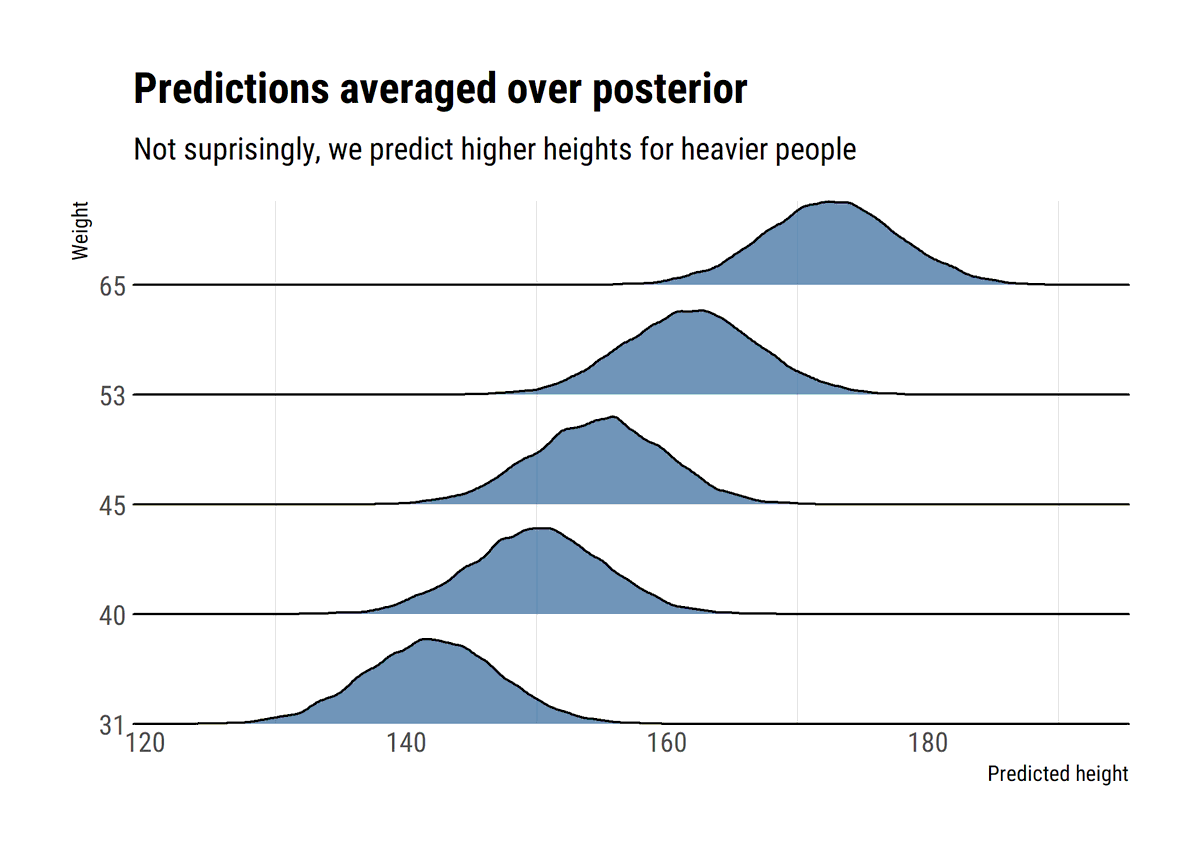
Week 3 of Statistical Rethinking! Multiple regression is both useful and dangerous. @rlmcelreath introduces DAGs as a disciplined way to think about which predictors we can and cannot include. The book keeps getting better and better! #tidyverse #rstats
david-salazar.github.io/2020/05/03/sta…

david-salazar.github.io/2020/05/03/sta…
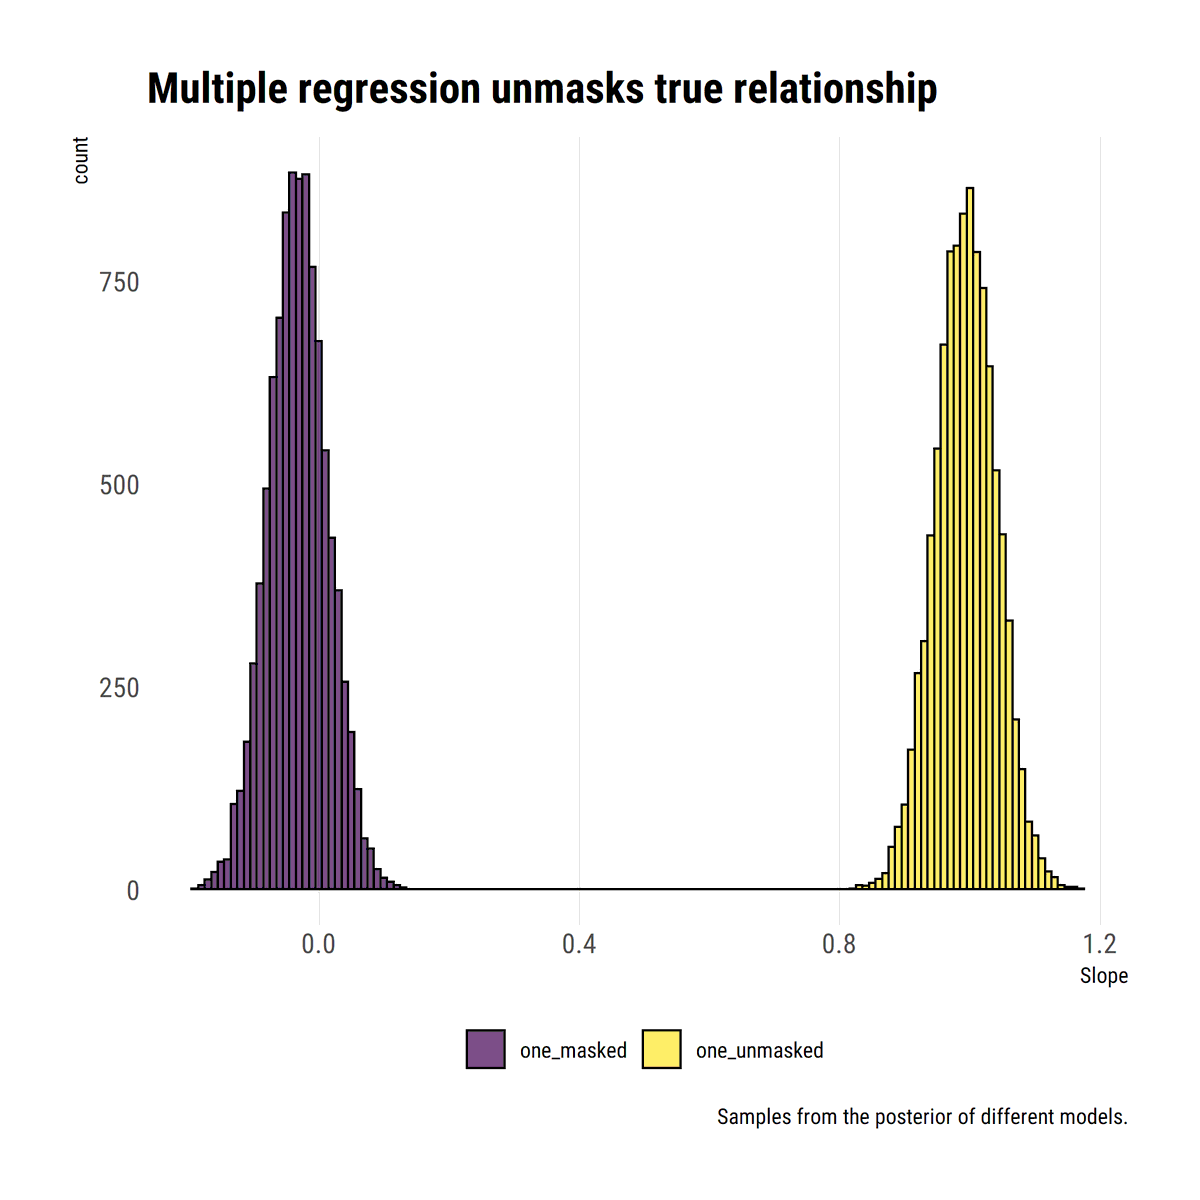
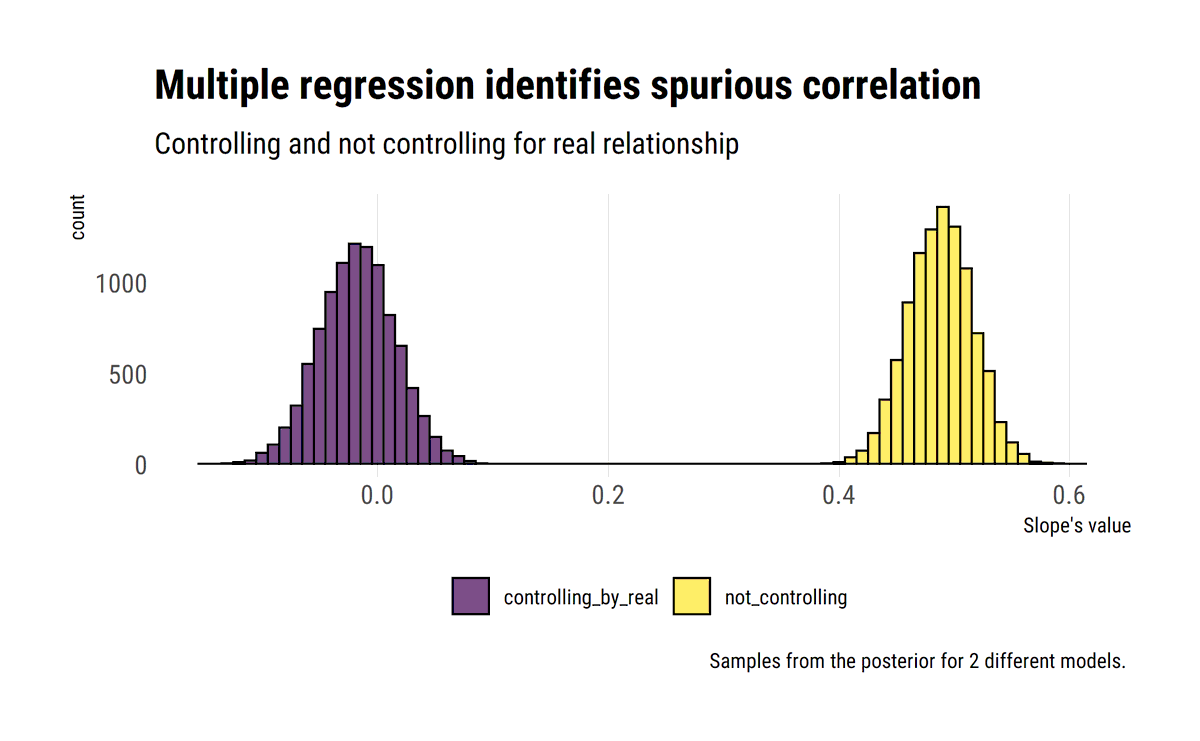
Trying to get my head around fat-tails by studying @nntaleb's latest technical book. Replicated some plots in #rstats #tidyverse
david-salazar.github.io/2020/04/17/fat…

david-salazar.github.io/2020/04/17/fat…
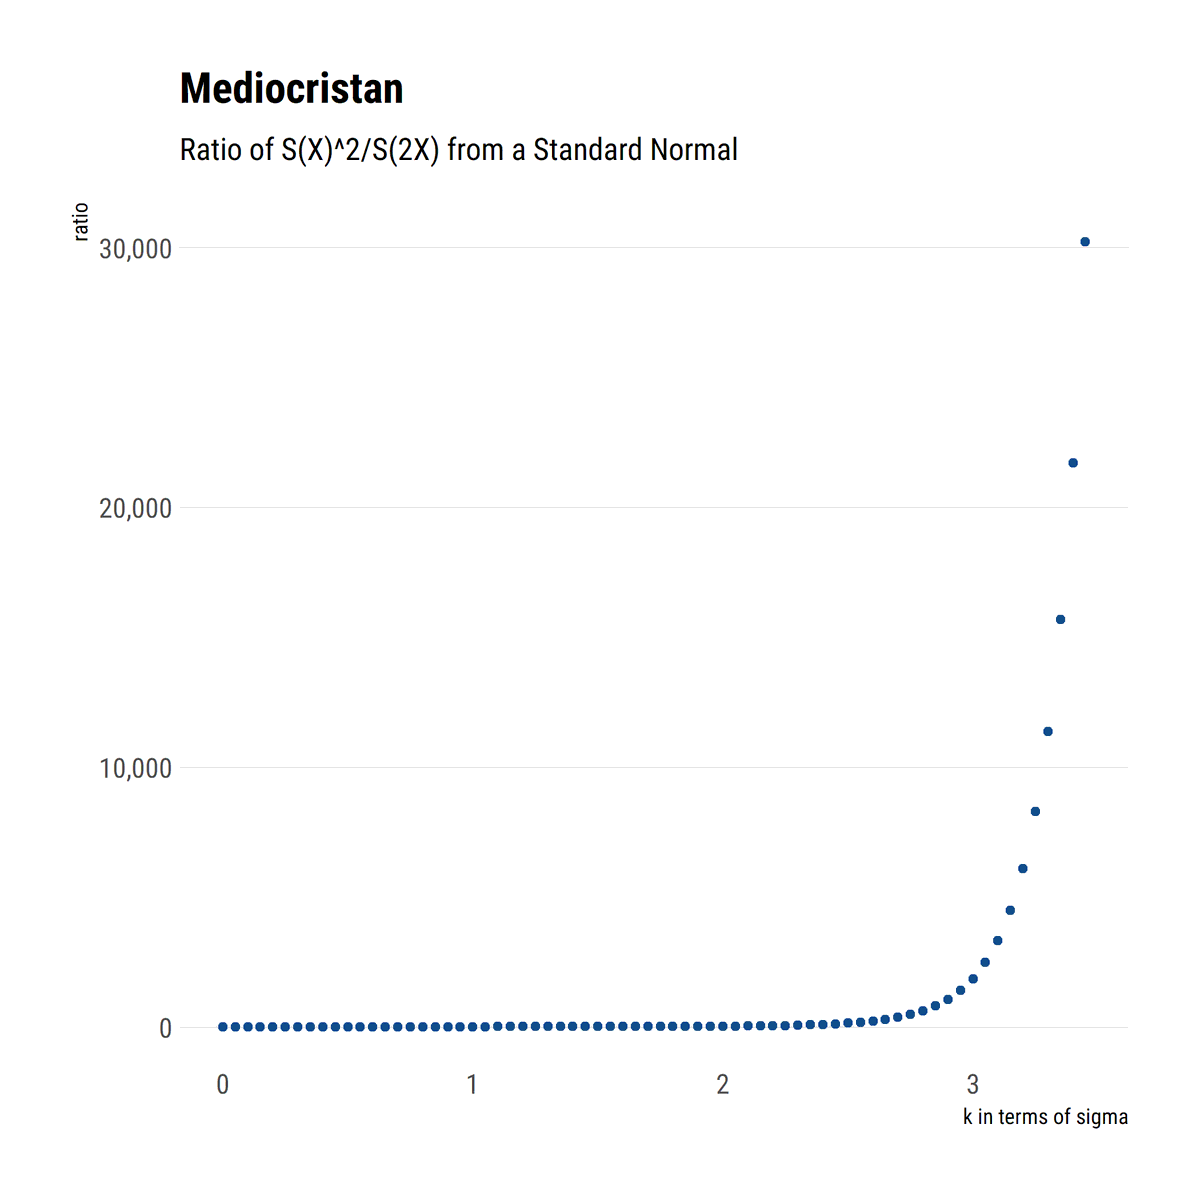
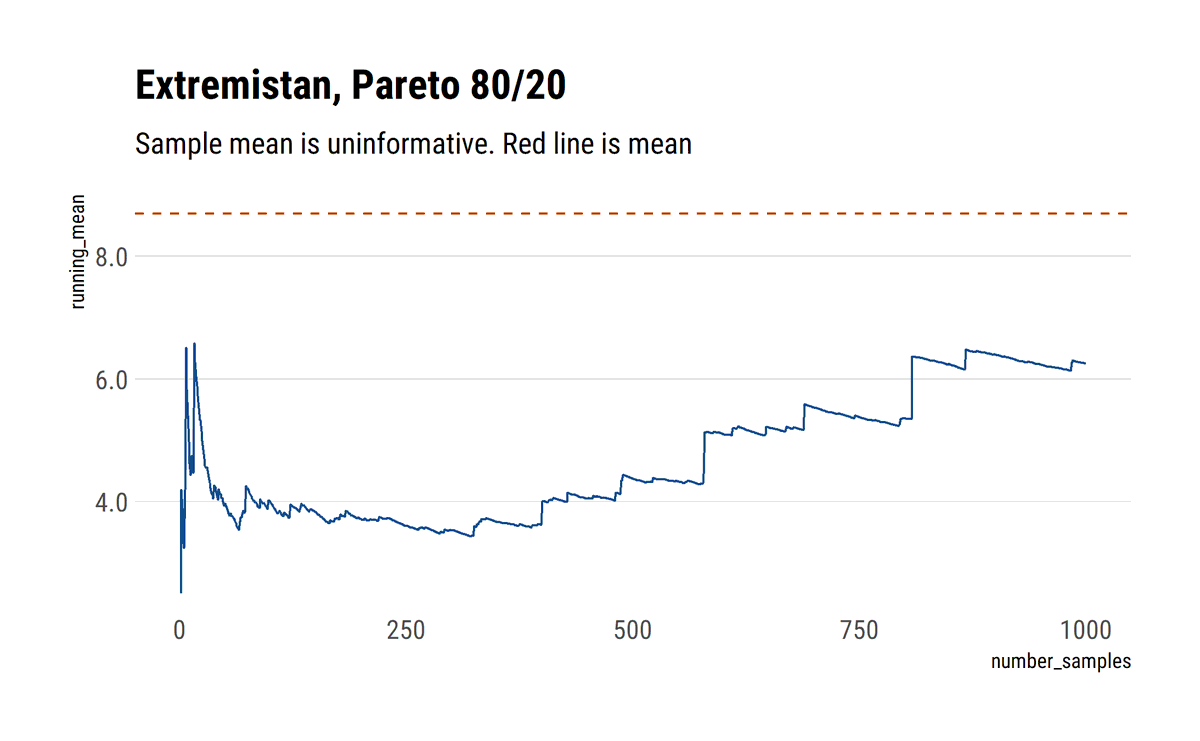
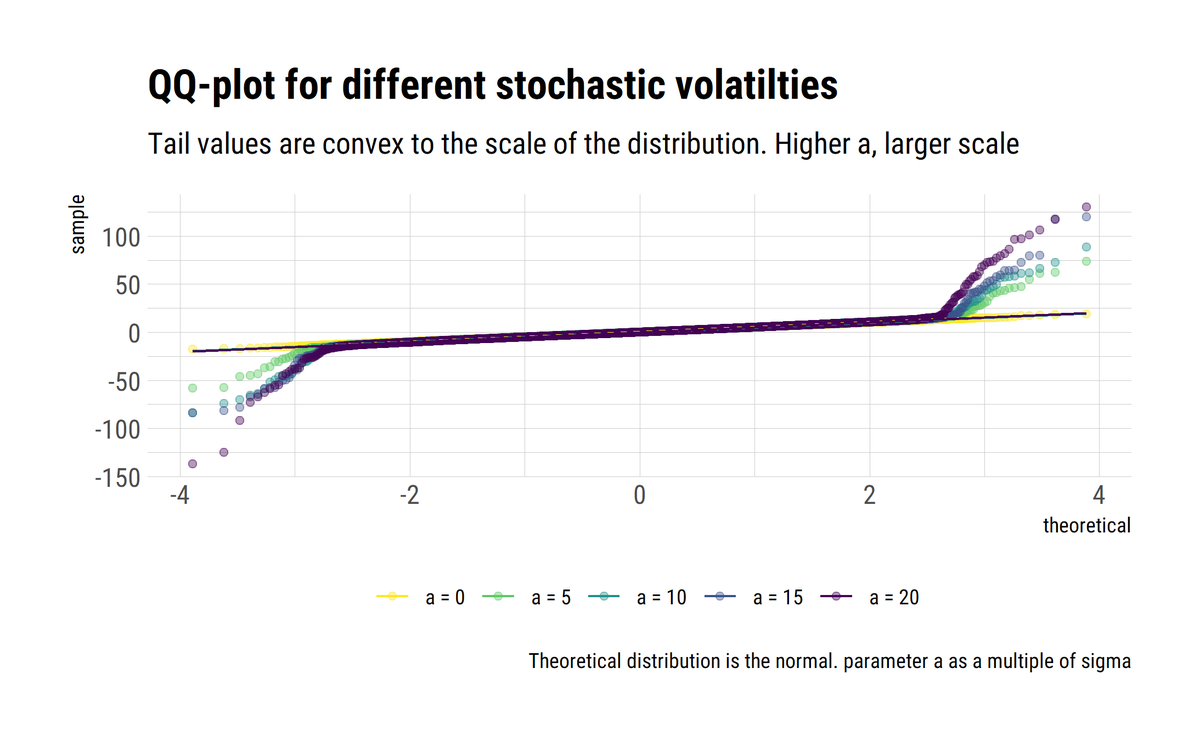
#rstats and @nntaleb's work. By fattening the tails, one learns that the tail events are convex to the scale of the distribution. Thus, the problem compunds: tail events have an increasingly large role, but we cannot estimate their probabilities reliably
david-salazar.github.io/2020/05/09/wha…


david-salazar.github.io/2020/05/09/wha…
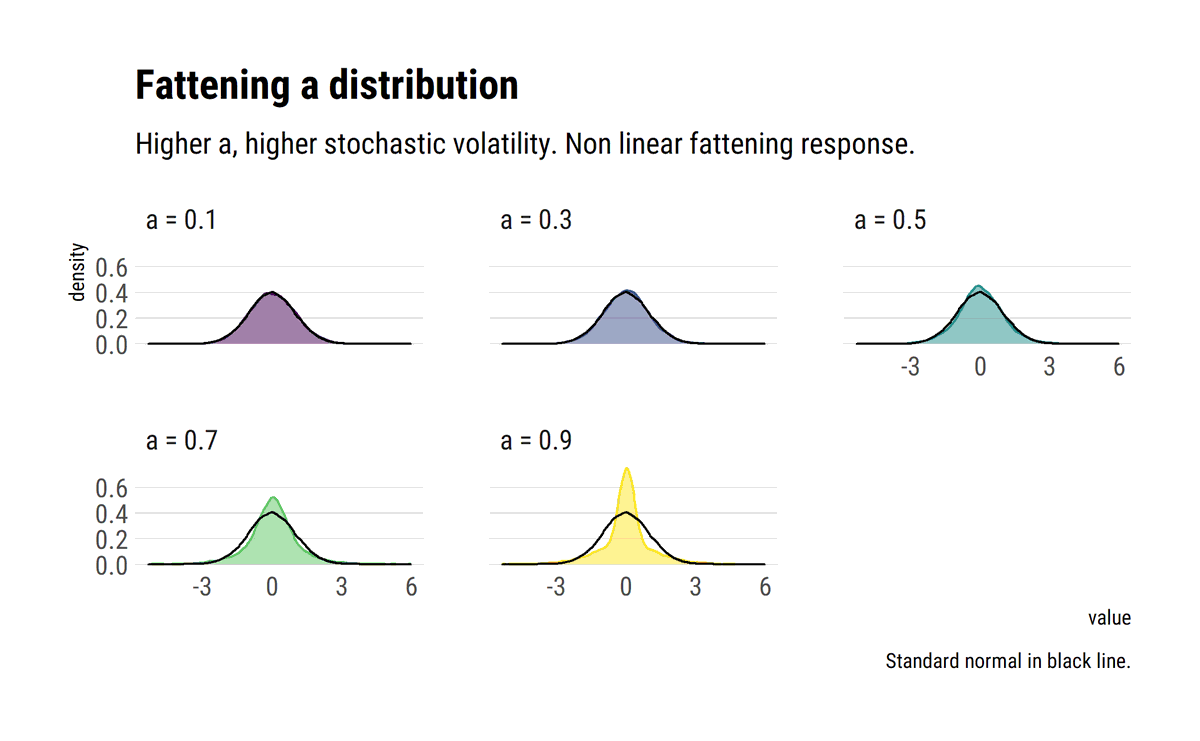
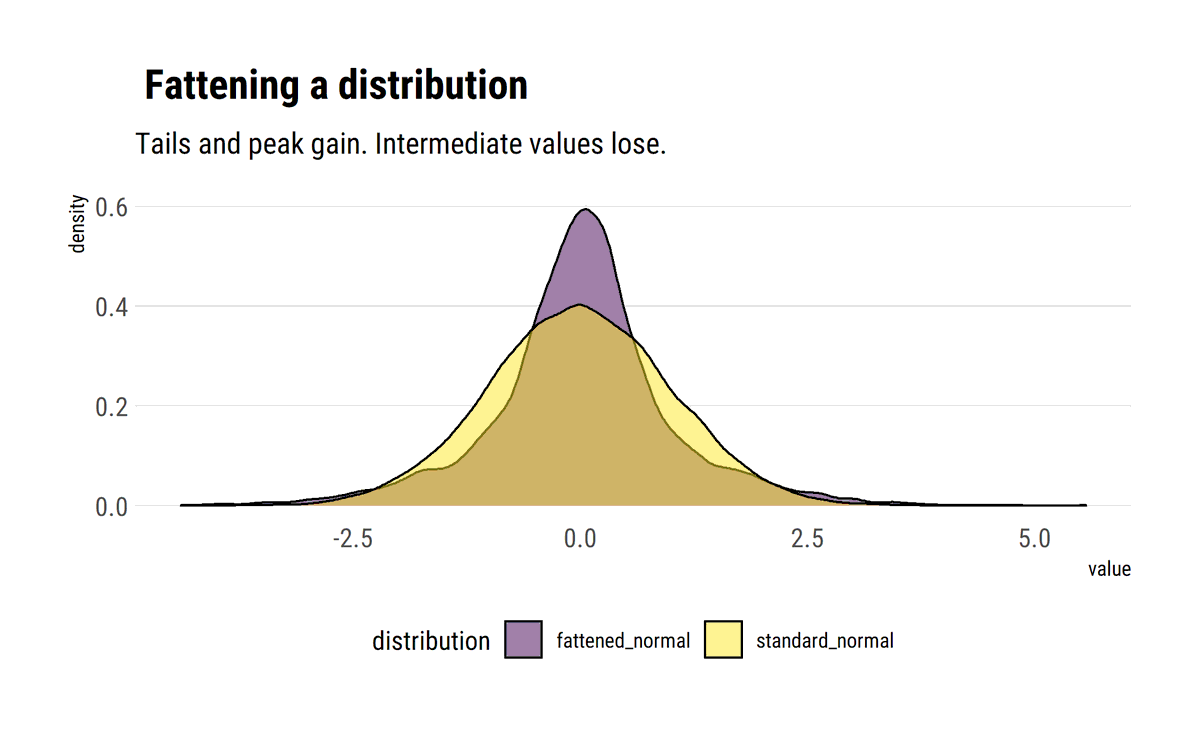
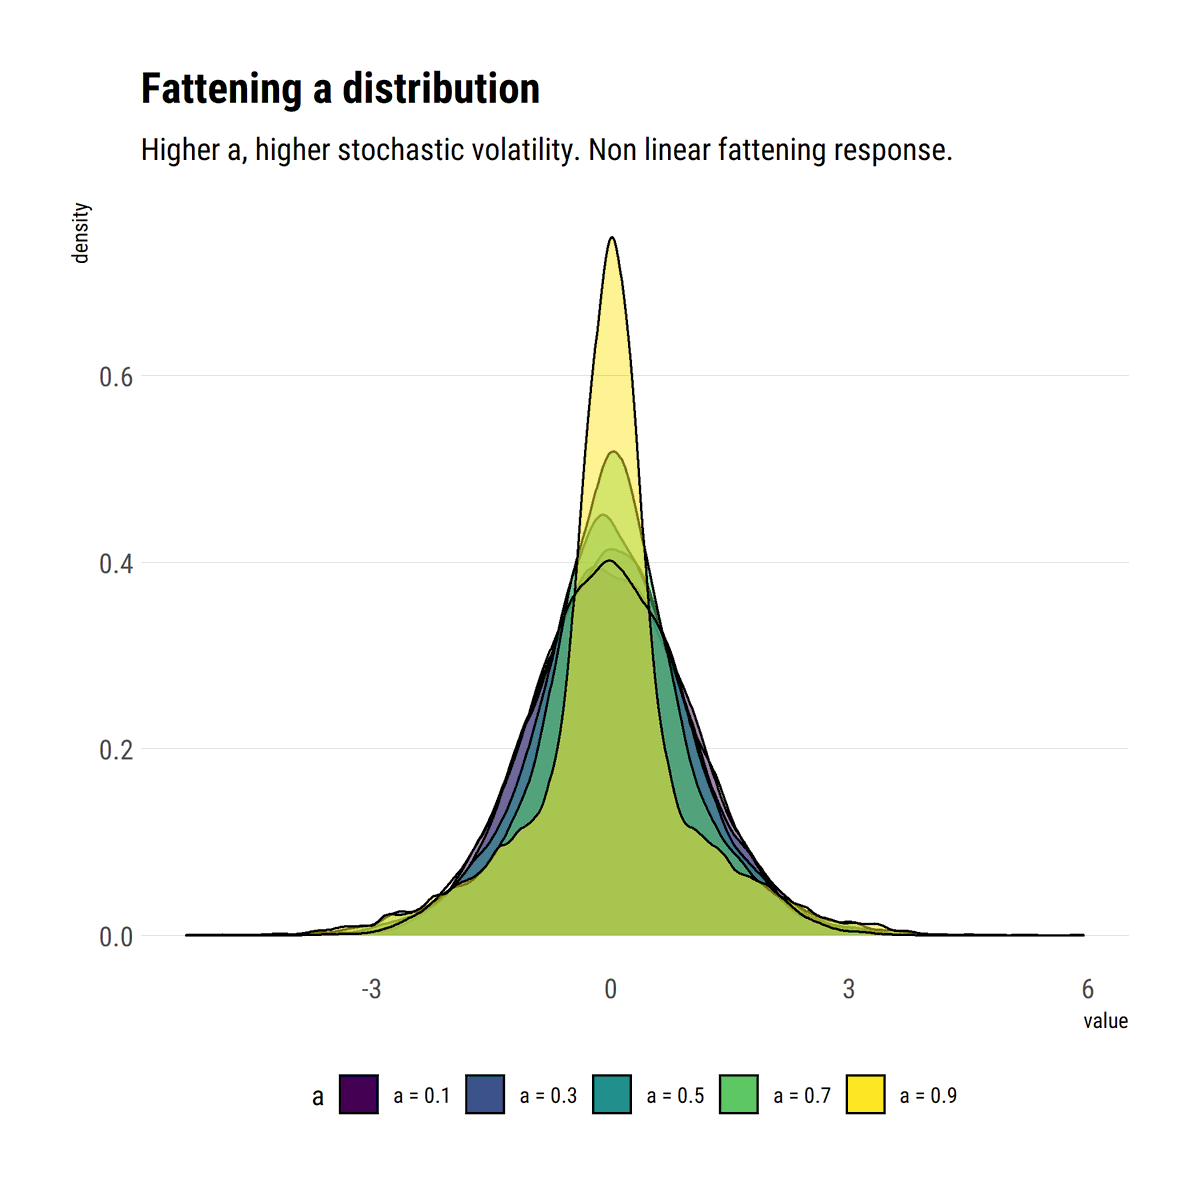
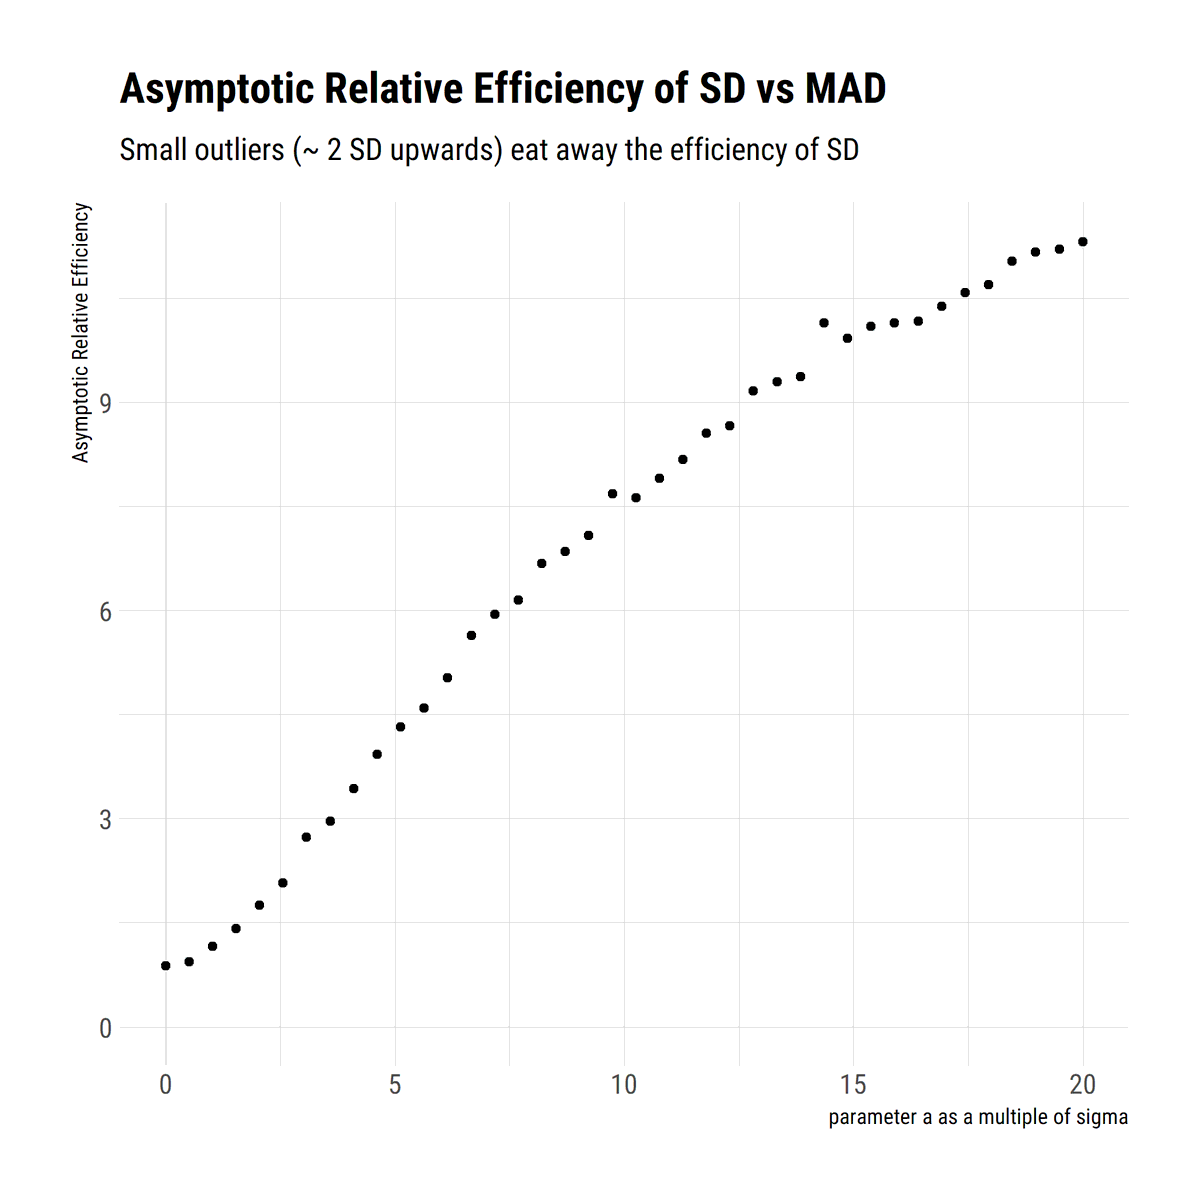
Standard deviation is not intuitive and, outside Mediocristan, the wrong measure of scale. With a simple heuristic to fatten the tails, @nntaleb shows that small deviations wash away the efficiency of SD. MAD is a better measure of scale #rstats
david-salazar.github.io/2020/05/13/sta…

david-salazar.github.io/2020/05/13/sta…
Pleased to announce that #tidybayes v2.0 (SLABS FOR DAYS edition) hit CRAN today. #rstats
Lots of new stuff in this version: A THREAD
Lots of new stuff in this version: A THREAD
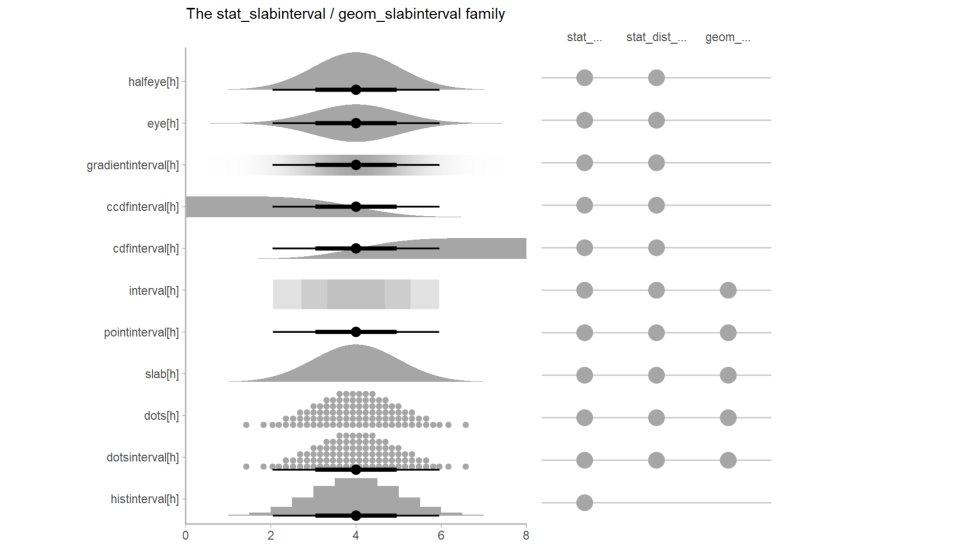
The biggest thing is the new slab+interval meta-geom, generalizing old #tidybayes geoms and enabling a bunch of new ones. This is a flexible FAMILY of #ggplot geoms for visualizing probability distributions and uncertainty using slabs (densities, cdfs, etc), points, and intervals 
I'm excited to share a project I'm working with @ozanjaquette @karinaGsalazar @btskinner and Patricia Martin. We're looking at algorithmic bias in enrollment management. The project is available here: github.com/eddatasci/unro…
1/n
1/n
We're working on this in a really different way-- inspired by @drob's talk on "Unreasonable effectiveness of public work" (tinyurl.com/ugggdkv) we're posting everything that we do publicly on github. 2/n
Please feel free to comment and suggest improvements or changes! We're working in #rstats, using the #tidyverse as the basis for much of the work. 3/n
How much #ChildhoodCancer is there in the world? What does that even mean? In this thread I’ll discuss some recent data to answer this q.
Short answer: There is (likely) much more than you thought!
(For the long answer see my recent podcast-ghccpod.com/gccp-edge1/) 1/14
Short answer: There is (likely) much more than you thought!
(For the long answer see my recent podcast-ghccpod.com/gccp-edge1/) 1/14
First, credit where credit is due: these numbers come from research teams led by Dr. Jennifer Yeh and Zach Ward from @HarvardChanSPH, and Dr. @lisamforce and Dr. Bhakta from @StJude. I made the graphs using R (#rstat!) and @hadleywickham et al.'s #tidyverse packages. 2/14
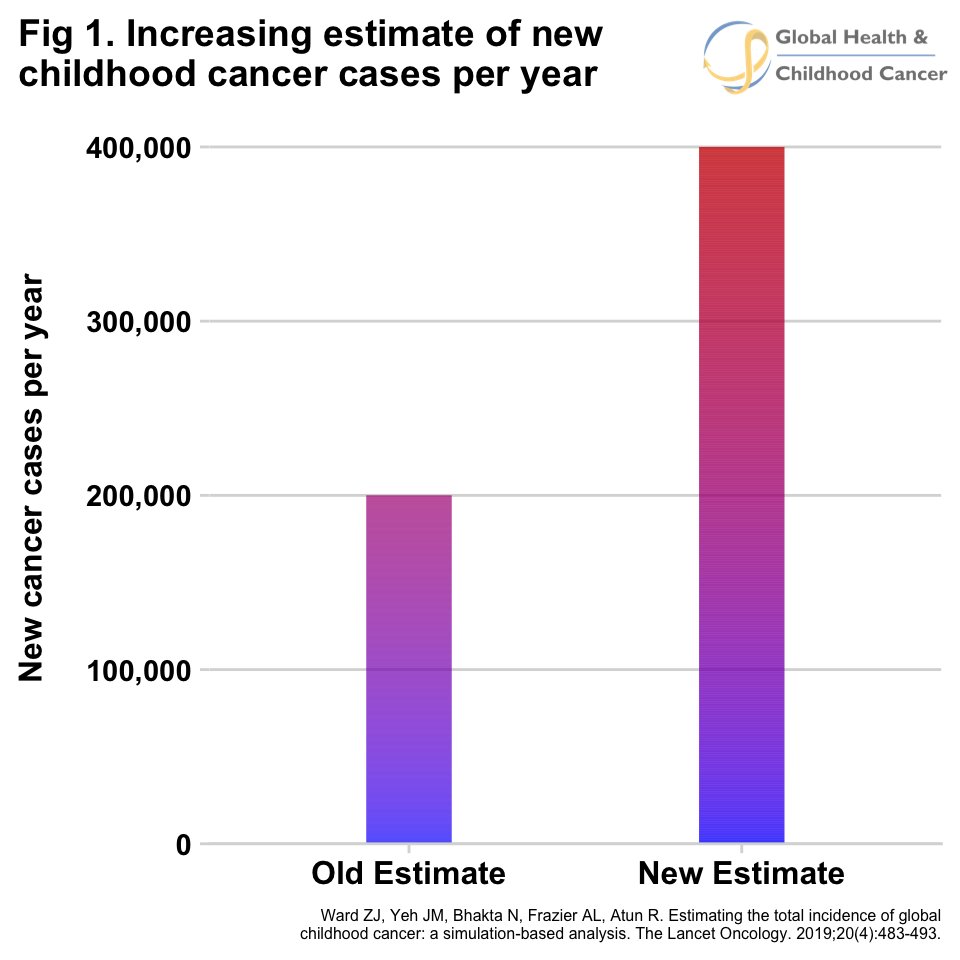
Incidence: How many kids in the world get cancer each year? Previous estimates had it around 200k, but recent estimates put it closer to 400,000 children yearly! And 90% of kids live in LMICs – where treatment is often substandard or unavailable.
(thelancet.com/journals/lanon…) 3/14
(thelancet.com/journals/lanon…) 3/14
1. New (first) paper now available: Exploring the effects of BCG #vaccination in patients diagnosed with #tuberculosis: Observational study using the Enhanced Tuberculosis Surveillance system
Paper: doi.org/10.1016/j.vacc…
Preprint: doi.org/10.1101/366476
#phdchat #rstats
Paper: doi.org/10.1016/j.vacc…
Preprint: doi.org/10.1101/366476
#phdchat #rstats
2. Highlights
Evidence of an association between BCG vaccination and reduced all-cause mortality in TB cases.
Weaker evidence of an association between BCG vaccination and reduced repeat TB episodes in TB cases.
Little evidence of an association with other TB outcomes.
Evidence of an association between BCG vaccination and reduced all-cause mortality in TB cases.
Weaker evidence of an association between BCG vaccination and reduced repeat TB episodes in TB cases.
Little evidence of an association with other TB outcomes.
3. Background: Bacillus Calmette–Guérin (BCG) is one of the most widely-used vaccines worldwide. BCG primarily reduces the progression from infection to disease, however, there is evidence that BCG may provide additional benefits.
Okay so let me just start by saying: This is a wonderful straightforward breakdown of R vs. Python, thank you to all the contributors and especially @matloff!
However, I (predictably) have some bones to pick on the Tidyverse points. [1/7]
However, I (predictably) have some bones to pick on the Tidyverse points. [1/7]
First: "I am not including [...] ggplot2 and dplyr. Instead, I am referring to things such as tibbles and pipes."
1. dplyr without pipes? what? ggplot2 without `+`, which is pipe in disguise?
2. Is it really fair to say, "I don't like X, except the parts I like"?
[2/7]
1. dplyr without pipes? what? ggplot2 without `+`, which is pipe in disguise?
2. Is it really fair to say, "I don't like X, except the parts I like"?
[2/7]
Second: "... the plethora of extra functions Tidyverse advocates burden students with learning."
The trade-off is for consistency as compared to base R.
I learned {stringr} in an hour. I still have to look up `grep` and `gsub`. Same for {purrr} vs `apply`.
[3/7]
The trade-off is for consistency as compared to base R.
I learned {stringr} in an hour. I still have to look up `grep` and `gsub`. Same for {purrr} vs `apply`.
[3/7]


