Discover and read the best of Twitter Threads about #Resistances
Most recents (24)
@GenderSmart_EU @mindthegeps_eu @letsgeps @CaliperEu @SpearProject @eu_granted @ATHENA_Equality @GearingRoles @Equal4E @REA_research @ripeerseu @Resistire_EU @UniSAFE_gbv @Reset_EUproject @CasperGender @GenderSti @gendertarget @GENDERACTION_EU @CyUniTech @AgenceRecherche @Cirad @CICYTEX @CIHEAMBari @HorizonEU @MyYellowWindow @NKC_CZ @WUR @teagasc Hi there, happy #IWD2022!
At SUPERA, we proudly work with 4 RPOs and 2 RFOs to implement gender equality plans.
During our project, we produced interesting outcomes related to #resistances, gender-sensitive #communication, RFOs networking. Check them at: superaproject.eu/portfolio-item…
At SUPERA, we proudly work with 4 RPOs and 2 RFOs to implement gender equality plans.
During our project, we produced interesting outcomes related to #resistances, gender-sensitive #communication, RFOs networking. Check them at: superaproject.eu/portfolio-item…

@GenderSmart_EU @mindthegeps_eu @letsgeps @CaliperEu @SpearProject @eu_granted @ATHENA_Equality @GearingRoles @Equal4E @REA_research @ripeerseu @Resistire_EU @UniSAFE_gbv @Reset_EUproject @CasperGender @GenderSti @gendertarget @GENDERACTION_EU @CyUniTech @AgenceRecherche @Cirad @CICYTEX @CIHEAMBari @HorizonEU @MyYellowWindow @NKC_CZ @WUR @teagasc On March 25th, at our Final conference, we will showcase a selection of inspiring practices developed by our partner institutions.
Registrations are open: we can't wait to meet you, either in Madrid or on Zoom!
🔗 Agenda & link available at:
superaproject.eu/beyond-ticking…
Registrations are open: we can't wait to meet you, either in Madrid or on Zoom!
🔗 Agenda & link available at:
superaproject.eu/beyond-ticking…

@GenderSmart_EU @mindthegeps_eu @letsgeps @CaliperEu @SpearProject @eu_granted @ATHENA_Equality @GearingRoles @Equal4E @REA_research @ripeerseu @Resistire_EU @UniSAFE_gbv @Reset_EUproject @CasperGender @GenderSti @gendertarget @GENDERACTION_EU @CyUniTech @AgenceRecherche @Cirad @CICYTEX @CIHEAMBari @HorizonEU @MyYellowWindow @NKC_CZ @WUR @teagasc @SUPERA_UCM @PRESAGEgenre @ceu @ces_uc @univca @EdicSardegna @CienciaGob @FECYT_Ciencia @threadreaderapp unroll
The #Zapatista tour of #Ireland, a long aul’ thread (but pix and vids!) to wrap up
In 1994 indigenous peasants in the mountains of SE Mexico rose up against #neoliberal capitalism, their latest struggle in 500 years of resisting colonialism…
#LaGiraZapatistaVa #EZLN
In 1994 indigenous peasants in the mountains of SE Mexico rose up against #neoliberal capitalism, their latest struggle in 500 years of resisting colonialism…
#LaGiraZapatistaVa #EZLN

If you need a backgrounder, here's Mick McCaughan, ex-Latin American correspondent for the Irish Times and Guardian introducing why the #Zapatistas matter:
27 years later, they hold liberated territory the size of Munster –
governing themselves from below
with a powerful #womxn’s movement
practicing #AgroEcology
and with their own culture, education system, community media...
@GalwayFeminist:
rss.com/podcasts/theza…
governing themselves from below
with a powerful #womxn’s movement
practicing #AgroEcology
and with their own culture, education system, community media...
@GalwayFeminist:
rss.com/podcasts/theza…
Analysis: #NASDAQ $GRWG
Case 437 #GrowGeneration Corp.
DISCLAIMER: The analysis is strictly for educational purposes and should not be construed as an invitation to trade.
#GRWG 1/4
Case 437 #GrowGeneration Corp.
DISCLAIMER: The analysis is strictly for educational purposes and should not be construed as an invitation to trade.
#GRWG 1/4

Chart 1
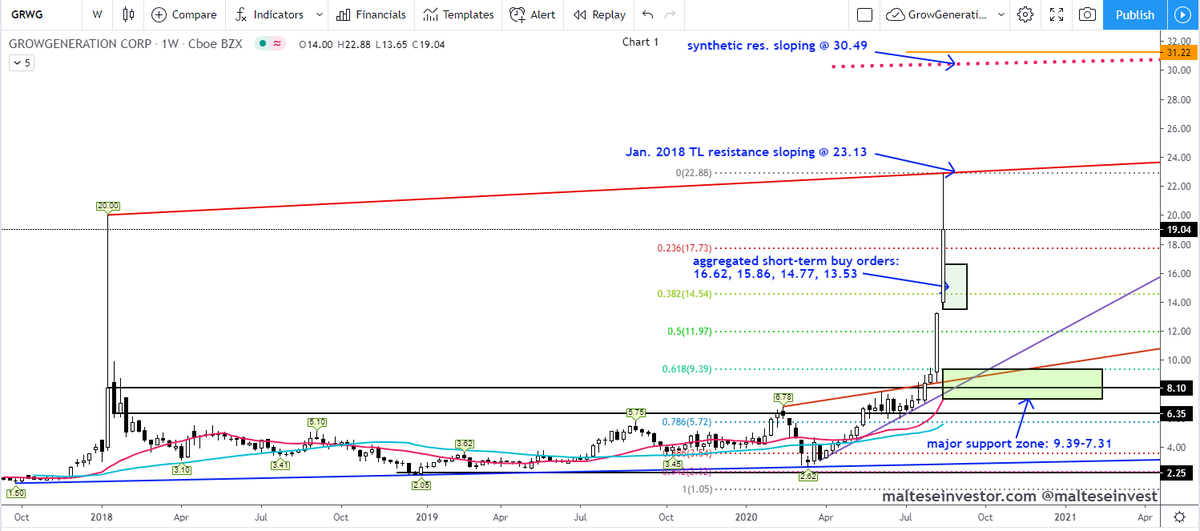
Weekly Chart: Price finally broke above the Jan. 2018 range top in July 2020, since then the price has gone #parabolic. A close/hold above 23.13 will target synthetic #resistances at 30.49-31.22 with a close above the latter targeting 38.27- 39.76. To the .....
GRWG 2/4
Weekly Chart: Price finally broke above the Jan. 2018 range top in July 2020, since then the price has gone #parabolic. A close/hold above 23.13 will target synthetic #resistances at 30.49-31.22 with a close above the latter targeting 38.27- 39.76. To the .....
GRWG 2/4
..... downside, aggregated short-term buy orders at 16.62, 15.86, 14.77 and 13.53 with the #Fib. 0.50 at 11.97, farther down the strong #support zone 9.39- 7.31 (Fib. 0.618, #trendlines and #pivots).
GRWG 3/4
GRWG 3/4
Analysis: #NASDAQ $BLIN
Case 412 #BridgelineDigital Inc.
DISCLAIMER: The analysis is strictly for educational purposes and should not be construed as an invitation to trade.
#BLIN 1/4
Case 412 #BridgelineDigital Inc.
DISCLAIMER: The analysis is strictly for educational purposes and should not be construed as an invitation to trade.
#BLIN 1/4

Chart 1
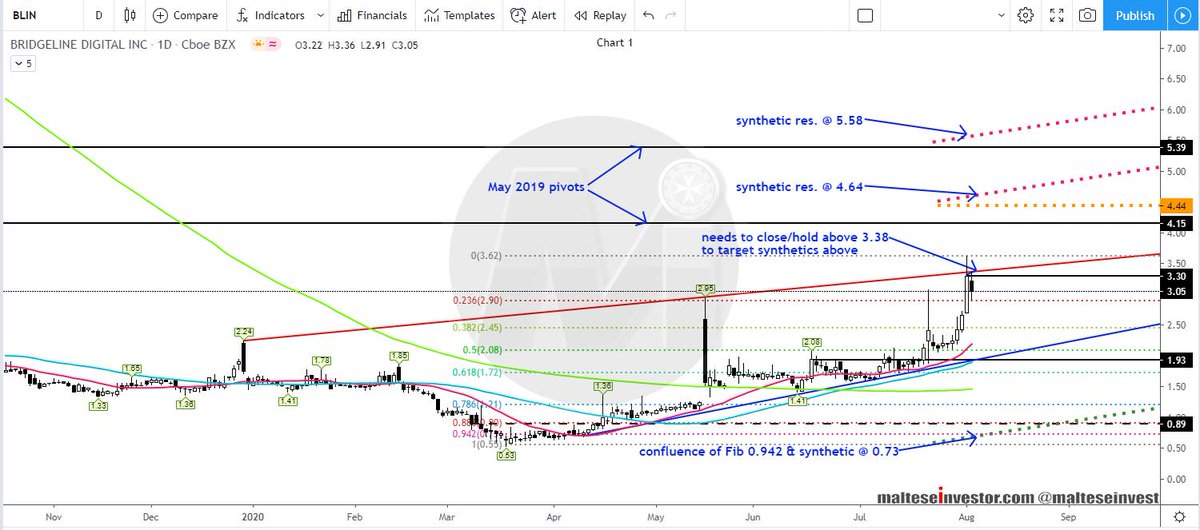
Daily Chart: Price has risen strongly off the all time low, smashing through the June 2020 #pivot and stalling at the Dec. 2019 #trendline. A close/hold above 3.38 is required to tackle .....
BLIN 2/4
Daily Chart: Price has risen strongly off the all time low, smashing through the June 2020 #pivot and stalling at the Dec. 2019 #trendline. A close/hold above 3.38 is required to tackle .....
BLIN 2/4
..... synthetic #resistances at 4.44/64, 5.58. #Support begins from #Fib. 0.382 at 2.45 stretching to the pivot 1.93 with #SMA 50 at 1.89.
BLIN 3/4
BLIN 3/4
Analysis: #NASDAQ $ABUS
Case 395 #Arbutus Biopharma Corporation
DISCLAIMER: The analysis is strictly for educational purposes and should not be construed as an invitation to trade.
#ABUS 1/5
Case 395 #Arbutus Biopharma Corporation
DISCLAIMER: The analysis is strictly for educational purposes and should not be construed as an invitation to trade.
#ABUS 1/5

Chart 1
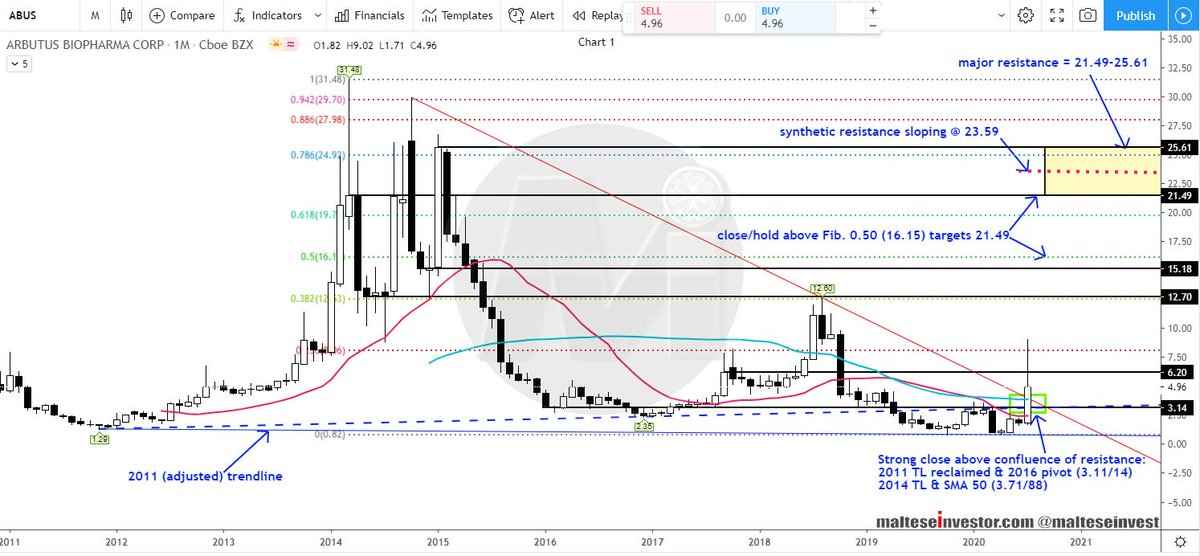
Monthly Chart: Price has bounced strongly taking out a #confluence of multiple #resistances: the reclaimed 2011 trendline, 2016 #pivot, 2014 trendline and SMA 50 at 3.11/14, 3.71/88 respectively. A close .....
ABUS 2/5
Monthly Chart: Price has bounced strongly taking out a #confluence of multiple #resistances: the reclaimed 2011 trendline, 2016 #pivot, 2014 trendline and SMA 50 at 3.11/14, 3.71/88 respectively. A close .....
ABUS 2/5
..... above 6.20 targets 12.05/70, further up a close/hold above the #Fib. 0.50 (16.15) targets 21.49.
ABUS 3/5
ABUS 3/5
Analysis: #NASDAQ $AUPH
Case 377 #Aurinia Pharmaceuticals Inc.
DISCLAIMER: The analysis is strictly for educational purposes and should not be construed as an invitation to trade.
#AUPH 1/4
Case 377 #Aurinia Pharmaceuticals Inc.
DISCLAIMER: The analysis is strictly for educational purposes and should not be construed as an invitation to trade.
#AUPH 1/4

Chart 1
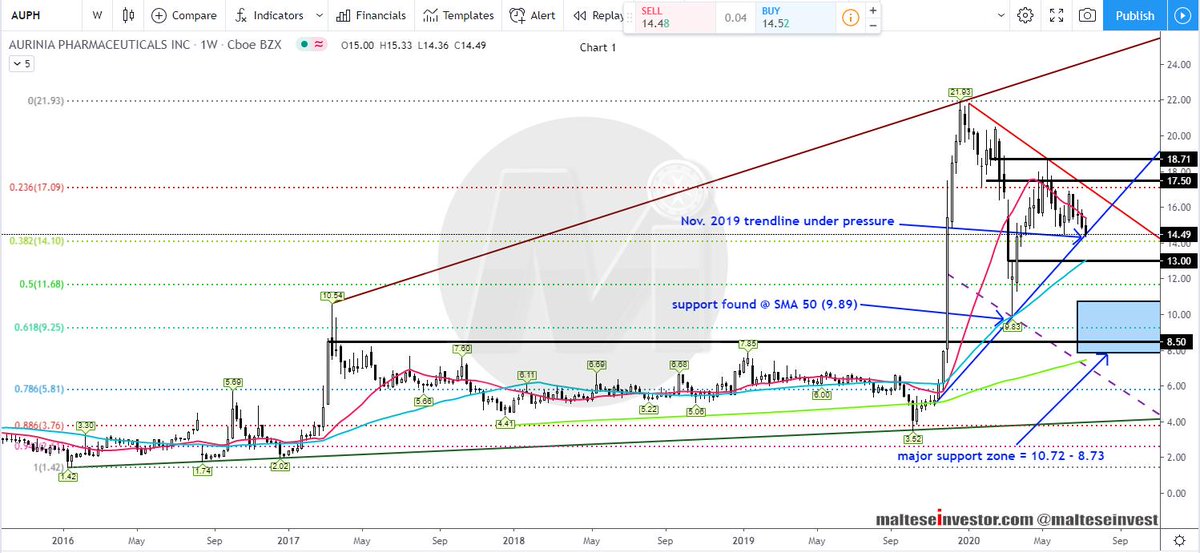
Weekly Chart: As expected the 2019 #parabolic move saw a correction taking price between the #Fib. 0.50 and 0.681, stalling at the #SMA 50 - however, the reaction has been disappointing as it failed to gain a foothold above #pivot .....
AUPH 2/4
Weekly Chart: As expected the 2019 #parabolic move saw a correction taking price between the #Fib. 0.50 and 0.681, stalling at the #SMA 50 - however, the reaction has been disappointing as it failed to gain a foothold above #pivot .....
AUPH 2/4
..... #resistances 17.50 - 18.71. The Nov. 2019 #trendline is under pressure - a close below targets 13.00.
AUPH 3/4
AUPH 3/4
Analysis: #NYSE $X
Case 339 #United_States_Steel Corporation
DISCLAIMER: The analysis is strictly for educational purposes and should not be construed as an invitation to trade.
#X 1/4
Case 339 #United_States_Steel Corporation
DISCLAIMER: The analysis is strictly for educational purposes and should not be construed as an invitation to trade.
#X 1/4

Chart 1
Monthly Chart: Price traded to a new all time low of 4.54, Mar. 2020, but failed to close below the 17 year #trendline support. Watch the #SMA 20 closely as it had acted as #support since .....
X 2/4
Monthly Chart: Price traded to a new all time low of 4.54, Mar. 2020, but failed to close below the 17 year #trendline support. Watch the #SMA 20 closely as it had acted as #support since .....
X 2/4
Analysis: #NASDAQ
Case 321 #Endo International plc - Revisited
Special request: Sveta
DISCLAIMER: The analysis is strictly for educational purposes and should not be construed as an invitation to trade.
#ENDP 1/4
Case 321 #Endo International plc - Revisited
Special request: Sveta
DISCLAIMER: The analysis is strictly for educational purposes and should not be construed as an invitation to trade.
#ENDP 1/4

Chart 1
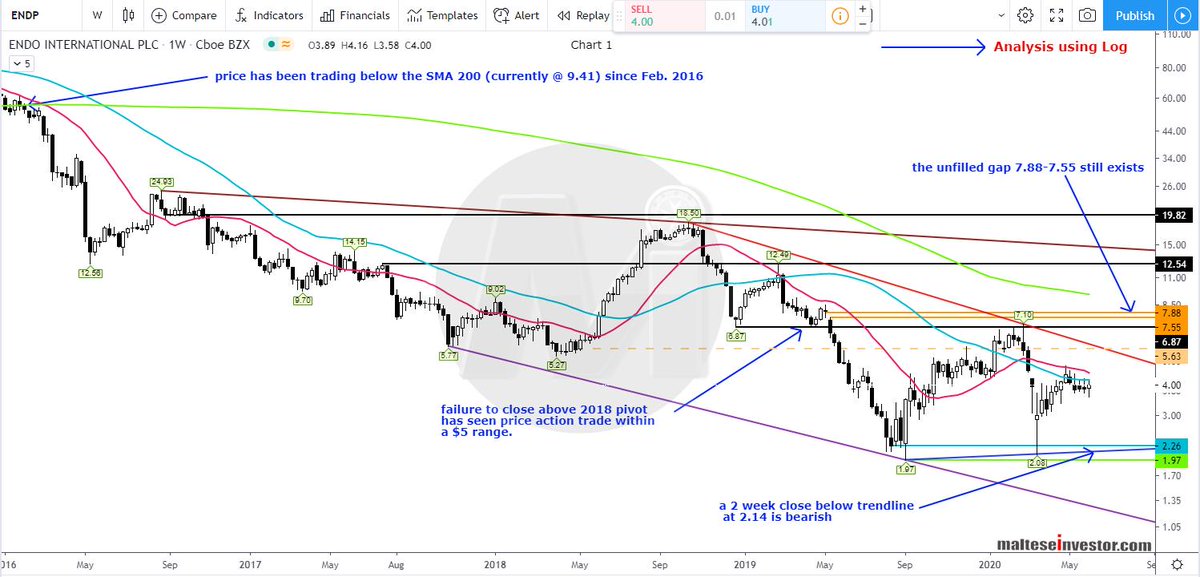
Weekly Chart: Since the Oct. 2019 analysis price managed to close above 5.63 but failed to fill the gap and closed back below - price remains constrained to a $5 range. Multiple #resistances are formidable - a close above the 2018 #pivot at .....
ENDP 2/4
Weekly Chart: Since the Oct. 2019 analysis price managed to close above 5.63 but failed to fill the gap and closed back below - price remains constrained to a $5 range. Multiple #resistances are formidable - a close above the 2018 #pivot at .....
ENDP 2/4
..... 6.87 will see a run towards the unfilled gap and further up the #SMA 200 at 9.41, has contained the downside since 2016. To the downside a 2 week close below #trendline #support at 2.14 will be very #bearish.
ENDP 3/4
ENDP 3/4
Analysis: #NYSE $TRN
Case 281 #Trinity Industries, Inc.
DISCLAIMER: The analysis is strictly for educational purposes and should not be construed as an invitation to trade.
#TRN 1/4
Case 281 #Trinity Industries, Inc.
DISCLAIMER: The analysis is strictly for educational purposes and should not be construed as an invitation to trade.
#TRN 1/4

Chart 1
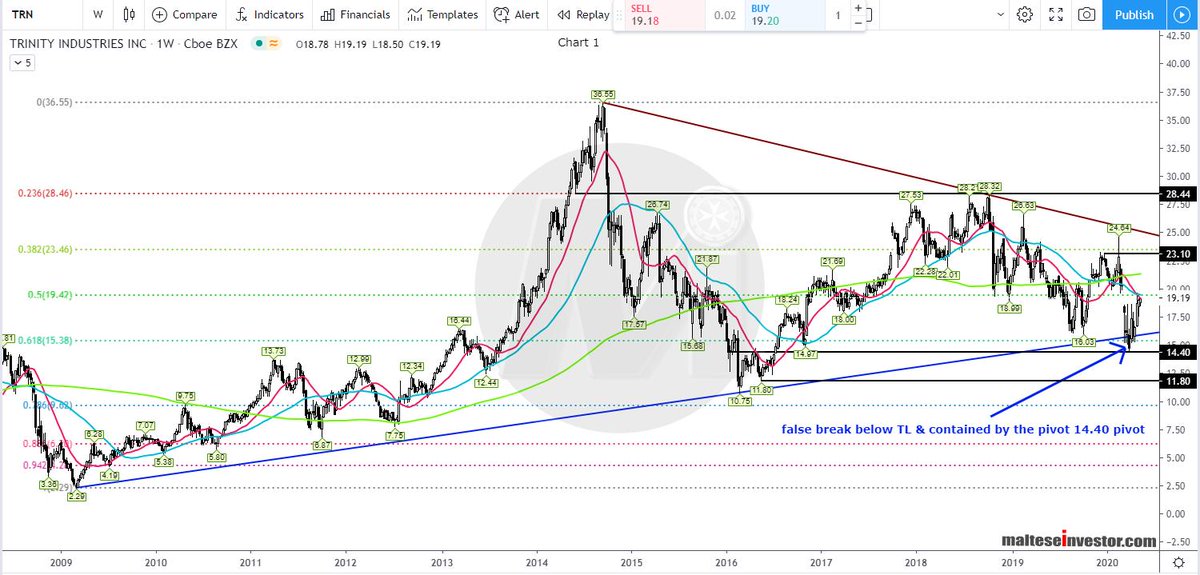
Weekly Chart: The uptrend is still #bullish and an attempt to move above the #SMA 20 & 50 (19.16/50) is in progress - a break/ hold above 23.10 (pivot) and then above 25.10 (trendline) is required to tackle strong #resistances at .....
TRN 2/4
Weekly Chart: The uptrend is still #bullish and an attempt to move above the #SMA 20 & 50 (19.16/50) is in progress - a break/ hold above 23.10 (pivot) and then above 25.10 (trendline) is required to tackle strong #resistances at .....
TRN 2/4
..... 28.44 - 29.30. A failed attempt to break below long term #trendline support was seen in March but found buyers resting on the #Fib 0.618 and strong #pivot and cluster #support at 14.40.
TRN 3/4
TRN 3/4
Analysis: #NYSE $TECK
Case 280 #Teck_Resources Limited
DISCLAIMER: The analysis is strictly for educational purposes and should not be construed as an invitation to trade.
#TECK 1/3
Case 280 #Teck_Resources Limited
DISCLAIMER: The analysis is strictly for educational purposes and should not be construed as an invitation to trade.
#TECK 1/3

Chart 1
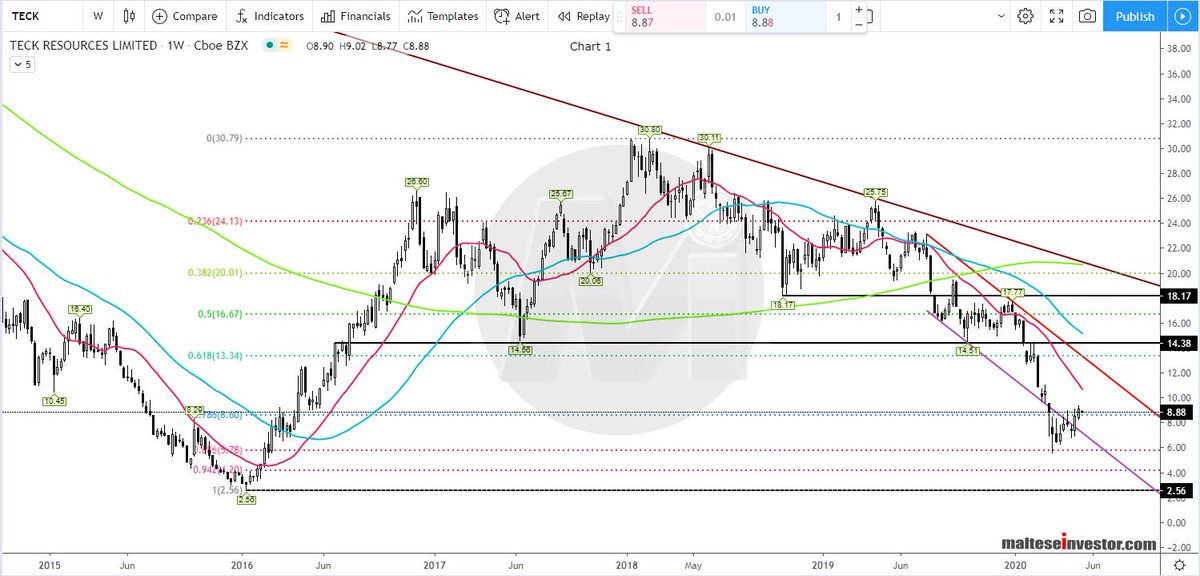
Weekly Chart: Price is revisiting the lows seen in 2016, the Fib 0.886 has contained the move down and price currently trades above the #Fib 0.786 at 8.60. Formidable #resistances appear at 12.90 (#pivot) then 13.34/44 (Fib 0.618 and #trendline) and 14.38/94.
TECK 2/3
Weekly Chart: Price is revisiting the lows seen in 2016, the Fib 0.886 has contained the move down and price currently trades above the #Fib 0.786 at 8.60. Formidable #resistances appear at 12.90 (#pivot) then 13.34/44 (Fib 0.618 and #trendline) and 14.38/94.
TECK 2/3
Analysis: #NASDAQ $IRBT
Case 258 #iRobot Corporation
DISCLAIMER: The analysis is strictly for educational purposes and should not be construed as an invitation to trade.
#IRBT 1/4
Case 258 #iRobot Corporation
DISCLAIMER: The analysis is strictly for educational purposes and should not be construed as an invitation to trade.
#IRBT 1/4

Chart 1
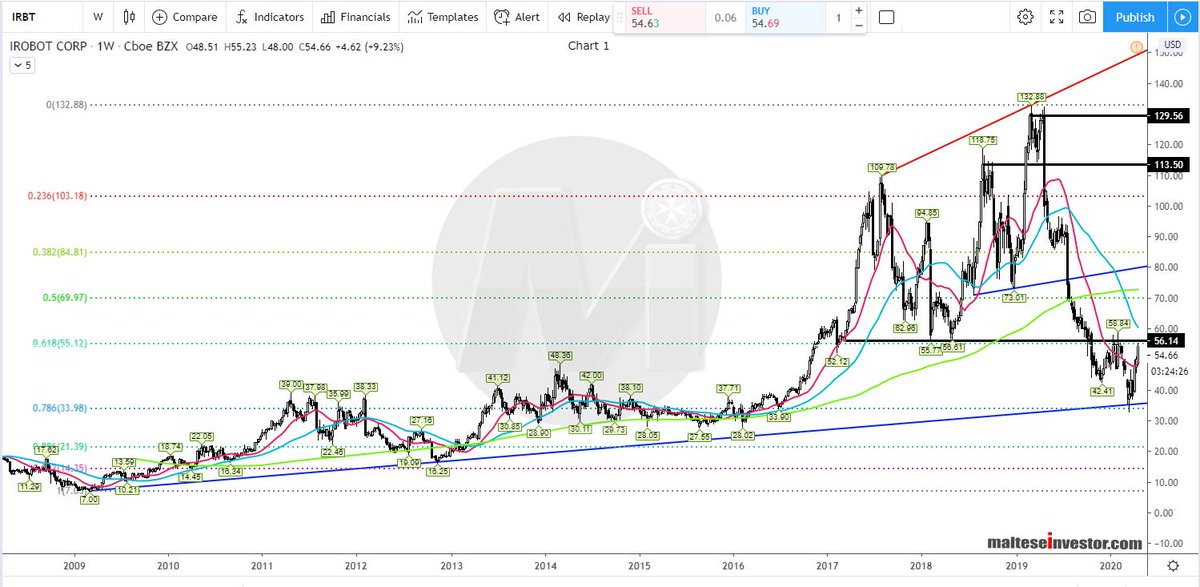
Monthly Chart: Price peaked at 132.88 in March. 2019 and has since then lost 70% of it's value finding #support on the #Fib. 0.786 and longer #trendline support. Conditions are very #bearish, .....
IRBT 2/4
Monthly Chart: Price peaked at 132.88 in March. 2019 and has since then lost 70% of it's value finding #support on the #Fib. 0.786 and longer #trendline support. Conditions are very #bearish, .....
IRBT 2/4
..... #resistances are strong - the #SMA 200 at 72.76, broken trendline at 81.17 and then the unfilled gap. A sustained break and close below 34.00 targets 21.60.
IRBT 3/4
IRBT 3/4
Analysis: #NASDAQ $EBAY
Case 237 #eBay Inc.
DISCLAIMER: The analysis is strictly for educational purposes and should not be construed as an invitation to trade.
#EBAY 1/4
Case 237 #eBay Inc.
DISCLAIMER: The analysis is strictly for educational purposes and should not be construed as an invitation to trade.
#EBAY 1/4

Chart 1
Weekly Chart: The medium term trend is fairly neutral and price only managed to close back above the Oct. 2014 #trendline. The main SMAs are pointing down with #SMA 200 at 34.97. Further up #resistances are noted at 36.91 (#pivot) and then 39.00 (trendline).....
EBAY 2/4
Weekly Chart: The medium term trend is fairly neutral and price only managed to close back above the Oct. 2014 #trendline. The main SMAs are pointing down with #SMA 200 at 34.97. Further up #resistances are noted at 36.91 (#pivot) and then 39.00 (trendline).....
EBAY 2/4
Analysis: #NYSE $AMC
Case 235 #AMC_Entertainment Holdings Inc.
DISCLAIMER: The analysis is strictly for educational purposes and should not be construed as an invitation to trade.
#AMC 1/4
Case 235 #AMC_Entertainment Holdings Inc.
DISCLAIMER: The analysis is strictly for educational purposes and should not be construed as an invitation to trade.
#AMC 1/4

Chart 1
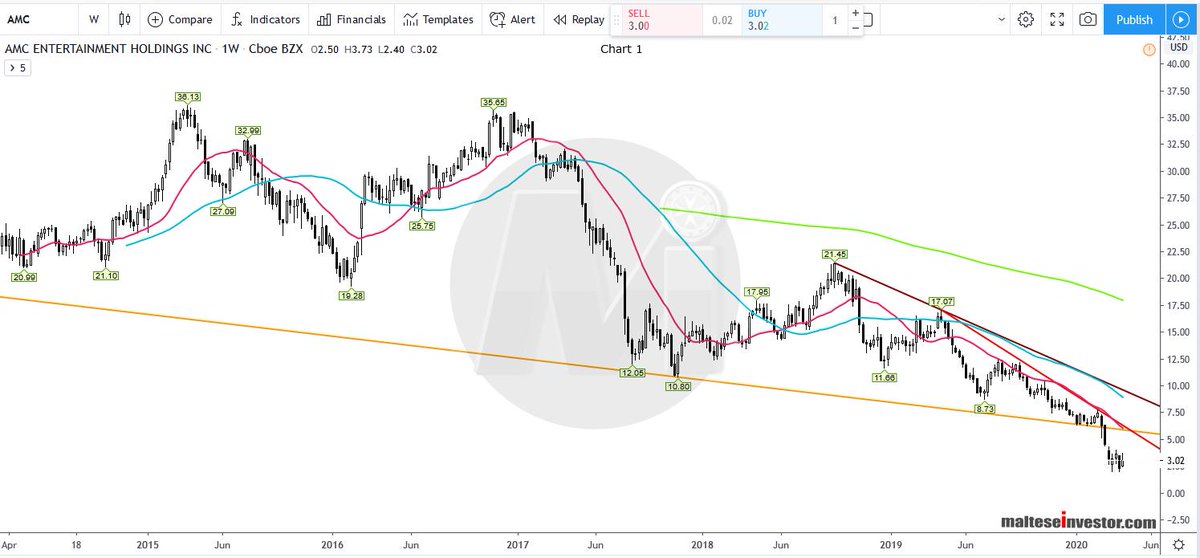
Weekly Chart: #Bearish on all time frames with firm #resistances located between 5.95-9.00. The main #SMAs are all pointing down and expecting to see a new all time low. A break and close below 2.27 will see .....
AMC 2/4
Weekly Chart: #Bearish on all time frames with firm #resistances located between 5.95-9.00. The main #SMAs are all pointing down and expecting to see a new all time low. A break and close below 2.27 will see .....
AMC 2/4
Analysis: #NYSE $DAL
Case 198 #Delta Air Lines Inc.
DISCLAIMER: The analysis is strictly for educational purposes and should not be construed as an invitation to trade.
#DAL 1/4
Case 198 #Delta Air Lines Inc.
DISCLAIMER: The analysis is strictly for educational purposes and should not be construed as an invitation to trade.
#DAL 1/4

Chart 1
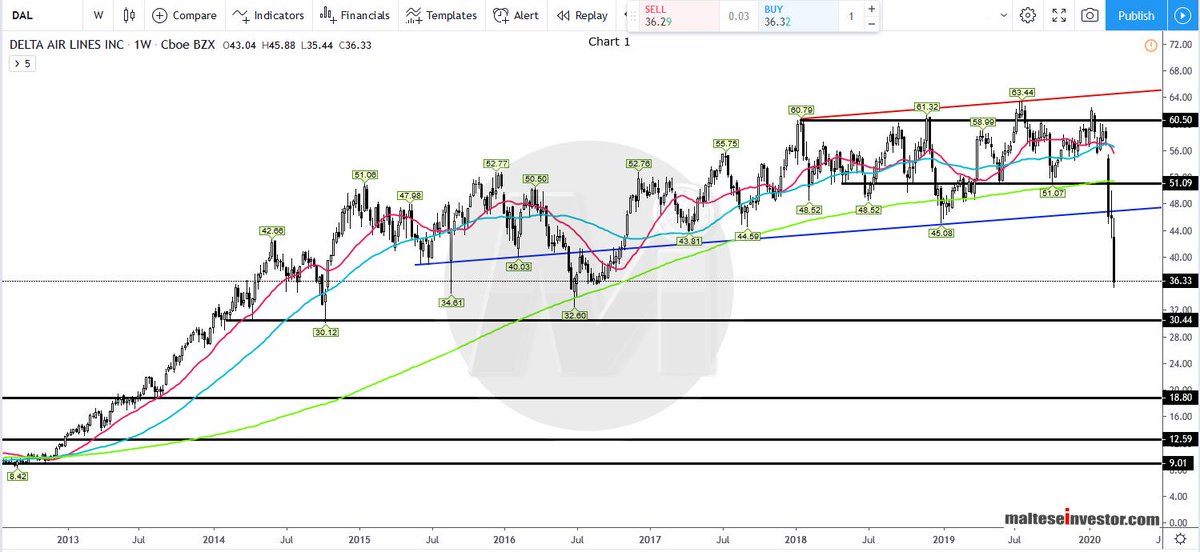
Weekly Chart: Price has broken out of the 3 year trading range to the downside - the loss of 44.57 #support has seen a strong move towards the 36.00 level. We envisage further losses to 30.44 and expect buyers to .....
DAL 2/4
Weekly Chart: Price has broken out of the 3 year trading range to the downside - the loss of 44.57 #support has seen a strong move towards the 36.00 level. We envisage further losses to 30.44 and expect buyers to .....
DAL 2/4
..... temporarily contain the downside. #Resistances are now well established especially at 45.15 - 47.35 and further up 51.10/20.
DAL 3/4
DAL 3/4
Analysis: #NASDAQ $BBBY
Case 192 #Bed_Bath & Beyond Inc.
DISCLAIMER: The analysis is strictly for educational purposes and should not be construed as an invitation to trade.
#BBBY 1/4
Case 192 #Bed_Bath & Beyond Inc.
DISCLAIMER: The analysis is strictly for educational purposes and should not be construed as an invitation to trade.
#BBBY 1/4

Chart 1
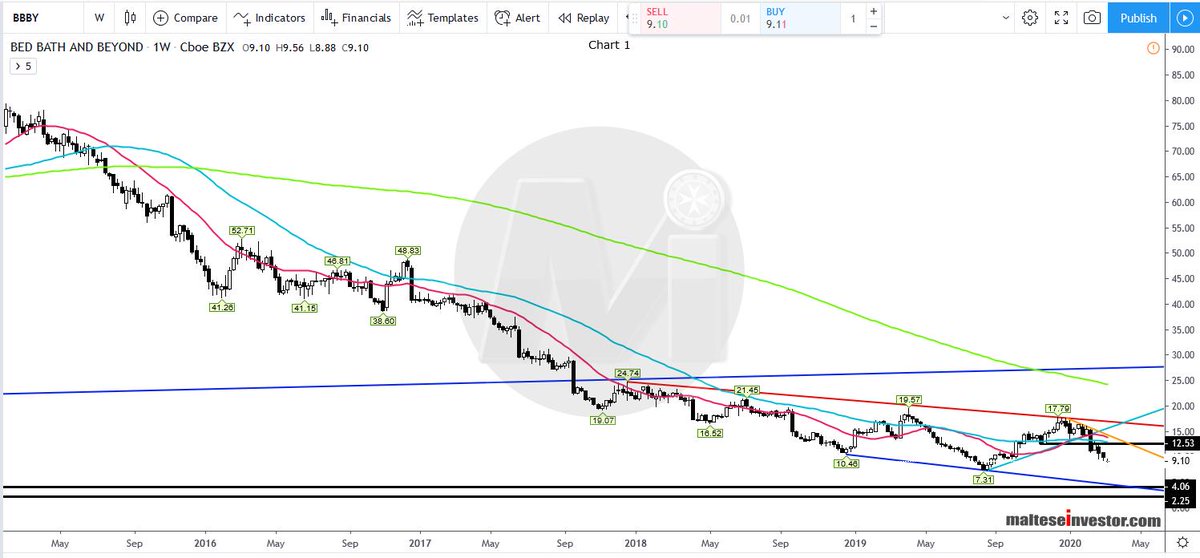
Weekly Chart: The loss of #trendline #support at 14.36 was followed by a gap down to 12.15, buying interest from there has been anemic with sales around 13.00 forcing price lower - the current target is .....
BBBY 2/4
Weekly Chart: The loss of #trendline #support at 14.36 was followed by a gap down to 12.15, buying interest from there has been anemic with sales around 13.00 forcing price lower - the current target is .....
BBBY 2/4
..... 4.40/06. #Resistances at the top are strong and the main #SMAs are all pointing lower.
BBBY 3/4
BBBY 3/4
Analysis: #NYSE $KSS
Case 185 #Kohl's Corporation
DISCLAIMER: The analysis is strictly for educational purposes and should not be construed as an invitation to trade.
#KSS 1/4
Case 185 #Kohl's Corporation
DISCLAIMER: The analysis is strictly for educational purposes and should not be construed as an invitation to trade.
#KSS 1/4

Chart 1
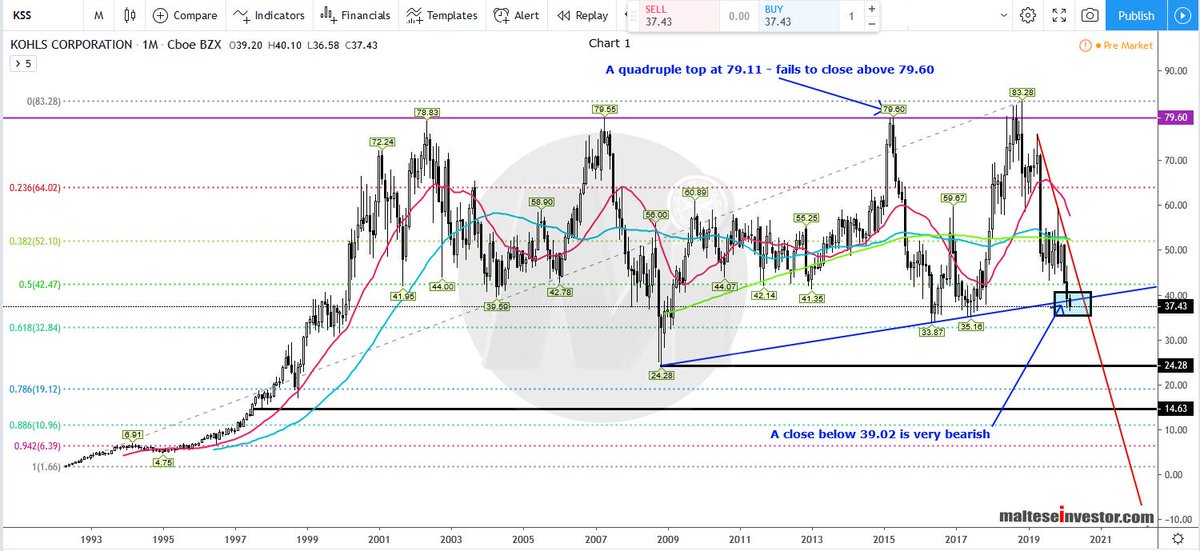
Monthly Chart: Price failed to close above 79.60 for a fourth time and has since come crashing down breaking the monthly #trendline - a close below 39.02 is very #bearish and will eventually .....
KSS 2/4
Monthly Chart: Price failed to close above 79.60 for a fourth time and has since come crashing down breaking the monthly #trendline - a close below 39.02 is very #bearish and will eventually .....
KSS 2/4
..... target 24.28 and possibly 19.15. To the upside #resistances are strong and layered beginning at 42.90 then 50.25 and 54.30/55.
KSS 3/4
KSS 3/4
Analysis: #NYSE $VLO
Case 184 #Valero Energy Corporation
DISCLAIMER: The analysis is strictly for educational purposes and should not be construed as an invitation to trade.
#VLO 1/4
Case 184 #Valero Energy Corporation
DISCLAIMER: The analysis is strictly for educational purposes and should not be construed as an invitation to trade.
#VLO 1/4

Chart 1
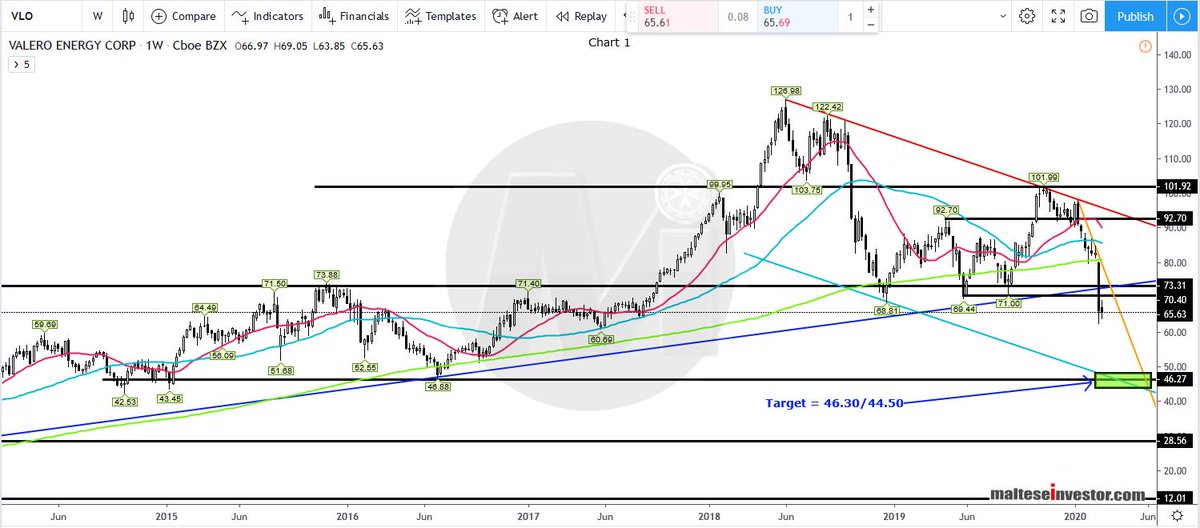
Weekly Chart: Medium term #support at 70.40 has been lost and with it the long term 2012 #trendline. Price is currently trading below the 2019 low - the next target is 52.55 then the 46.30-44.50 support .....
VLO 2/4
Weekly Chart: Medium term #support at 70.40 has been lost and with it the long term 2012 #trendline. Price is currently trading below the 2019 low - the next target is 52.55 then the 46.30-44.50 support .....
VLO 2/4
..... zone where we expect buyers to be positioned and below at 38.95/15. To the upside #resistances are stacked and formidable beginning at 72.45-73.30 then 78.50-79.80.
VLO 3/4
VLO 3/4
Analysis: #NYSE $WWE
Case 151 #World_Wrestling_Entertainment, Inc.
DISCLAIMER: The analysis is strictly for educational purposes and should not be construed as an invitation to trade.
Thread 👇👇👇
#WWE 1/3
Case 151 #World_Wrestling_Entertainment, Inc.
DISCLAIMER: The analysis is strictly for educational purposes and should not be construed as an invitation to trade.
Thread 👇👇👇
#WWE 1/3

Chart 1
Weekly Chart: #Bearish in the short and long term and expecting further losses towards 30.90 - 29.50. To the upside #resistances are firm with the #Fib. 0.618 at 44.44 and #SMA 200 at 46.78 and further above 50.96 broken trendline #support.
WWE 2/3
Weekly Chart: #Bearish in the short and long term and expecting further losses towards 30.90 - 29.50. To the upside #resistances are firm with the #Fib. 0.618 at 44.44 and #SMA 200 at 46.78 and further above 50.96 broken trendline #support.
WWE 2/3
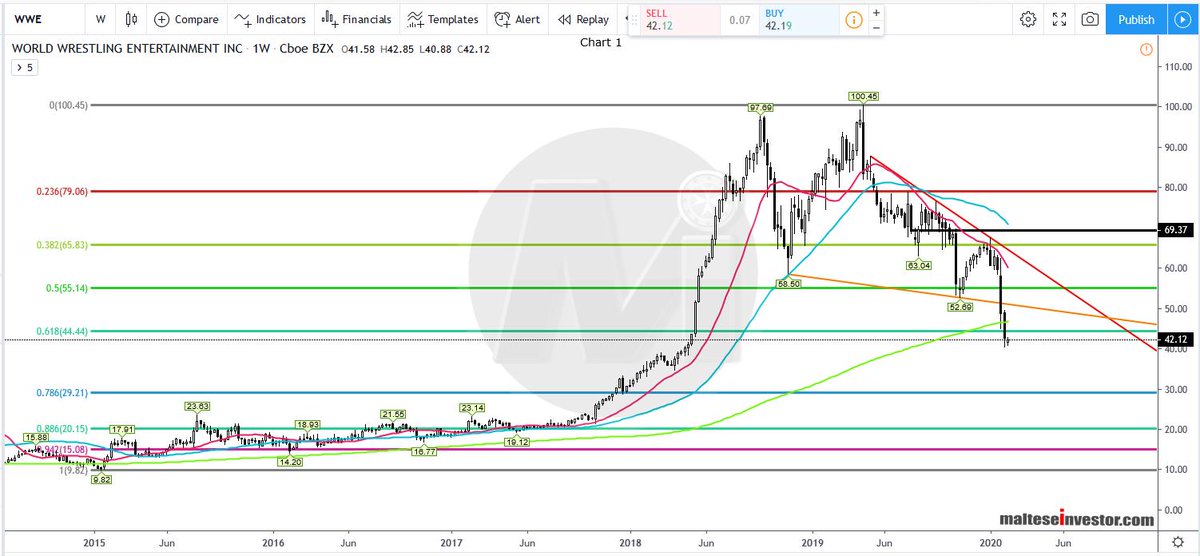
Chart 2
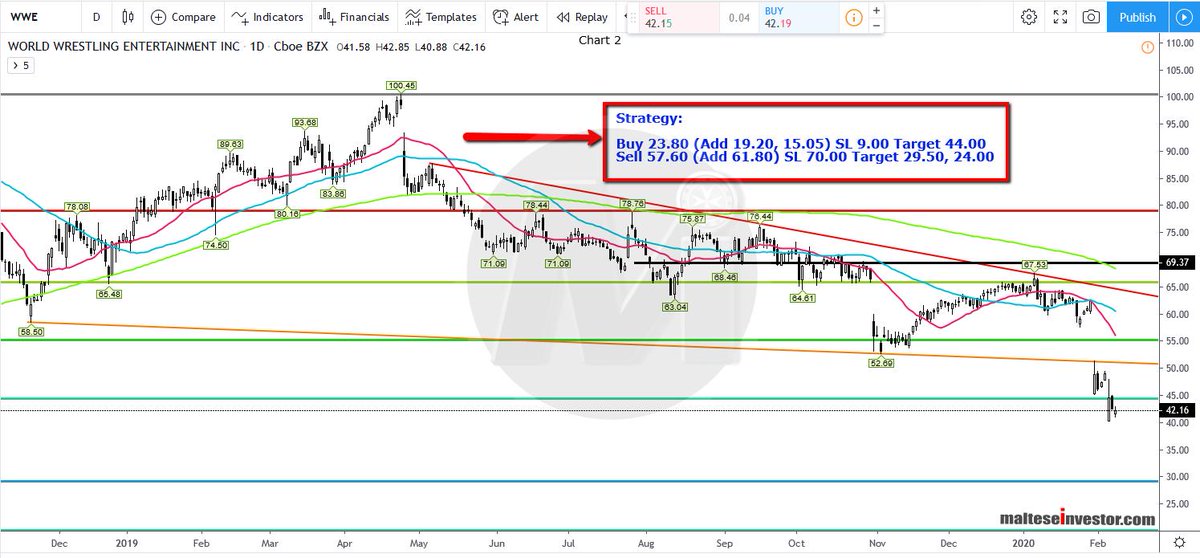
Daily Chart : An unfilled gap (60.08 - 51.33) exists with #trendline resistance at 64.65. The main SMAs are bearish.
The #Strategy is printed on the image.
$WWE 3/3
Daily Chart : An unfilled gap (60.08 - 51.33) exists with #trendline resistance at 64.65. The main SMAs are bearish.
The #Strategy is printed on the image.
$WWE 3/3
Analysis: #NYSE $XOM
Case 139 #Exxon Mobil Corporation
DISCLAIMER: The analysis is strictly for educational purposes and should not be construed as an invitation to trade.
Thread 👇👇👇
#XOM 1/4
Case 139 #Exxon Mobil Corporation
DISCLAIMER: The analysis is strictly for educational purposes and should not be construed as an invitation to trade.
Thread 👇👇👇
#XOM 1/4

Chart 1
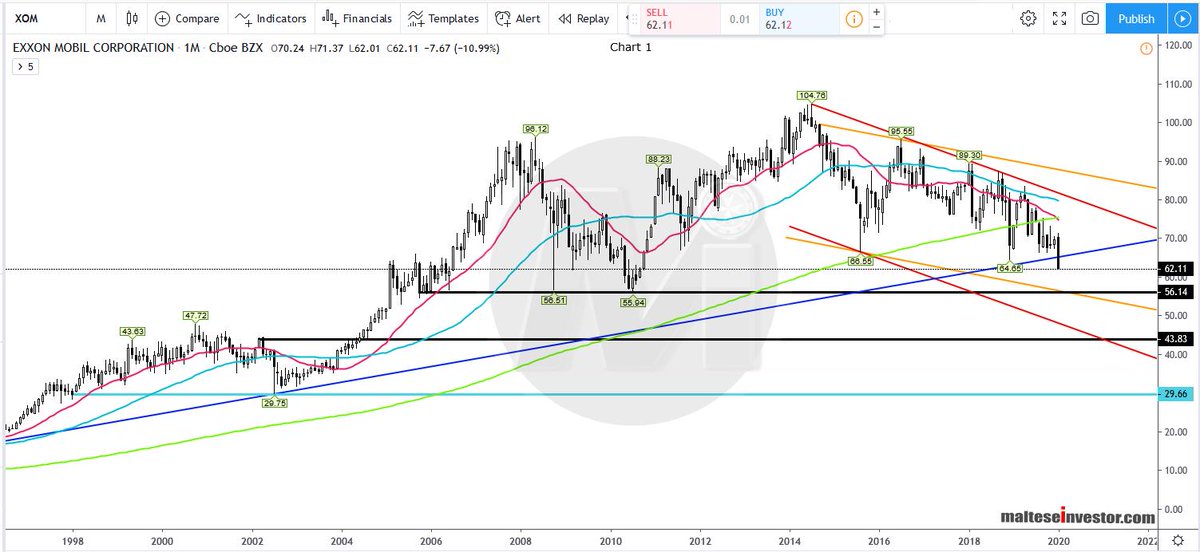
Monthly Chart: Following on from the close below 67.00 Exxon is now very #bearish and should be heading towards 56.14 - a monthly close below this level will leave price targeting the .....
XOM 2/4
Monthly Chart: Following on from the close below 67.00 Exxon is now very #bearish and should be heading towards 56.14 - a monthly close below this level will leave price targeting the .....
XOM 2/4
..... vacuum at 51.55 then 45.80-43.80. To the upside #resistances are now very clear beginning from 67.00 all the way to 76.00. The monthly #SMA 20 cut below to SMA 200 at 75.25.
XOM 3/4
XOM 3/4
Analysis: #NASDAQ $VIAC
Case 127 #ViacomCBS Inc
DISCLAIMER: The analysis is strictly for educational purposes and should not be construed as an invitation to trade.
Thread 👇👇👇
#VIAC 1/4
Case 127 #ViacomCBS Inc
DISCLAIMER: The analysis is strictly for educational purposes and should not be construed as an invitation to trade.
Thread 👇👇👇
#VIAC 1/4

Chart 1
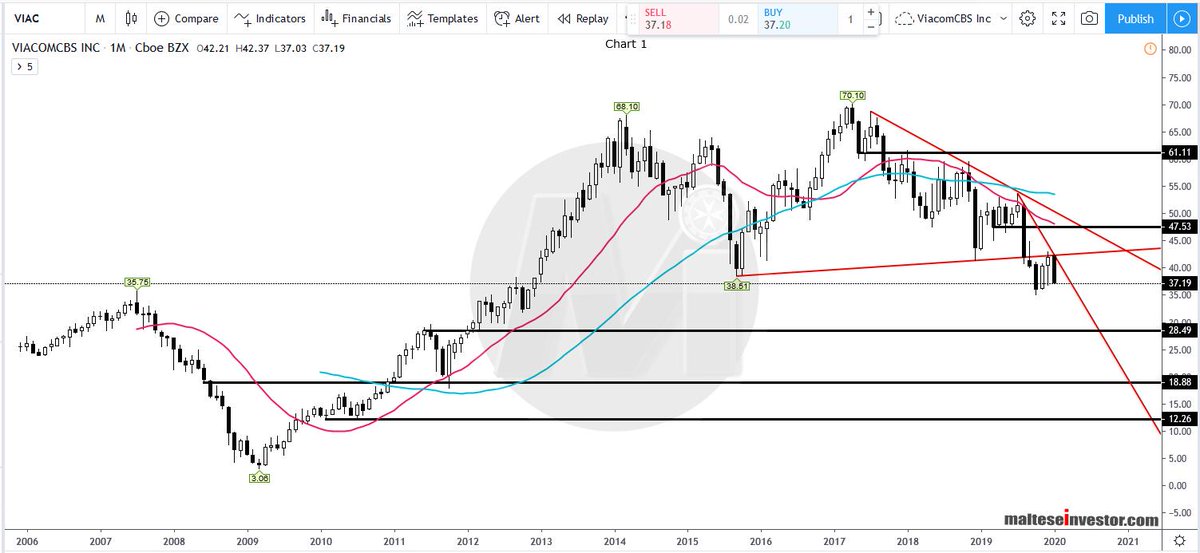
Monthly Chart: The long term #support at 41.36 finally gave way in Sept. 2019. Some mild support seen 32.15-31.85 but we expect this zone to be flimsy and price should head towards 28.50-26.95 and a ......
VIAC 2/4
Monthly Chart: The long term #support at 41.36 finally gave way in Sept. 2019. Some mild support seen 32.15-31.85 but we expect this zone to be flimsy and price should head towards 28.50-26.95 and a ......
VIAC 2/4
..... break of the latter could see price quickly fall to 18.90. To the upside #resistances are formidable. The #SMAs are negative pointing to further losses.
VIAC 3/4
VIAC 3/4
Analysis: #NYSE $CCL
Case 122 #Carnival Corporation & Plc
DISCLAIMER: The analysis is strictly for educational purposes and should not be construed as an invitation to trade.
Thread 👇👇👇
#CCL 1/4
Case 122 #Carnival Corporation & Plc
DISCLAIMER: The analysis is strictly for educational purposes and should not be construed as an invitation to trade.
Thread 👇👇👇
#CCL 1/4

Chart 1
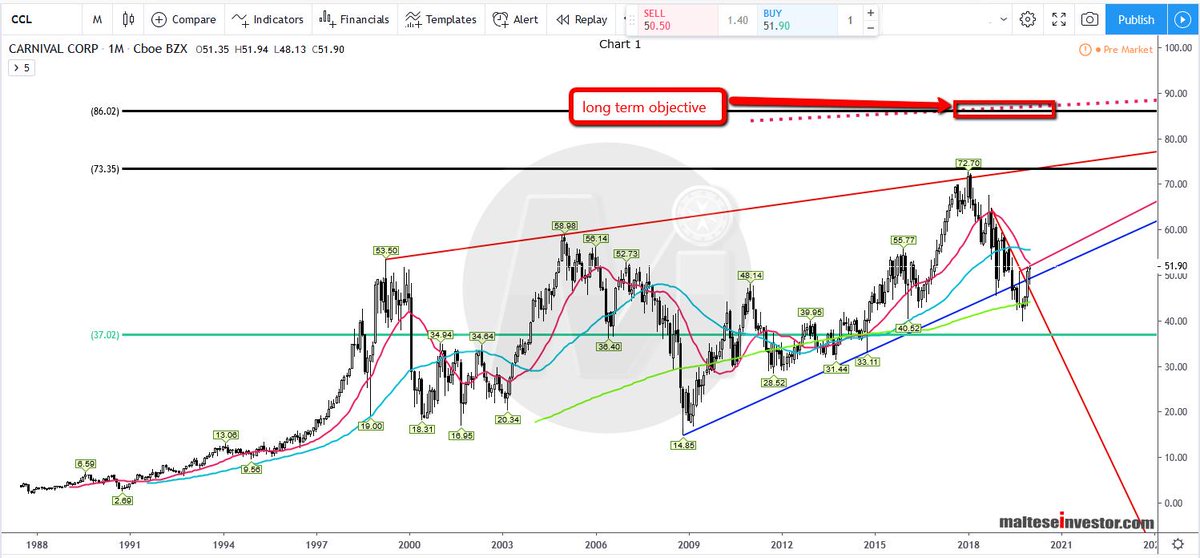
Monthly Chart: The 10 year #trend peaked at 72.70 and this was followed up by a large correction taking price to 39.75. The sloping 2018 #trendline has been broken and price is .....
CCL 2/4
Monthly Chart: The 10 year #trend peaked at 72.70 and this was followed up by a large correction taking price to 39.75. The sloping 2018 #trendline has been broken and price is .....
CCL 2/4
..... turning #bullish again but for the moment underpinned by #resistances around 55.60-56.15 (#pivot, #SMAs)
CCL 3/4
CCL 3/4
Analysis: #NYSE $IBM
Case 116 #International_Business_Machines Corporation
DISCLAIMER: The analysis is strictly for educational purposes and should not be construed as an invitation to trade.
Thread 👇👇👇
#IBM 1/4
Case 116 #International_Business_Machines Corporation
DISCLAIMER: The analysis is strictly for educational purposes and should not be construed as an invitation to trade.
Thread 👇👇👇
#IBM 1/4

Chart 1
Monthly Chart: Ever since peaking at 215.90 in March 2013, IBM has lost half its value but found #support on the 26 year #trendline. #Resistances above are tough and upside moves are quickly stifled by .....
IBM 2/4
Monthly Chart: Ever since peaking at 215.90 in March 2013, IBM has lost half its value but found #support on the 26 year #trendline. #Resistances above are tough and upside moves are quickly stifled by .....
IBM 2/4
Analysis: #NYSE $CTST
Case 1101 #CannTrust Holdings Inc
DISCLAIMER: The analysis is strictly for educational purposes and should not be construed as an invitation to trade.
Thread 👇👇👇
#CTST 1/4
Case 1101 #CannTrust Holdings Inc
DISCLAIMER: The analysis is strictly for educational purposes and should not be construed as an invitation to trade.
Thread 👇👇👇
#CTST 1/4

Chart 1
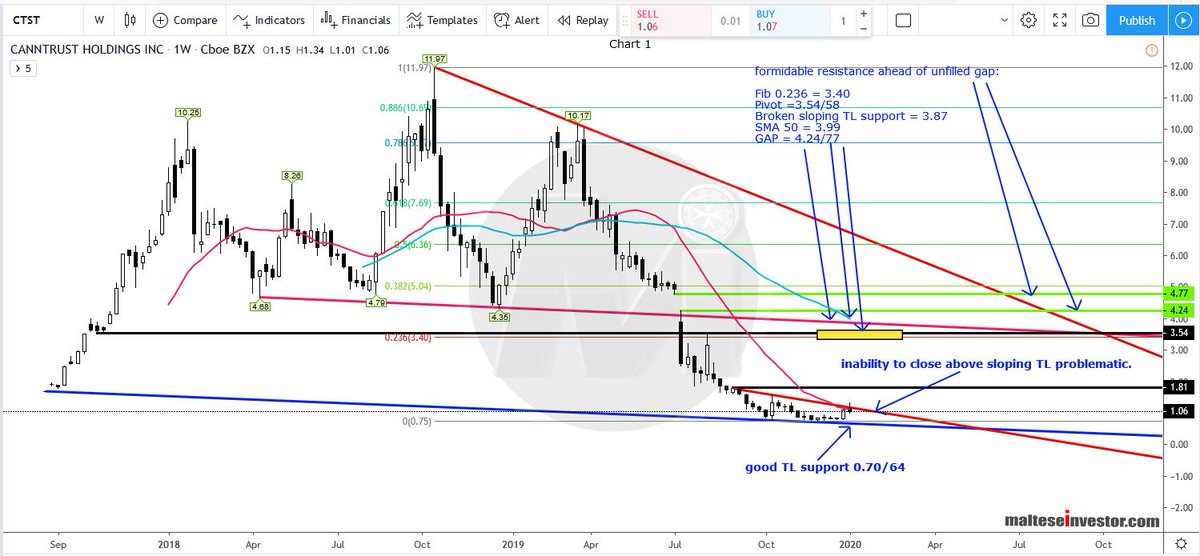
Weekly Chart: Although a low of 0.75 has been recorded followed by a rise to 1.34 we remain unconvinced that the worst is over and envisage possible downside probes towards 0.70/64 where we expect better buying interest.
#Resistances are loaded at the ....
CTST 2/4
Weekly Chart: Although a low of 0.75 has been recorded followed by a rise to 1.34 we remain unconvinced that the worst is over and envisage possible downside probes towards 0.70/64 where we expect better buying interest.
#Resistances are loaded at the ....
CTST 2/4
Analysis: #NASDAQ $VERU
Case 69 #Veru Inc
DISCLAIMER: The analysis is strictly for educational purposes and should not be construed as an invitation to trade.
:::::::::::::::::: By Special Request ::::::::::::::::::
Thread 👇👇👇
#VERU 1/6
Case 69 #Veru Inc
DISCLAIMER: The analysis is strictly for educational purposes and should not be construed as an invitation to trade.
:::::::::::::::::: By Special Request ::::::::::::::::::
Thread 👇👇👇
#VERU 1/6

Ever since peaking at 10.01 in June 2013 all gains were wiped out reaching a low of 0.72 in October 2016. Since then it's been trading in a $2 range and attempting to form a base.
VERU 2/6
VERU 2/6


