Discover and read the best of Twitter Threads about #Quarto
Most recents (7)
[1/8] 📚 Introducing #Quarto: A Versatile, New and Exciting Publishing Tool! 🌟
Quarto is a powerful, open-source, and user-friendly publishing framework that streamlines the process of creating beautiful books, documents, and websites. Let’s explore it now!
#RStats #DataScience
Quarto is a powerful, open-source, and user-friendly publishing framework that streamlines the process of creating beautiful books, documents, and websites. Let’s explore it now!
#RStats #DataScience

[2/8] 🤓 Language Agnostic: Quarto works seamlessly with multiple languages, including #Markdown, #LaTeX, #RMarkdown, and #Jupyter notebooks. So, whether you're a researcher or a creative writer, Quarto has you covered! 🌍
#DataScience #RStats
#DataScience #RStats
[3/8] 🔁 Format Flexibility: With Quarto, you can convert your content into various formats, such as PDF, HTML, EPUB, and even slide presentations. It makes sharing your work with diverse audiences a breeze! 🌬️
#RStats #DataScience
#RStats #DataScience
Leopards are free. That is good. However EU has more weapons in its disposal. Trade with Russia is one of them. Let us have a look at trade data from Eurostat to see what effect Russia's war on Ukraine had on EU trade. A thread 1/
💥14 herramientas secretas impulsadas por #RStats para ahorrar tiempo y esfuerzo en tus proyectos de datos (¡No te lo pierdas!):👀
1️⃣ ¡Edita tus datos de forma interactiva (y guarda el código)! 👀
📦 'editData' es un complemento de RStudio para editar un data.frame o un tibble de forma interactiva
🔗 buff.ly/3U5Tgjy
#DataScience #DataVisualization #dataviz #stats #analytics #RStats #Analytics
📦 'editData' es un complemento de RStudio para editar un data.frame o un tibble de forma interactiva
🔗 buff.ly/3U5Tgjy
#DataScience #DataVisualization #dataviz #stats #analytics #RStats #Analytics
2️⃣ ¡Crea gráficos #ggplot de forma interactiva!🚀
📦esquisse es otro de mis addins favoritos de #rstudio
✅ exporta el gráfico o recupera el código para reproducir el gráfico
🔗 buff.ly/3mxLHSo
#DataScience #DataVisualization #dataviz #stats #analytics #RStats #Analytics
📦esquisse es otro de mis addins favoritos de #rstudio
✅ exporta el gráfico o recupera el código para reproducir el gráfico
🔗 buff.ly/3mxLHSo
#DataScience #DataVisualization #dataviz #stats #analytics #RStats #Analytics
I taught two 8-wk courses this fall @JohnsHopkinsSPH and wanted to share the resources (built in #quarto!) in case others starting in #Rstats #DataScience find it useful
🤩 Intro to R
stephaniehicks.com/jhustatcomputi…
💃 More adv R #Git #CommandLine #SQL #APIs
stephaniehicks.com/jhustatprogram…

🤩 Intro to R
stephaniehicks.com/jhustatcomputi…
💃 More adv R #Git #CommandLine #SQL #APIs
stephaniehicks.com/jhustatprogram…


I want to say THANK YOU to all the individuals who wrote such great blog posts or vignettes about #rstats pkgs, the @thecarpentries for developing 🤩 material on #CommandLine and #Git, and @rdpeng who help develop much of the content from 1st class!
You are the true heros.
You are the true heros.
Day 6: Our @quarto_pub parameterised celebration of #RLadies working with the #NHS
I was keen to do something to celebrate the folks who use #rstats behind the scenes in the #NHS - building something with R to do so felt fitting!
Plus, I learnt more #quarto in the process!
I was keen to do something to celebrate the folks who use #rstats behind the scenes in the #NHS - building something with R to do so felt fitting!
Plus, I learnt more #quarto in the process!
@quarto_pub First step for me in doing something like this: Figma. It's a really useful tool for playing around with a layout before you try to implement it in code.
Here's the basic layout I built to figure out where everything should go.
Here's the basic layout I built to figure out where everything should go.

@quarto_pub Next, fonts. For this one, I was looking for something that says "I know what I'm doing but I'm also approachable" as that was the vibe I got from folks at the @NHSrCommunity a few weeks ago.
I went with Nunito Sans, and found a "slab" font with a similar shape: Zilla Slab.
I went with Nunito Sans, and found a "slab" font with a similar shape: Zilla Slab.
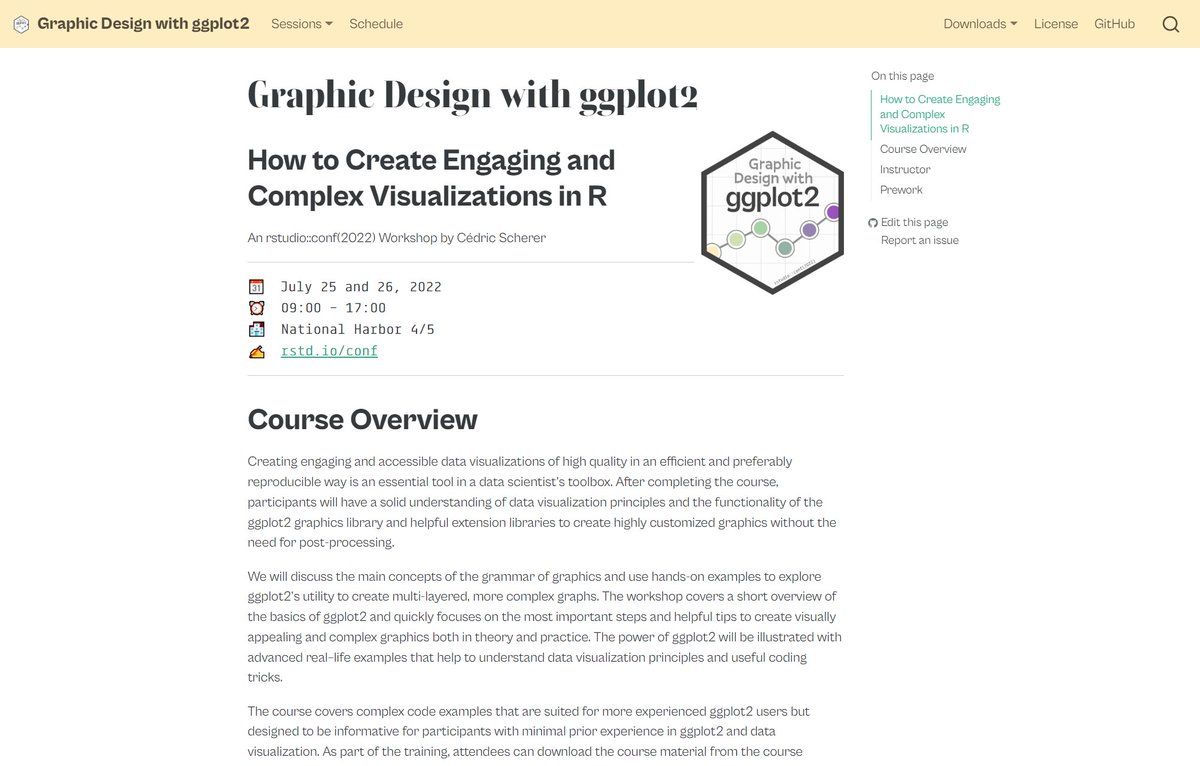
"Graphic Design with #ggplot2" 👨💼👩💻🧑💻
Do you want to recap the 2-day workshop at #rstudioconf? Or do you feel sad you've missed it?
🔥 All course material incl. latest updates can be found on the workshop webpage—9 sessions, 760 slides, 314 ggplots!
👉 rstudio-conf-2022.github.io/ggplot2-graphi…


Do you want to recap the 2-day workshop at #rstudioconf? Or do you feel sad you've missed it?
🔥 All course material incl. latest updates can be found on the workshop webpage—9 sessions, 760 slides, 314 ggplots!
👉 rstudio-conf-2022.github.io/ggplot2-graphi…


@rstudio The session pages contain not only the slides but
🔵 hands-on #rstats codes
🔵 recap notes
🔵 exercises incl.
🔵 prepared scripts, either as #quarto or #rmarkdown
🔵 step-by-step solutions
➕ all source codes on GitHub:


🔵 hands-on #rstats codes
🔵 recap notes
🔵 exercises incl.
🔵 prepared scripts, either as #quarto or #rmarkdown
🔵 step-by-step solutions
➕ all source codes on GitHub:


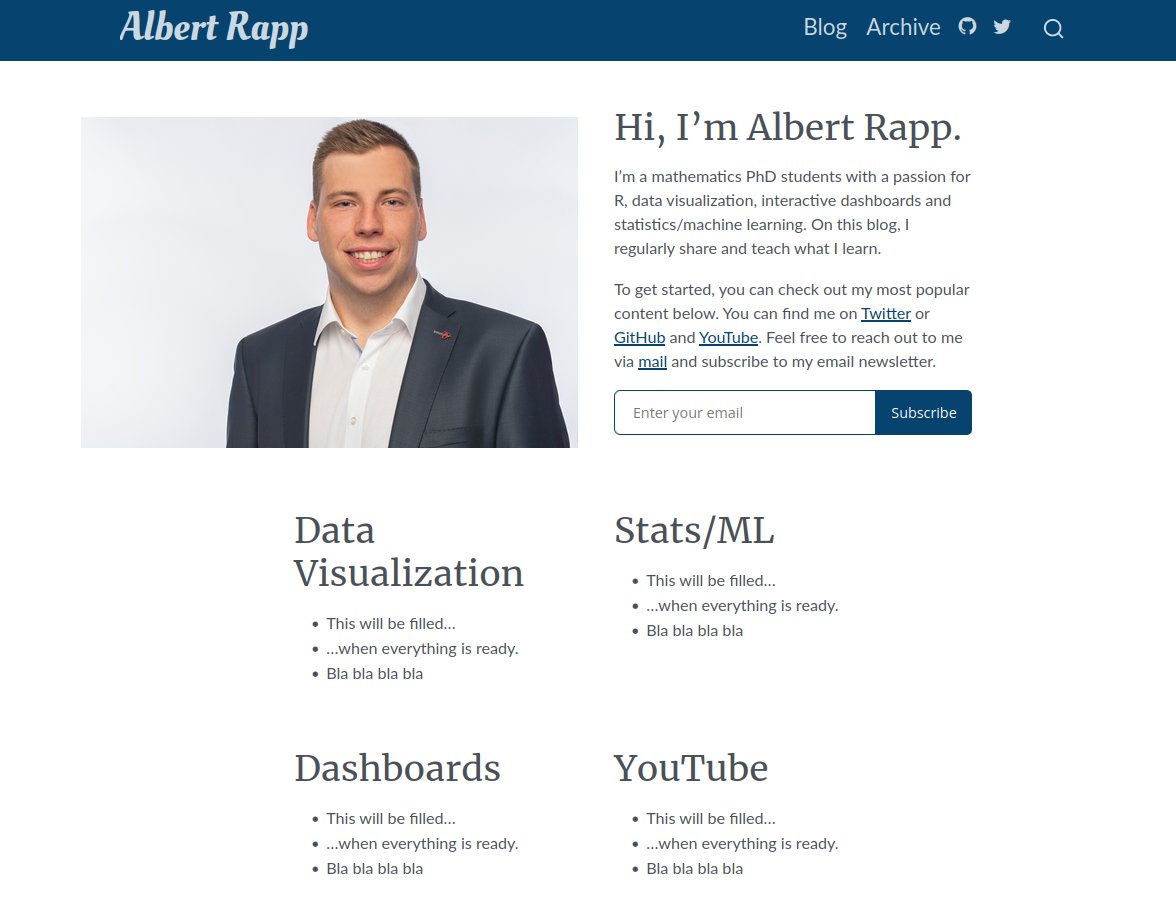
I am rebuilding my #rstats blog from the bottom up with #quarto. This will let me use quarto's cool new tricks like tabs and easy columns.
I've already spent hours using quarto's great docs to build a custom blog. If you want to do the same, let me show you what I did.

I've already spent hours using quarto's great docs to build a custom blog. If you want to do the same, let me show you what I did.


Today, I will show you the first of many steps to your own quarto blog. First, create a new quarto blog project via RStudio.
Make sure to create a git repo as well. This lets you revert changes when you break your blog. You can follow along my repo at github.com/AlbertRapp/qua…
Make sure to create a git repo as well. This lets you revert changes when you break your blog. You can follow along my repo at github.com/AlbertRapp/qua…


