Discover and read the best of Twitter Threads about #Powerbi
Most recents (24)
A few days back, 2 Data Analyst newbies showed me mistakes they encountered during their analysis process. It dawned on me that lots of times, we don't diligently follow through the data analysis process, especially the cleaning phase.
In this short🧵, I break down this process.
In this short🧵, I break down this process.

PHASE 1: ASK QUESTIONS
The first step in the analysis process is to formulate a problem to solve or a question to answer, such as: are customers aged 21 to 30 more likely to churn than customers aged 41 to 50? As analysts, we must be very curious, we must ASK QUESTIONS!
The first step in the analysis process is to formulate a problem to solve or a question to answer, such as: are customers aged 21 to 30 more likely to churn than customers aged 41 to 50? As analysts, we must be very curious, we must ASK QUESTIONS!
PHASE 2: Collect & Store Data
Next, we need to collect and store the necessary data, which could require the use of a database or a spreadsheet. For large datasets, we store them in a database. For datasets shy of a million records, spreadsheet software like Excel can be used.
Next, we need to collect and store the necessary data, which could require the use of a database or a spreadsheet. For large datasets, we store them in a database. For datasets shy of a million records, spreadsheet software like Excel can be used.
87% of data science projects fail.
One reason is the lack of production.
Here's an easy solution. 🧵
#datascience #python #R #rstats #career
One reason is the lack of production.
Here's an easy solution. 🧵
#datascience #python #R #rstats #career

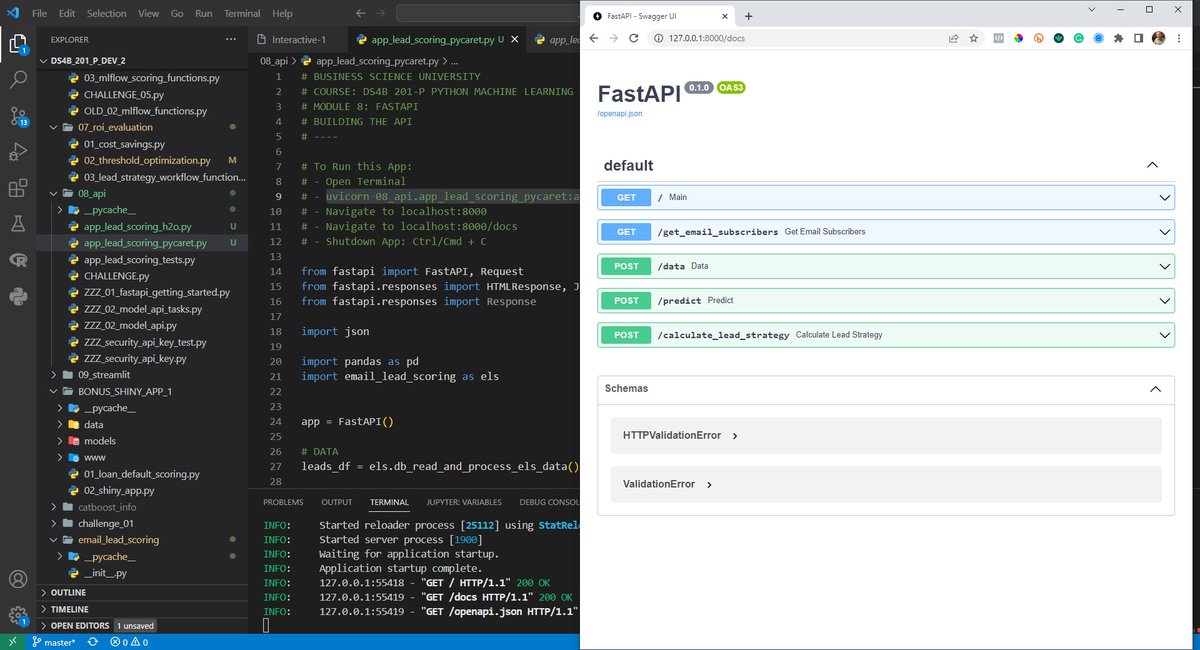
This is called an #API (Application Programming Interface). 

An API allows the user to make requests using a tool they are comfortable with.
The API runs a program that the data scientist has created on the server.
And the API returns a result.
The API runs a program that the data scientist has created on the server.
And the API returns a result.
Hey folks, let's talk about one of the most important concepts in Power BI that you won't want to filter out: FILTER CONTEXT! 😎
Filter context is like a bouncer at a club - it determines which data gets in and which data gets kicked out. 🕺
For example, if you want to know the total profit for a specific month, you need to create filter context by selecting the month you want to see. 📅
1/ Curious about the power duo of #PowerBI - Measures and Calculated Columns? Let's break down when to use each and why they're essential in your data analysis toolkit! 📊🧵 

2/ 𝐌𝐞𝐚𝐬𝐮𝐫𝐞𝐬: These dynamic calculations evaluate based on the context of the visualization. They're flexible and change according to the filters and slicers you apply. Ideal for real-time calculations that shift with user interactions. 🔄
3/ 𝐂𝐚𝐥𝐜𝐮𝐥𝐚𝐭𝐞𝐝 𝐂𝐨𝐥𝐮𝐦𝐧𝐬: These static calculations apply to each row of data in your table. Think of them as formulas baked into your data—perfect for complex logic that you want to reuse across multiple visualizations. 🧩
Data Visualization is a great-to-have skill as a Data Analyst.
📊Here are free resources to learn PowerBi (thread includes exercises to test your knowledge and a project to showcase what you have learnt):
📊Here are free resources to learn PowerBi (thread includes exercises to test your knowledge and a project to showcase what you have learnt):
1. Introduction to PowerBI:
training.foresightbi.com.ng/courses/take/I…
2. Ultimate Beginner’s guide to DAX:
youtube.com/playlist?list=…
3. Mastering DAX Foundations:
training.foresightbi.com.ng/courses/take/m…
4. PowerBi Virtual Internship:
theforage.com/virtual-intern…
training.foresightbi.com.ng/courses/take/I…
2. Ultimate Beginner’s guide to DAX:
youtube.com/playlist?list=…
3. Mastering DAX Foundations:
training.foresightbi.com.ng/courses/take/m…
4. PowerBi Virtual Internship:
theforage.com/virtual-intern…
5. End to End Project - PowerBi:
6. LinkedIn Skill Assessment Test:
linkedin.com/skill-assessme…
#PowerBI
6. LinkedIn Skill Assessment Test:
linkedin.com/skill-assessme…
#PowerBI
The model will not perform well if training data is small, or noisy with errors outlier or if #data is not representative consist of irrelevant feature(garbage in garbage out) lastly neither too simple(result in #underfitting) nor too complex(results in #overfitting
#DataScience
#DataScience

Not enough training data.
Poor Quality of data.
Irrelevant features.
Nonrepresentative training data.
Overfitting and Underfitting.
#DataCleaningchallenge #MachineLearning #Deeplearning #DataAnalytics #DataVisualization #Python #Powerbi #SQL #MYSQL
analyticsvidhya.com/blog/2021/06/5…
Poor Quality of data.
Irrelevant features.
Nonrepresentative training data.
Overfitting and Underfitting.
#DataCleaningchallenge #MachineLearning #Deeplearning #DataAnalytics #DataVisualization #Python #Powerbi #SQL #MYSQL
analyticsvidhya.com/blog/2021/06/5…
How should you 𝐥𝐞𝐚𝐫𝐧 𝐏𝐨𝐰𝐞𝐫 𝐁𝐈? 🚀
🧵
🧵
It's easy to be overwhelmed by how broad #PowerBI is😖
If you're starting out, here's the path I recommend⏬
If you're starting out, here's the path I recommend⏬
📊 𝐃𝐚𝐭𝐚 𝐌𝐨𝐝𝐞𝐥𝐢𝐧𝐠
Begin by learning to organize data into tables, create relationships, and add calculated columns and measures.
This is the most important part of your journey, as understanding the #data is always the first step in Power BI development.
Begin by learning to organize data into tables, create relationships, and add calculated columns and measures.
This is the most important part of your journey, as understanding the #data is always the first step in Power BI development.
🚀 You can become a data analyst in 90 days without spending a cent! Yes, you heard that right.
With the right approach and dedication, anyone can become a #dataanalyst . Here are the steps to follow( Make sure the order is maintained)
🧵
With the right approach and dedication, anyone can become a #dataanalyst . Here are the steps to follow( Make sure the order is maintained)
🧵
⚠ Today I Made a Awesome #America Retail Analysis Dashboard
🎇 The beauty of Power BI is that you can look at each element to make better #decisions. The #dashboard's visual representation allows users to quickly see the #data that's relevant for the choices they have to make
🎇 The beauty of Power BI is that you can look at each element to make better #decisions. The #dashboard's visual representation allows users to quickly see the #data that's relevant for the choices they have to make
🔥Then, define clear objectives to ensure that the dashboard accurately reflects your desired outcomes. 👇
#PowerBI #100DaysOfCode #100daysofcodechallenge #Data #100daysofcoding #developer #DataScience #dataScientist #DataAnalytics #excel #SQL #tableau #visualization #Dashboard
#PowerBI #100DaysOfCode #100daysofcodechallenge #Data #100daysofcoding #developer #DataScience #dataScientist #DataAnalytics #excel #SQL #tableau #visualization #Dashboard
In love with Power BI! 😍✨
Power BI is a data analytics tool, and the fact that you can connect it with any data source, transform, manipulate and visualize your data all in one place is really great!
Important things you need to know about creating a data model in Power BI🧵
Power BI is a data analytics tool, and the fact that you can connect it with any data source, transform, manipulate and visualize your data all in one place is really great!
Important things you need to know about creating a data model in Power BI🧵
Before you understand how creating a data model works in Power BI, first you need to understand what kind of tables you need to have in your data model.
There are two types of tables that enables you to create a data model in Power BI and they are Fact Table and Dimension tables
There are two types of tables that enables you to create a data model in Power BI and they are Fact Table and Dimension tables
✨ Fact tables: Fact tables contain observational or event data values which can be sales orders, product counts, transactional dates and times and quantities. Fact table can contain several repeated values.
E.g repeating customer IDs in the Customer ID column.
E.g repeating customer IDs in the Customer ID column.
💥14 herramientas secretas impulsadas por #RStats para ahorrar tiempo y esfuerzo en tus proyectos de datos (¡No te lo pierdas!):👀
1️⃣ ¡Edita tus datos de forma interactiva (y guarda el código)! 👀
📦 'editData' es un complemento de RStudio para editar un data.frame o un tibble de forma interactiva
🔗 buff.ly/3U5Tgjy
#DataScience #DataVisualization #dataviz #stats #analytics #RStats #Analytics
📦 'editData' es un complemento de RStudio para editar un data.frame o un tibble de forma interactiva
🔗 buff.ly/3U5Tgjy
#DataScience #DataVisualization #dataviz #stats #analytics #RStats #Analytics
2️⃣ ¡Crea gráficos #ggplot de forma interactiva!🚀
📦esquisse es otro de mis addins favoritos de #rstudio
✅ exporta el gráfico o recupera el código para reproducir el gráfico
🔗 buff.ly/3mxLHSo
#DataScience #DataVisualization #dataviz #stats #analytics #RStats #Analytics
📦esquisse es otro de mis addins favoritos de #rstudio
✅ exporta el gráfico o recupera el código para reproducir el gráfico
🔗 buff.ly/3mxLHSo
#DataScience #DataVisualization #dataviz #stats #analytics #RStats #Analytics
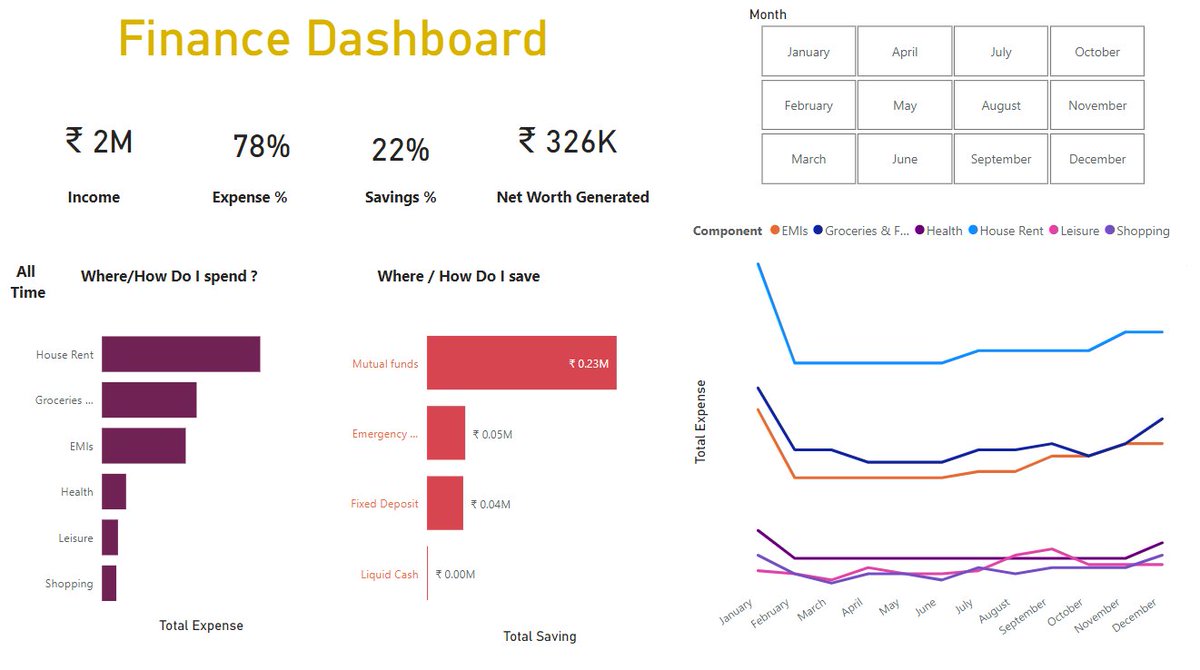
⚠ Today I Made a Awesome Finance Dashboard
🔰 ---> 𝐁𝐢𝐠 𝐒alute 𝐭𝐨 @codebasicshub for providing such a Great Content
#powerbijobs #powerbidevelopers #powerbihiring #Powerbibysk #datascience #dataanalytics #data #portfolio #GITHUB
🔰 ---> 𝐁𝐢𝐠 𝐒alute 𝐭𝐨 @codebasicshub for providing such a Great Content
#powerbijobs #powerbidevelopers #powerbihiring #Powerbibysk #datascience #dataanalytics #data #portfolio #GITHUB

📢 Github Project Link -lnkd.in/dNhVbYkJ ( Request to every learners to must check for Complete Dashboards related Data )
Q17 ) In problem where we need to find player with no of gold medals won by them only for players who won only gold medals.?
Q16 ) Write an SQL query to report all customers who never order anything.
Return the result table in any order.
Return the result table in any order.
Hey Folks 😃
📗Here are my Last 15 days Of SQL Questions Series Practice
🧵👇
📗Here are my Last 15 days Of SQL Questions Series Practice
🧵👇
Day 1 -
Day 2 -
Q15) A company's executives are interested in seeing who earns the most money in each of the company's departments. A high earner in a department is an employee who has a salary in the top three unique salaries for that department.
--- Write an SQL query to find the employees who are high earners in each of the departments.
Q12) Write a query that outputs the name of each credit card and the difference in issued amount between the month with the most cards issued, and the least cards issued. Order the results according to the biggest difference.
🫡Thankyou Shri @NickSinghTechSir For Creating Such a Great Platform
@DataLemurHQ For SQL & Data Science Learners
🖍️Code Snippet :
@DataLemurHQ For SQL & Data Science Learners
🖍️Code Snippet :

Q11) New TikTok users sign up with their emails & each user receives a text confirm to activate their Acc. Assume you r given below tables about email & text
Write query to display the id of the users who didn't confirm on the first day of sign-up but confirmed on the second day
Write query to display the id of the users who didn't confirm on the first day of sign-up but confirmed on the second day
🫡Thankyou Shri @NickSinghTechSir For Creating Such a Great Platform @DataLemurHQ For SQL & Data Science Learners
🖍️Code Snippet :
🖍️Code Snippet :

▶️You want to reach an intermediate SQL level inside a week 🔥
💯 I have the recipe for it
Yeah, no kidding. Seriously🫡
Source - Sidharth Kriplani Sir
🧵👇
💯 I have the recipe for it
Yeah, no kidding. Seriously🫡
Source - Sidharth Kriplani Sir
🧵👇
2⃣Day Two:
Average post hiatus (bit.ly/3WRPv2I)
Teams power users (bit.ly/3jCIggI)
Cards issued difference (bit.ly/3YUdhgi)
Average post hiatus (bit.ly/3WRPv2I)
Teams power users (bit.ly/3jCIggI)
Cards issued difference (bit.ly/3YUdhgi)
Day -🔟 on @facebook SQL Questions Series 🚀🎯
& Extremely sorry guys🙏 from last 2 days I am not posted but now onward i will Continue these series 😃🔥
🧵👇
& Extremely sorry guys🙏 from last 2 days I am not posted but now onward i will Continue these series 😃🔥
🧵👇
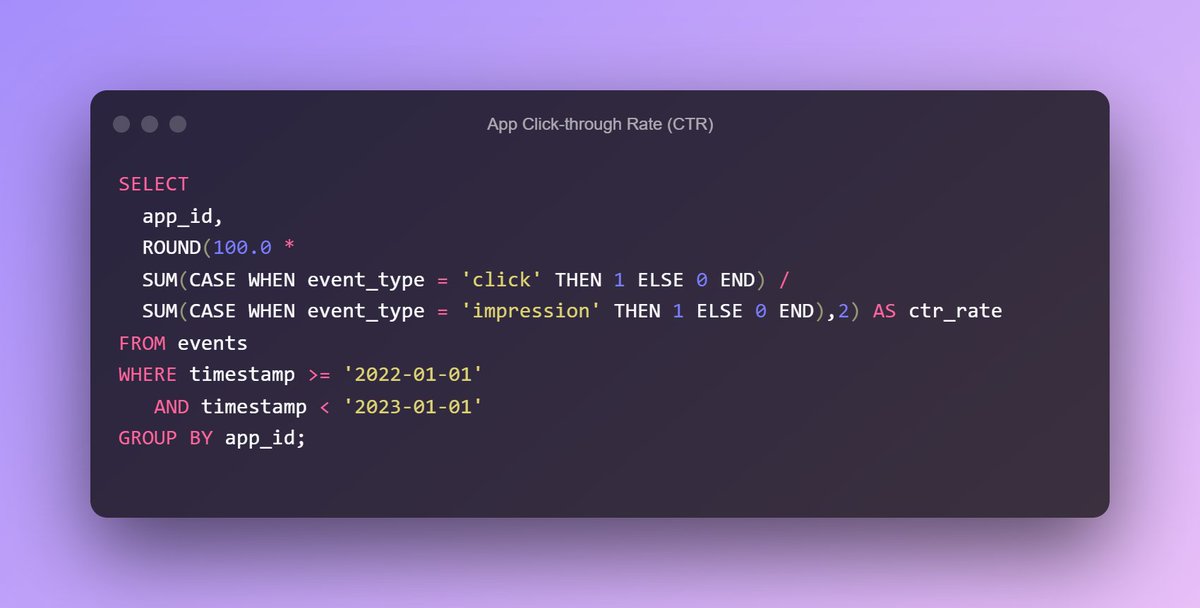
Q10) Assume you have an events table on app analytics. Write a query to get the app’s click-through rate (CTR %) in 2022. Output the results in percentages rounded to 2 decimal places.
🫡Thankyou Shri @NickSinghTechSir For Creating Such a Great Platform @DataLemurHQ For SQL & Data Science Learners
🖍️Code Snippet :
🖍️Code Snippet :

1/ Simple $SGB / $FLR use-case that does not yet exist and might make use of api-portal.flare.network/apis (No node is required):
1⃣ Build code that keeps track of your pending claim (GET via #API).
2⃣ Allow it to check the #FtsoRewardManager balances as well (GET via #API).
. . .
1⃣ Build code that keeps track of your pending claim (GET via #API).
2⃣ Allow it to check the #FtsoRewardManager balances as well (GET via #API).
. . .
2/ . . .
3⃣ Send an e-mail or push notification / messenger app / #dApp notification when the balance is too low to claim, and again when it is refilled
3⃣•1⃣ Provide a time estimate for when the smart-contract balance could be empty again
. . .
3⃣ Send an e-mail or push notification / messenger app / #dApp notification when the balance is too low to claim, and again when it is refilled
3⃣•1⃣ Provide a time estimate for when the smart-contract balance could be empty again
. . .
Free SQL Resources for beginners!
Spend $0 and earn yourself some SQL knowledge with these sites.
Post Credit - Travis Tang Sir
🧵👇
Spend $0 and earn yourself some SQL knowledge with these sites.
Post Credit - Travis Tang Sir
🧵👇
1️⃣ 𝙆𝙝𝙖𝙣 𝘼𝙘𝙖𝙙𝙚𝙢𝙮's Intro to SQL: Querying and Managing Data comes with video lessons and interactive coding exercises.
(lnkd.in/g5y_Pfvf)
(lnkd.in/g5y_Pfvf)
2️⃣ 𝘾𝙤𝙙𝙚𝙖𝙘𝙖𝙙𝙚𝙢𝙮 provides a treasure trove of text tutorials for beginners and intermediates alike. (lnkd.in/gZ5_uYjC)


