Discover and read the best of Twitter Threads about #tableau
Most recents (24)
87% of data science projects fail.
One reason is the lack of production.
Here's an easy solution. 🧵
#datascience #python #R #rstats #career
One reason is the lack of production.
Here's an easy solution. 🧵
#datascience #python #R #rstats #career

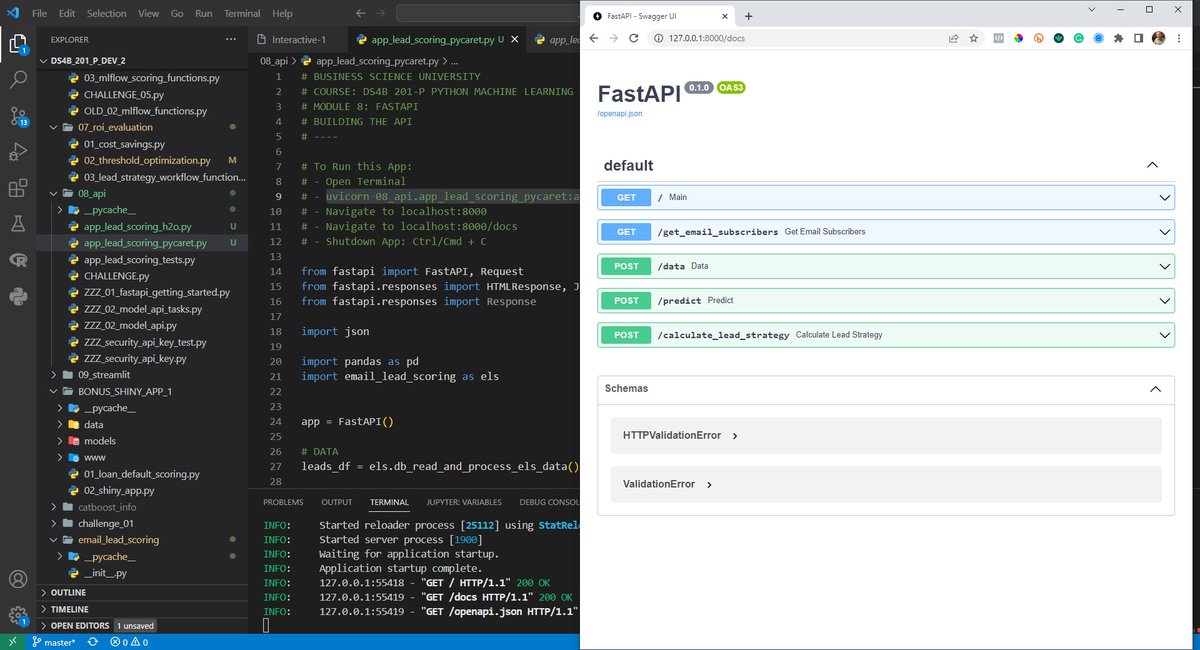
This is called an #API (Application Programming Interface). 

An API allows the user to make requests using a tool they are comfortable with.
The API runs a program that the data scientist has created on the server.
And the API returns a result.
The API runs a program that the data scientist has created on the server.
And the API returns a result.
We're automating processes now. It's challenging when automation needs end-users to adapt to a new system.🔧
To communicate the change effectively, we:
1. SHOW how the change benefits THEM (creates buy-in)🤝
2. Facilitate training📚
3. Support 👂
To communicate the change effectively, we:
1. SHOW how the change benefits THEM (creates buy-in)🤝
2. Facilitate training📚
3. Support 👂
Here's how it works:
1. SHOW them the benefits: Employees are more likely to embrace change if they see how it directly improves their lives.
It's essential to demonstrate the value in their terms. 💡
1. SHOW them the benefits: Employees are more likely to embrace change if they see how it directly improves their lives.
It's essential to demonstrate the value in their terms. 💡
Principle 2 - Effective Training: The learning curve can be intimidating. By providing time, resources, and support, you help ease the transition and boost their confidence. 🎓
How should you 𝐥𝐞𝐚𝐫𝐧 𝐏𝐨𝐰𝐞𝐫 𝐁𝐈? 🚀
🧵
🧵
It's easy to be overwhelmed by how broad #PowerBI is😖
If you're starting out, here's the path I recommend⏬
If you're starting out, here's the path I recommend⏬
📊 𝐃𝐚𝐭𝐚 𝐌𝐨𝐝𝐞𝐥𝐢𝐧𝐠
Begin by learning to organize data into tables, create relationships, and add calculated columns and measures.
This is the most important part of your journey, as understanding the #data is always the first step in Power BI development.
Begin by learning to organize data into tables, create relationships, and add calculated columns and measures.
This is the most important part of your journey, as understanding the #data is always the first step in Power BI development.
⚠ Today I Made a Awesome #America Retail Analysis Dashboard
🎇 The beauty of Power BI is that you can look at each element to make better #decisions. The #dashboard's visual representation allows users to quickly see the #data that's relevant for the choices they have to make
🎇 The beauty of Power BI is that you can look at each element to make better #decisions. The #dashboard's visual representation allows users to quickly see the #data that's relevant for the choices they have to make
🔥Then, define clear objectives to ensure that the dashboard accurately reflects your desired outcomes. 👇
#PowerBI #100DaysOfCode #100daysofcodechallenge #Data #100daysofcoding #developer #DataScience #dataScientist #DataAnalytics #excel #SQL #tableau #visualization #Dashboard
#PowerBI #100DaysOfCode #100daysofcodechallenge #Data #100daysofcoding #developer #DataScience #dataScientist #DataAnalytics #excel #SQL #tableau #visualization #Dashboard
💥14 herramientas secretas impulsadas por #RStats para ahorrar tiempo y esfuerzo en tus proyectos de datos (¡No te lo pierdas!):👀
1️⃣ ¡Edita tus datos de forma interactiva (y guarda el código)! 👀
📦 'editData' es un complemento de RStudio para editar un data.frame o un tibble de forma interactiva
🔗 buff.ly/3U5Tgjy
#DataScience #DataVisualization #dataviz #stats #analytics #RStats #Analytics
📦 'editData' es un complemento de RStudio para editar un data.frame o un tibble de forma interactiva
🔗 buff.ly/3U5Tgjy
#DataScience #DataVisualization #dataviz #stats #analytics #RStats #Analytics
2️⃣ ¡Crea gráficos #ggplot de forma interactiva!🚀
📦esquisse es otro de mis addins favoritos de #rstudio
✅ exporta el gráfico o recupera el código para reproducir el gráfico
🔗 buff.ly/3mxLHSo
#DataScience #DataVisualization #dataviz #stats #analytics #RStats #Analytics
📦esquisse es otro de mis addins favoritos de #rstudio
✅ exporta el gráfico o recupera el código para reproducir el gráfico
🔗 buff.ly/3mxLHSo
#DataScience #DataVisualization #dataviz #stats #analytics #RStats #Analytics
Q17 ) In problem where we need to find player with no of gold medals won by them only for players who won only gold medals.?
Q16 ) Write an SQL query to report all customers who never order anything.
Return the result table in any order.
Return the result table in any order.
Hey Folks 😃
📗Here are my Last 15 days Of SQL Questions Series Practice
🧵👇
📗Here are my Last 15 days Of SQL Questions Series Practice
🧵👇
Day 1 -
Day 2 -
Q15) A company's executives are interested in seeing who earns the most money in each of the company's departments. A high earner in a department is an employee who has a salary in the top three unique salaries for that department.
--- Write an SQL query to find the employees who are high earners in each of the departments.
Q12) Write a query that outputs the name of each credit card and the difference in issued amount between the month with the most cards issued, and the least cards issued. Order the results according to the biggest difference.
🫡Thankyou Shri @NickSinghTechSir For Creating Such a Great Platform
@DataLemurHQ For SQL & Data Science Learners
🖍️Code Snippet :
@DataLemurHQ For SQL & Data Science Learners
🖍️Code Snippet :

Q11) New TikTok users sign up with their emails & each user receives a text confirm to activate their Acc. Assume you r given below tables about email & text
Write query to display the id of the users who didn't confirm on the first day of sign-up but confirmed on the second day
Write query to display the id of the users who didn't confirm on the first day of sign-up but confirmed on the second day
🫡Thankyou Shri @NickSinghTechSir For Creating Such a Great Platform @DataLemurHQ For SQL & Data Science Learners
🖍️Code Snippet :
🖍️Code Snippet :

▶️You want to reach an intermediate SQL level inside a week 🔥
💯 I have the recipe for it
Yeah, no kidding. Seriously🫡
Source - Sidharth Kriplani Sir
🧵👇
💯 I have the recipe for it
Yeah, no kidding. Seriously🫡
Source - Sidharth Kriplani Sir
🧵👇
2⃣Day Two:
Average post hiatus (bit.ly/3WRPv2I)
Teams power users (bit.ly/3jCIggI)
Cards issued difference (bit.ly/3YUdhgi)
Average post hiatus (bit.ly/3WRPv2I)
Teams power users (bit.ly/3jCIggI)
Cards issued difference (bit.ly/3YUdhgi)
[Thread Périodique de Vulga(i)risation des Éléments]
Un élément = Un thread
Des facts (toute l'année) plus ou moins intéressants sur nos chers (ou pas) éléments du tableau périodique. Le 92ème va vous étonner (non).
#chimie #tableau #périodique #élément #matière #atome
Un élément = Un thread
Des facts (toute l'année) plus ou moins intéressants sur nos chers (ou pas) éléments du tableau périodique. Le 92ème va vous étonner (non).
#chimie #tableau #périodique #élément #matière #atome

Day -🔟 on @facebook SQL Questions Series 🚀🎯
& Extremely sorry guys🙏 from last 2 days I am not posted but now onward i will Continue these series 😃🔥
🧵👇
& Extremely sorry guys🙏 from last 2 days I am not posted but now onward i will Continue these series 😃🔥
🧵👇
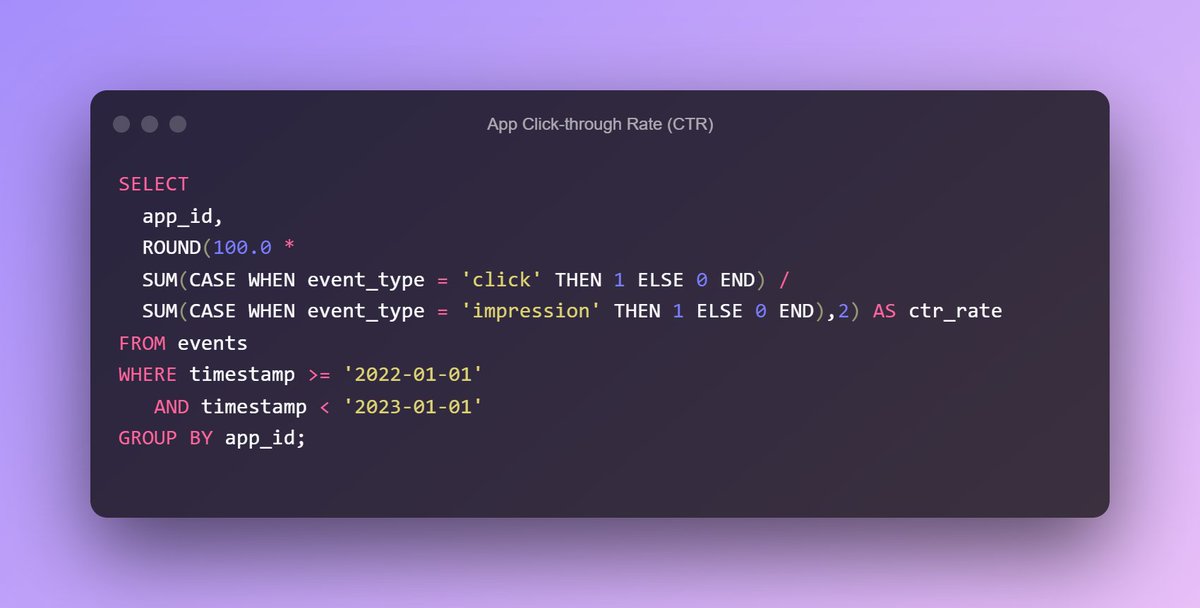
Q10) Assume you have an events table on app analytics. Write a query to get the app’s click-through rate (CTR %) in 2022. Output the results in percentages rounded to 2 decimal places.
🫡Thankyou Shri @NickSinghTechSir For Creating Such a Great Platform @DataLemurHQ For SQL & Data Science Learners
🖍️Code Snippet :
🖍️Code Snippet :

Free SQL Resources for beginners!
Spend $0 and earn yourself some SQL knowledge with these sites.
Post Credit - Travis Tang Sir
🧵👇
Spend $0 and earn yourself some SQL knowledge with these sites.
Post Credit - Travis Tang Sir
🧵👇
1️⃣ 𝙆𝙝𝙖𝙣 𝘼𝙘𝙖𝙙𝙚𝙢𝙮's Intro to SQL: Querying and Managing Data comes with video lessons and interactive coding exercises.
(lnkd.in/g5y_Pfvf)
(lnkd.in/g5y_Pfvf)
2️⃣ 𝘾𝙤𝙙𝙚𝙖𝙘𝙖𝙙𝙚𝙢𝙮 provides a treasure trove of text tutorials for beginners and intermediates alike. (lnkd.in/gZ5_uYjC)
𝟱 𝗿𝗲𝘀𝗼𝘂𝗿𝗰𝗲𝘀 𝘁𝗼 𝗹𝗲𝗮𝗿𝗻 𝘁𝗵𝗲 𝗯𝗮𝘀𝗶𝗰𝘀 𝐒𝐐𝐋 𝗳𝗼𝗿 𝗳𝗿𝗲𝗲🔥
Credit : Shri Harshit Ahluwalia
🧵👇
Credit : Shri Harshit Ahluwalia
🧵👇
✅Follow @SachinK02316651 for more update
#PowerBI #Excel #SQL #python #DataScience #machinelearning #tableau #dataanalysis
#PowerBI #Excel #SQL #python #DataScience #machinelearning #tableau #dataanalysis

Excellent Python Programs to be better - Beginner
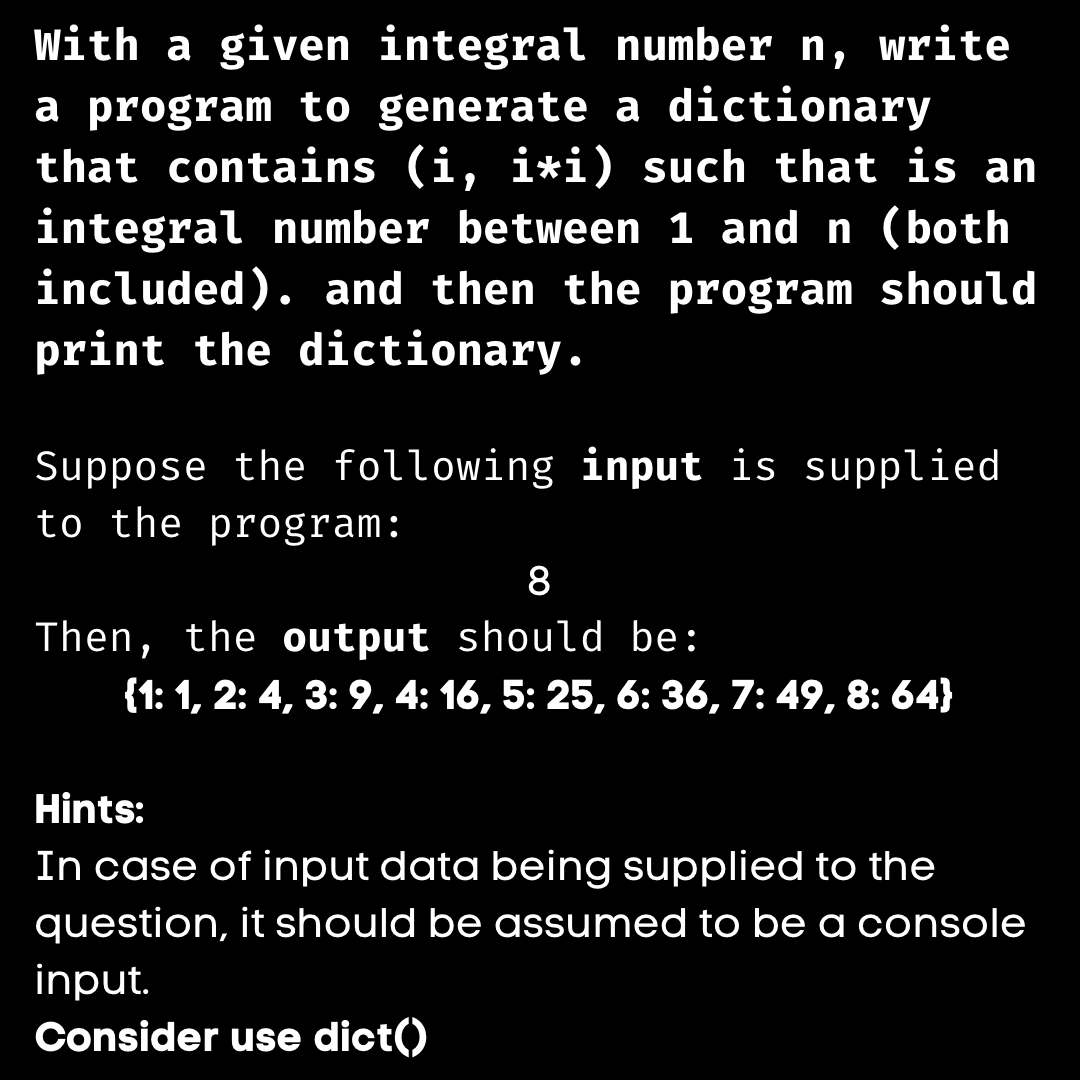
🧵 2 Questions
#datavisualization #data #tableau #storytelling #technology #analytics #intelligence #innovation #learning #scalability #dataanalytics #businessintelligence #art #datastorytelling #MachineLearning #DataScience
🧵 2 Questions
#datavisualization #data #tableau #storytelling #technology #analytics #intelligence #innovation #learning #scalability #dataanalytics #businessintelligence #art #datastorytelling #MachineLearning #DataScience

🧵How to Tell a Good Story with Data
Part 1 Thread
#datavisualization #data #tableau #storytelling #technology #analytics #intelligence #innovation #visualization #learning #scalability #dataanalytics #businessintelligence #art #datastorytelling #MachineLearning #DataScience
👇🏻
Part 1 Thread
#datavisualization #data #tableau #storytelling #technology #analytics #intelligence #innovation #visualization #learning #scalability #dataanalytics #businessintelligence #art #datastorytelling #MachineLearning #DataScience
👇🏻

🔥Top 12 free Handbooks about Data Science / AI :
✅"Python Data Science Handbook"
tanthiamhuat.files.wordpress.com/2018/04/python…
✅"Learning Pandas"
linkedin.com/posts/stevenou…
✅"MACHINE LEARNING YEARNING"
lnkd.in/gXdYjzi
✅"Feature Engineering for Machine Learning"
d2wvfoqc9gyqzf.cloudfront.net/content/upload…
✅"Python Data Science Handbook"
tanthiamhuat.files.wordpress.com/2018/04/python…
✅"Learning Pandas"
linkedin.com/posts/stevenou…
✅"MACHINE LEARNING YEARNING"
lnkd.in/gXdYjzi
✅"Feature Engineering for Machine Learning"
d2wvfoqc9gyqzf.cloudfront.net/content/upload…
✅"The Hundred-Page Machine Learning Book"
lnkd.in/gNb22Qh
✅ "Introduction to Statistical Machine Learning"
lnkd.in/guFgpXD
✅"Statistics for Data Science"
lnkd.in/gBudWsA
✅"Natural Language Processing With Python"
lnkd.in/gCFKZAs
#Data #ind
lnkd.in/gNb22Qh
✅ "Introduction to Statistical Machine Learning"
lnkd.in/guFgpXD
✅"Statistics for Data Science"
lnkd.in/gBudWsA
✅"Natural Language Processing With Python"
lnkd.in/gCFKZAs
#Data #ind
✅"The Deep Learning Textbook"
lnkd.in/gfBv4h5
✅Deep learning Masterpiece by Andrew Ng
lnkd.in/gU98mhj
++A collection of Free Programing Books :
lnkd.in/gPPYPyD
By - Haithem Hermessi
#DataAnalytics #dataScientist #dataengineering #MachineLearning
lnkd.in/gfBv4h5
✅Deep learning Masterpiece by Andrew Ng
lnkd.in/gU98mhj
++A collection of Free Programing Books :
lnkd.in/gPPYPyD
By - Haithem Hermessi
#DataAnalytics #dataScientist #dataengineering #MachineLearning
In #DataAnalytics, it's impossible to memorize everything you need to know about #Tableau.
Fortunately, there are amazing cheat sheets so that you don't have to memorize the basics.
Here are 7 Tableau Cheatsheets for you to download now:⤵
#DataFam #AllAboutTheData
Fortunately, there are amazing cheat sheets so that you don't have to memorize the basics.
Here are 7 Tableau Cheatsheets for you to download now:⤵
#DataFam #AllAboutTheData
1) DataCamp
In this Tableau Cheat Sheet, you'll learn how to create your first visualization, top visualizations in Tableau, creating dashboards, stories, and more.
Download now: twtr.to/r6am
In this Tableau Cheat Sheet, you'll learn how to create your first visualization, top visualizations in Tableau, creating dashboards, stories, and more.
Download now: twtr.to/r6am

2) Intellipaat
This cheat sheet will provide you with all the basics of the Tableau desktop that you need to know to get started with Tableau
Download now: twtr.to/xqR-
This cheat sheet will provide you with all the basics of the Tableau desktop that you need to know to get started with Tableau
Download now: twtr.to/xqR-

Here's the step by step process I used to create and close a $36,000 "no-brainer" data consulting engagement with one client:
Step 1) I got to know business owners.
Through a friend that ran a solo agency, I was asked to bid on a small #Tableau job.
I got the bid just to get my foot in the door, and over delivered at every step.
I had no website, portfolio, or business cards.
Just relationships.
Through a friend that ran a solo agency, I was asked to bid on a small #Tableau job.
I got the bid just to get my foot in the door, and over delivered at every step.
I had no website, portfolio, or business cards.
Just relationships.
Step 2) I under-promised and over-delivered.
It's cliche, but powerful.
Example: applying branding colors to a Tableau dashboard takes about 15 minutes, but makes the final product 1000× better.
This gave the solo agency owner confidence that I knew what I was doing.
It's cliche, but powerful.
Example: applying branding colors to a Tableau dashboard takes about 15 minutes, but makes the final product 1000× better.
This gave the solo agency owner confidence that I knew what I was doing.
Visual financial astrology update for $ETH & $BTC #Bitcoin #Cryptos
Showing planets in tropical zodiac signs in color with #Tableau, a unique #Datavisualization
Thread >
Saturn
Sign change in 2017 2 days from BTC top
Saturn in Aquarius (light gray) supporting cryptos
Showing planets in tropical zodiac signs in color with #Tableau, a unique #Datavisualization
Thread >
Saturn
Sign change in 2017 2 days from BTC top
Saturn in Aquarius (light gray) supporting cryptos

Hi
Interesting astro & markets charts ahead - unique #Datavisualization with #Tableau
$SPX 2005-current
Colors show Pluto through Terms
Note 2008 - Pluto in Term Mars (red) rallied at 1st, but then most of meltdown Pluto in red
Now 2021-22 & change into red Mars near the top
Interesting astro & markets charts ahead - unique #Datavisualization with #Tableau
$SPX 2005-current
Colors show Pluto through Terms
Note 2008 - Pluto in Term Mars (red) rallied at 1st, but then most of meltdown Pluto in red
Now 2021-22 & change into red Mars near the top

Volatility idea was not hindsight as I pointed out negative historical data in Dec-2021
If you are new to this account, what are the "terms"?
Very ancient divisions of the zodiac not in regular use today by 99%+ of astrologers
Yet I find the data & market reactions compelling again and again
Very ancient divisions of the zodiac not in regular use today by 99%+ of astrologers
Yet I find the data & market reactions compelling again and again


