Discover and read the best of Twitter Threads about #INFOGRAPHIC
Most recents (24)
[World #IBSAwarenessMonth] Dear #HCPs👩⚕️ & #Microbiota community👨🔬, April is dedicated to raising awareness about #IrritableBowelSyndrome
During the month, @Microbiota_Inst will provide you with content about #IBS, a common & complex #disease
#GutHealth #LetsTalkIBS #thread👇
During the month, @Microbiota_Inst will provide you with content about #IBS, a common & complex #disease
#GutHealth #LetsTalkIBS #thread👇

[World #IBSAwarenessMonth]
🔎 You will:
👉better understand the🔗between #IBS & #microbiota
👉discover potential ways to manage the #disease
👉learn to make a #diagnosis with our #CME courses, #videos & a professionally designed #tool
👉improve communication with your #patients
🔎 You will:
👉better understand the🔗between #IBS & #microbiota
👉discover potential ways to manage the #disease
👉learn to make a #diagnosis with our #CME courses, #videos & a professionally designed #tool
👉improve communication with your #patients
[World #IBSAwarenessMonth]
1️⃣ In this sequence, learn more about the link between #microbiota and #IrritableBowelSyndrome.
#IBS #MedTwitter #GITwitter #GutHealth #LetsTalkIBS #DGBI #FGID #GIfellows #TakeIBSSeriously
Take a look! 👇
1️⃣ In this sequence, learn more about the link between #microbiota and #IrritableBowelSyndrome.
#IBS #MedTwitter #GITwitter #GutHealth #LetsTalkIBS #DGBI #FGID #GIfellows #TakeIBSSeriously
Take a look! 👇

Here is a selection of the *coolest* 3D maps, visuals, and map-like worlds from the past months you don't want to miss. Wonderful dynamic, interactive, static, creative or artistic visuals PART 3. #Dataviz #3dMap #GIS #3D #Cartography #GISchat 1/20🧵
spatial_occasions | @spatial_occasions mesmerizing and stunning visualization of the flight networks on the Globe. Just perfect. Made in #Blender3D. #B3d #3DMap #GeometryNodes #Dataviz 2/🧵
Terence Fostodon's | @researchremora perfect mix of 3D and 2D with a brilliant style. Ultra productive 3D map maker, worth every follow! Made in #rstats with #rayshader. 3/🧵
A picture says a 1000 words. In the world of online media, it makes sense to convey information in an image or in a short video formats.
Infographics are essential to convey information in the modern 🌎
A thread 🧵 #8 for your awareness
Infographics are essential to convey information in the modern 🌎
A thread 🧵 #8 for your awareness

Here’s a prev thread on #infographic
#SQL Cheatsheet #infographic
———————
#Databases #DataScientists #DataScience #DataManagement #DataProfiling #DataLiteracy #DataQuality
———————
#Databases #DataScientists #DataScience #DataManagement #DataProfiling #DataLiteracy #DataQuality

12 Best #SQL Online Course Certificate Programs for #DataScience in 2023 — compiled by @tut_ml
————
#Databases #BigData #DataScientists
mltut.com/best-sql-onlin…
————
#Databases #BigData #DataScientists
mltut.com/best-sql-onlin…
7 Best Advanced #SQL Courses & Training Online You Must Know in 2023 — compiled by @tut_ml
————
#BigData #DataScience #DataScientists #Coding #Database #Analytics
mltut.com/best-advanced-…
————
#BigData #DataScience #DataScientists #Coding #Database #Analytics
mltut.com/best-advanced-…
🇵🇱 #Poland's @KancelariaSejmu passes historic resolution to seek #reparations for #WWII losses caused by #Germany.
#unREDEEMed #WarLossesReport #RaportStratWojennych #ReparationsNow #ReparacjedlaPolski @PolandMFA #ReparationsForPoland #history
#unREDEEMed #WarLossesReport #RaportStratWojennych #ReparationsNow #ReparacjedlaPolski @PolandMFA #ReparationsForPoland #history
64% of #Polish people say #Germany should pay reparations for the damage it caused to #Poland during #WWII according to a new Social Changes opinion poll (source: @wPolityce_pl, Sept 4)
#WarLossesReport #RaportStratWojennych #ReparacjedlaPolski #ReparationsForPoland #Statistics
#WarLossesReport #RaportStratWojennych #ReparacjedlaPolski #ReparationsForPoland #Statistics

The death toll in #WWII was enormous with millions of lives lost.
There was 1️⃣ country that suffered disproportionately, it was #Poland 🇵🇱
Chart: WW2 casualties as % of each country's population
#unREDEEMed #ReparationsNow #ReparationsForPoland #ReparacjedlaPolski #Infographic
There was 1️⃣ country that suffered disproportionately, it was #Poland 🇵🇱
Chart: WW2 casualties as % of each country's population
#unREDEEMed #ReparationsNow #ReparationsForPoland #ReparacjedlaPolski #Infographic

1/9 Ideas are not enough.
A great idea is like an engine in a race car- it needs all the other elements- tires, suspension, driver, aerodynamics - in order to win the race.
What are they? Read along ...
#ThoughtLeadership #MarketingStrategy #Marketing #Innovation
A great idea is like an engine in a race car- it needs all the other elements- tires, suspension, driver, aerodynamics - in order to win the race.
What are they? Read along ...
#ThoughtLeadership #MarketingStrategy #Marketing #Innovation

2/9 By building a full structure of thought leadership, you have confidence in the power of the idea taking hold and moving people.
So a merit-worthy idea needs to be built out into a full Thought Leadership Model.
Read along for what that means and how to do it...
So a merit-worthy idea needs to be built out into a full Thought Leadership Model.
Read along for what that means and how to do it...
During #WWII, 🇵🇱 suffered the greatest personal & material losses out of all European countries, in terms of total population and national assets.
#unREDEEMed #WarLossesReport #RaportStratWojennych #ReparationsNow #ReparacjedlaPolski @arekmularczyk @PolandMFA @michalrachon
#unREDEEMed #WarLossesReport #RaportStratWojennych #ReparationsNow #ReparacjedlaPolski @arekmularczyk @PolandMFA @michalrachon
64% of #Polish people say #Germany should pay reparations for the damage it caused to #Poland during #WWII according to a new Social Changes opinion poll (source: @wPolityce_pl, Sept 4)
#WarLossesReport #RaportStratWojennych #ReparacjedlaPolski #ReparationsForPoland #Statistics
#WarLossesReport #RaportStratWojennych #ReparacjedlaPolski #ReparationsForPoland #Statistics

👏🏻
#Dotsama 🧵⬇️
Am stoked to present to you our very 1st thread!
I have personally chosen to make this thread about the amazing @authtrail, a #Web3 developers platform built on @moonbeam!
First up, why #Moonbeam?
⤵️
Am stoked to present to you our very 1st thread!
I have personally chosen to make this thread about the amazing @authtrail, a #Web3 developers platform built on @moonbeam!
First up, why #Moonbeam?
⤵️
@MoonbeamNetwork is the easiest path to the multi-chain future that is the end game for @gavofyork @polkadot & @substrate vision
Moonbeam is more than just an #EVM
*Native deployments
*Hybrid Deployments
*Multi-cahin deployments
*Cross-chain deployments
*XC-20 Deployments
⤵️
Moonbeam is more than just an #EVM
*Native deployments
*Hybrid Deployments
*Multi-cahin deployments
*Cross-chain deployments
*XC-20 Deployments
⤵️
*New users & use cases (due to #ETH gas)
*Immediate access to rich pool of assets
*growing eco system
Website ⬇️
moonbeam.network
⤵️
*Immediate access to rich pool of assets
*growing eco system
Website ⬇️
moonbeam.network
⤵️
Does the enormously complex issue of #climatechange have to be presented to policymakers, and therefore the public, as the behemoth it really is?
Today I released my second #infographic explainer on the @IPCC_CH #AR6 reports.
eciu.net/analysis/infog…
#SummaryForPeople 🧵
Today I released my second #infographic explainer on the @IPCC_CH #AR6 reports.
eciu.net/analysis/infog…
#SummaryForPeople 🧵
The amazing @skepticscience is even featuring it today, with added commentary, a real honour for a mere student of scientist.
skepticalscience.com/ipcc-explainer…
@theresphysics @BaerbelW @johnfocook @KenCaldeira
skepticalscience.com/ipcc-explainer…
@theresphysics @BaerbelW @johnfocook @KenCaldeira

So, what does this, the longest explainer I've made yet, actually say?
Like the first edition — eciu.net/analysis/infog… — it kicks off with context about how we arrived at #IPCCAR6, on the @IPCC_CH itself and how it goes about communicating uncertainty.
Like the first edition — eciu.net/analysis/infog… — it kicks off with context about how we arrived at #IPCCAR6, on the @IPCC_CH itself and how it goes about communicating uncertainty.

🧵 #IDtwitter , the #ImagesinID files bring us this tongue lesion 🔍 🗂 #IdBoardReview #MedTwitter
44 year old male, HIV (+), non adherent to antiretroviral therapy (CD4 120) presents for evaluation of this lesion:
44 year old male, HIV (+), non adherent to antiretroviral therapy (CD4 120) presents for evaluation of this lesion:

🤔 The most likely microorganism responsible for this finding is:
🪡1/5 B) Treponema Pallidum
This patient presents with a syphilitic gumma in the setting of tertiary syphilis
Although gummatous disease is uncommon, HIV patients have an increased risk of developing gummas most frequently in the oral cavity, skin or a viscera.
This patient presents with a syphilitic gumma in the setting of tertiary syphilis
Although gummatous disease is uncommon, HIV patients have an increased risk of developing gummas most frequently in the oral cavity, skin or a viscera.
1/ Eli5DeFi is a collaborative effort to educate people about #DeFi, #Cryptocurrency and #Blockchain with infographics and visual guides.
Our #Notion page is a one-stop place for curated DeFi information and resources
bit.ly/3zQHouR
Our #Notion page is a one-stop place for curated DeFi information and resources
bit.ly/3zQHouR
2/ To find our unrolled #infographics🧵, you can check our @typefully page below:
typefully.com/eli5_defi
typefully.com/eli5_defi
3/ Our first #visualguide is about @CurveFinance Primer, including @ConvexFinance and #CurveWars narration. Check the🧵for more details!
$CRV $veCRV $CVX $crvCVX
#Curve #Convex #DeFi #YieldFarming
$CRV $veCRV $CVX $crvCVX
#Curve #Convex #DeFi #YieldFarming
#GM!
What is #liquidity pool? how does it work? what is impermanent loss? how to minimize it?
This visual guide will help you understand #LP and how it enables decentralized #economy to thrive.
(1/12)
#DeFi #Crypto #Bitcoin #Ethereum #AVAX #BNB #DEX #Uniswap #PancakeSwap
What is #liquidity pool? how does it work? what is impermanent loss? how to minimize it?
This visual guide will help you understand #LP and how it enables decentralized #economy to thrive.
(1/12)
#DeFi #Crypto #Bitcoin #Ethereum #AVAX #BNB #DEX #Uniswap #PancakeSwap
LP is a vault into which participants deposit and lock their assets in smart contracts to form a market (trading pair) and make it liquid for those wishing to trade in that pair.
(2/12)
#DeFi #Crypto #Bitcoin #Ethereum #AVAX #BNB #DEX #Infographic #yieldFarming
(2/12)
#DeFi #Crypto #Bitcoin #Ethereum #AVAX #BNB #DEX #Infographic #yieldFarming

Most #LP requires assets to be paired, this asset will create trading pair by utilising constant product formula to ensure a fair price.
(3/12)
#DeFi #Crypto #Bitcoin #Ethereum #AVAX #BNB #DEX #Infographic #yieldFarming
(3/12)
#DeFi #Crypto #Bitcoin #Ethereum #AVAX #BNB #DEX #Infographic #yieldFarming

After a successful weekend with Biomass again, I figured I'd share a bit about its inception 🧵⬇️
HOW I MADE THIS: Visualizing the Biomass of Life #biomass #wip #process #art #science #datavisualization #dataviz #infographic #biodiversity
HOW I MADE THIS: Visualizing the Biomass of Life #biomass #wip #process #art #science #datavisualization #dataviz #infographic #biodiversity

The original paper that this graphic is based on was published by @yinonbaron @MiloLabWIS @WeizmannScience. It came across my desk working at Visual Capitalist and the crew wanted to see what I could do with it. pnas.org/doi/10.1073/pn…
There was already a graphic explaining the key findings in the paper, shown here. It's a really nice Treemap visualization using a #voronoi pattern (random Fun Fact: voronois are everywhere in biology: bone matrices, cell shapes, wing scales, etc.) 

Daily Bookmarks to GAVNet 04/05/2022 greeneracresvaluenetwork.wordpress.com/2022/04/05/dai…
We cannot believe we overlooked these Majorana discoveries
arxiv.org/abs/2203.17060
#MajoranaFermions, #ResearchResults
arxiv.org/abs/2203.17060
#MajoranaFermions, #ResearchResults
Daily Bookmarks to GAVNet 03/22/2022 greeneracresvaluenetwork.wordpress.com/2022/03/22/dai…
Drones shed light on coastal water flows
phys.org/news/2022-03-d…
#UnmannedAerialVehicles, #CoastalWaters, #WaterFlowMonitoring, #DyePlumeTracing
phys.org/news/2022-03-d…
#UnmannedAerialVehicles, #CoastalWaters, #WaterFlowMonitoring, #DyePlumeTracing
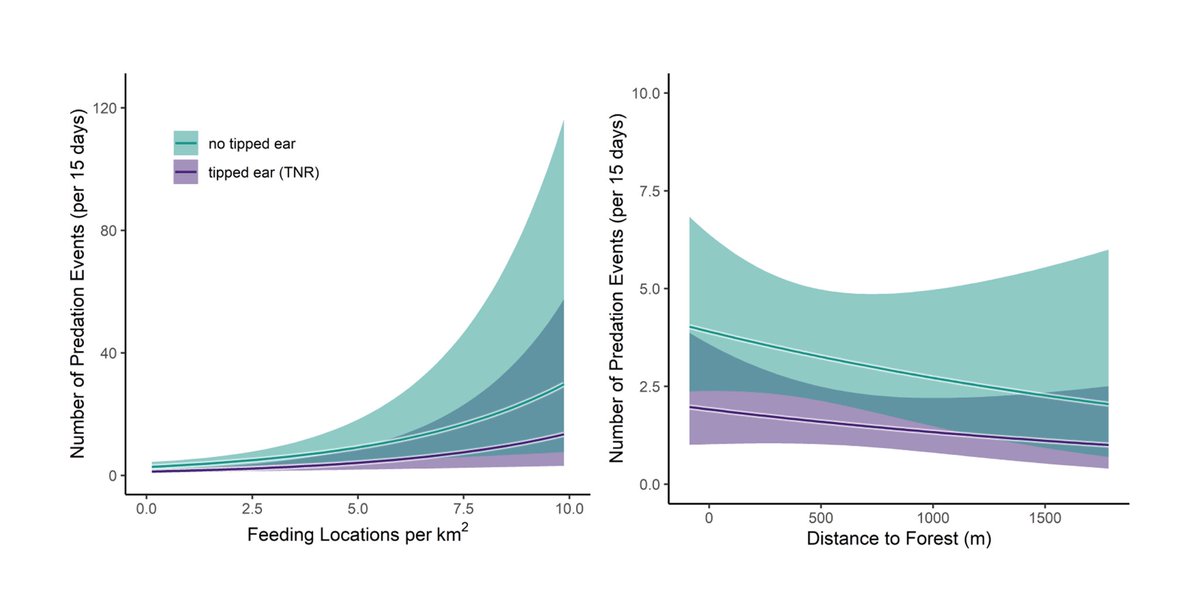
My first #dissertation chapter has been published! The paper focuses on #predation of #urban #wildlife by #cats with recommendations for collaborative data-driven management strategies. Main points are summarized in this #infographic, but more info and paper link in this thread! 

We spent 3 years surveying #WashingtonDC for #cats using #trailcams. Whenever we saw an image of a cat carrying prey, we noted the species and location, and added it to our predation database. 

Dive-in for a peek at my #process and #designthinking on how I made my latest science infographic: "Comparing How COVID-19 Vaccines and Antiviral Pills Work" ⬇️🧵#COVID #Pfizer #Merck #DIY #infographic #vaccines #WIP #development #Covid_19 #paxlovid 
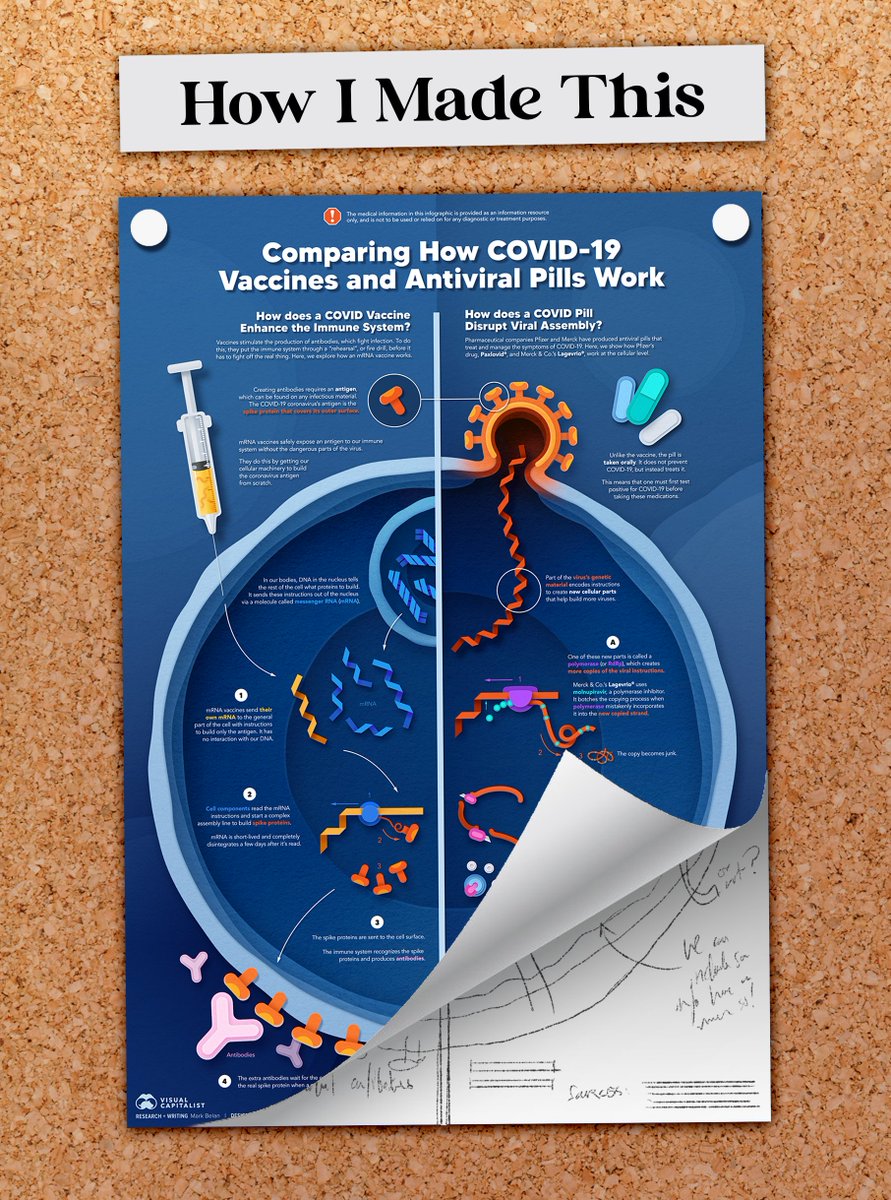
The original inspiration for this piece was the newly marketed antiviral pills by Pfizer and Merck for the treatment of COVID-19. I thought with hearing so much about vaccines this year, and with pills entering the arena, people might be curious about what each does in the body.
When I started researching, I quickly learned that there were many types of vaccines. Here's one chart I found that explains this (left; by Nikita Ramesh, made with @BioRender). My first idea (right) was to convey ALL these types of vaccines against antivirals. 

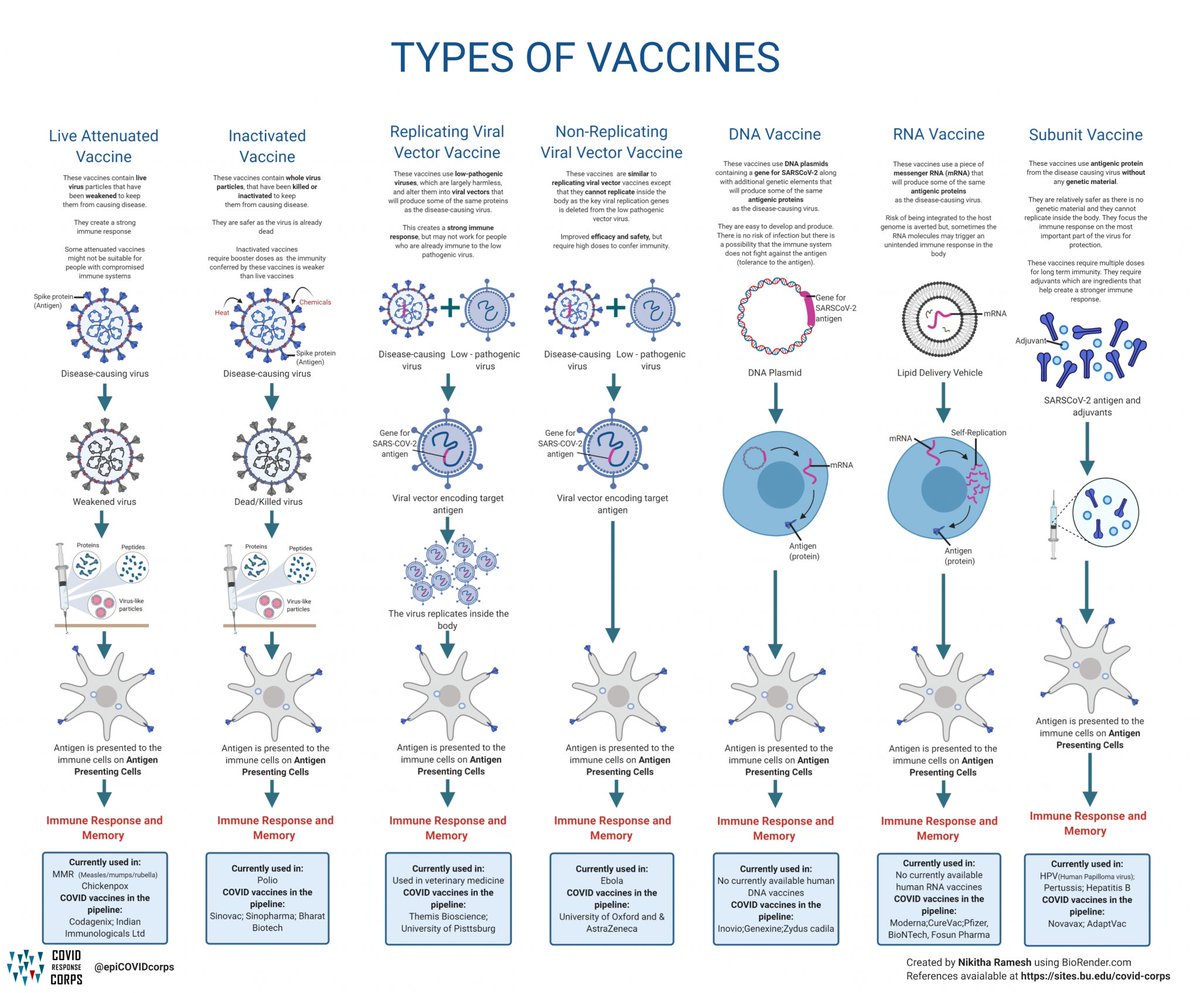

1/
It was a delight to work with @gabifpucci of @neudrawlogy to explore the incredibly diverse CNS complications of infective endocarditis!
An #infographic & #tweetorial investigating the radiographic & clinical findings in IE + some management pearls!
#MedEd #Neurotwitter
It was a delight to work with @gabifpucci of @neudrawlogy to explore the incredibly diverse CNS complications of infective endocarditis!
An #infographic & #tweetorial investigating the radiographic & clinical findings in IE + some management pearls!
#MedEd #Neurotwitter

The most common cause of neurologic injury in IE is ischemic stroke.
But! Management is somewhat different.
Notably, due to the high risk of hemorrhagic transformation, tPA is relatively contraindicated or should be used with extreme caution.
You don’t want to end up with ⬇️!
But! Management is somewhat different.
Notably, due to the high risk of hemorrhagic transformation, tPA is relatively contraindicated or should be used with extreme caution.
You don’t want to end up with ⬇️!

3/
As evidence: in this series, 1 in 5 patients experienced post-tPA ICH and only 10% achieved a good outcome.
Thrombolysis for Ischemic Stroke Associated With Infective Endocarditis ahajournals.org/doi/full/10.11…
As evidence: in this series, 1 in 5 patients experienced post-tPA ICH and only 10% achieved a good outcome.
Thrombolysis for Ischemic Stroke Associated With Infective Endocarditis ahajournals.org/doi/full/10.11…

NEW PIECE: A Visual Introduction to the Dwarf Planets of our Solar System🔭🌕🌑🪐 #dwarfplanets #space #dwarf #outerspace #planet #pluto #infographic #dataviz #orbit #scicomm #sciviz #nasa #spaceart #visual 


This one is a fun topic for me - I've always been fascinated with society's disdain for Pluto's downgrade, but the complete lack of interest for the other members of Pluto's family!!
You'll notice there's more than 5 of the IAU's recognized dwarf planets. This is because I referenced additional planets that are agreed upon by @plutokiller, @GonzaloTancredi, and Will Grundy @LowellObs. Depending who you ask, there's more!
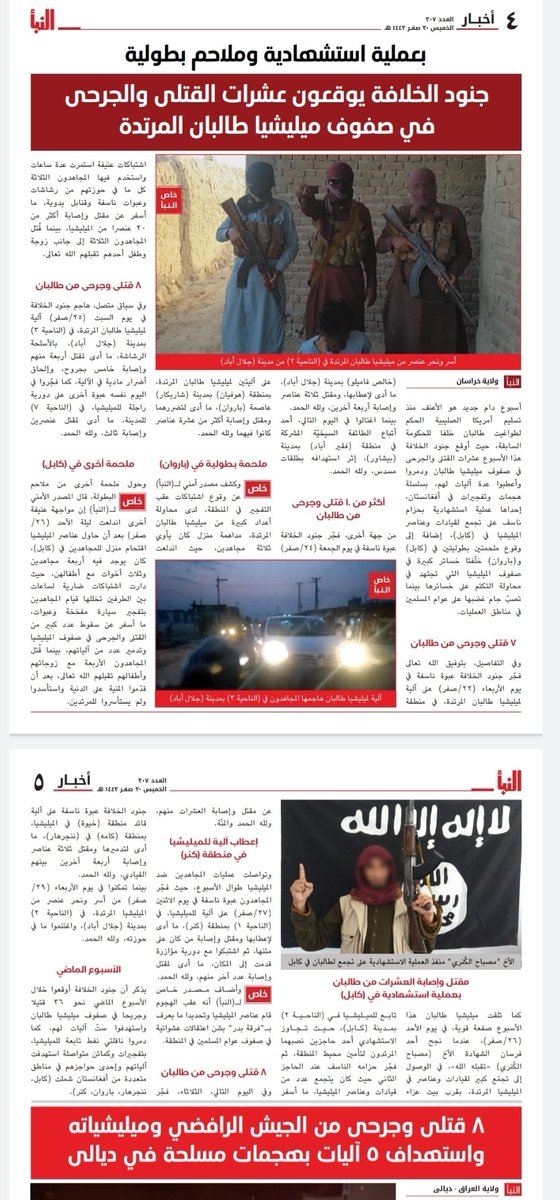
Infographic of the latest issue of Islamic State's Al-Naba weekly: #ISKP once again topped the casualties list with 36 killed&wounded during the last week, but with 11 attacks, in number of attacks took 2nd position after Iraq. A next page of Al-Naba shows details of all attacks. 


The #infographic of the 307th issue of Al-Naba weekly of ISIS is showing that #ISKP with 10 attacks& 100 casualties, is on the 2nd position after Iraq in number of attacks& on the 1st position in number of casualties, among all Islamic State provinces during the last 1 week.
#AFG
#AFG

Ever wondered what all that time on Twitter, Facebook, Instagram, and TikTok was doing to you—and society?
Here’s an #infographic on what you need to know about the dark side of social media. (Follow the 6 part thread for close ups of the bigger file)
Here’s an #infographic on what you need to know about the dark side of social media. (Follow the 6 part thread for close ups of the bigger file)

Social media’s harms form a continuum that runs from personal tragedy to large-scale loss. How has it affected you and your community? #Infographic 2/6 

Let’s get to the root of social media’s harmful model: Our attention is being put up for sale. #infographic 3/6 

Daily Bookmarks to GAVNet 08/06/2021 greeneracresvaluenetwork.wordpress.com/2021/08/06/dai…
12 Ways to Get Smarter in One Infographic
visualcapitalist.com/12-ways-smarte…
#infographic #intelligence #MentalModels
visualcapitalist.com/12-ways-smarte…
#infographic #intelligence #MentalModels
Online education avoids the ‘hidden curriculum’ of cultural expectations
timeshighereducation.com/blog/online-ed…
#OnlineEducation #CulturalExpectations #consequences #mitigation
timeshighereducation.com/blog/online-ed…
#OnlineEducation #CulturalExpectations #consequences #mitigation
Thanks for being brave and helping us learn @AryaCampaigns! Here's my redesign!
Your focus is ACCESS. Currently that is buried and obscured. Suggest a #stackedbarchart #infographic to show your avg access, then break down by low and high health literate.
cont...
Your focus is ACCESS. Currently that is buried and obscured. Suggest a #stackedbarchart #infographic to show your avg access, then break down by low and high health literate.
cont...

honestly, in this case, your graphics are fighting your message, and I'd just get down to clearly showing your data. I'd also rather have labels than icons here, because I'm struggling to understand exactly what some of the icons are.
cont...
cont...
Possible to bring some images back in what I've labled demographics, but you may want to ask yourself what those are doing to help your message. Some of the side info could be cut.
I've been thinking a lot about #illustration and #graphics in #scicomm and the place they play in design.
Like text, images hold info. I like to think of my images in terms of question-centered design as well. Here's a system of levels I've made to help me organize images:
Like text, images hold info. I like to think of my images in terms of question-centered design as well. Here's a system of levels I've made to help me organize images:


