Discover and read the best of Twitter Threads about #DataVis
Most recents (10)
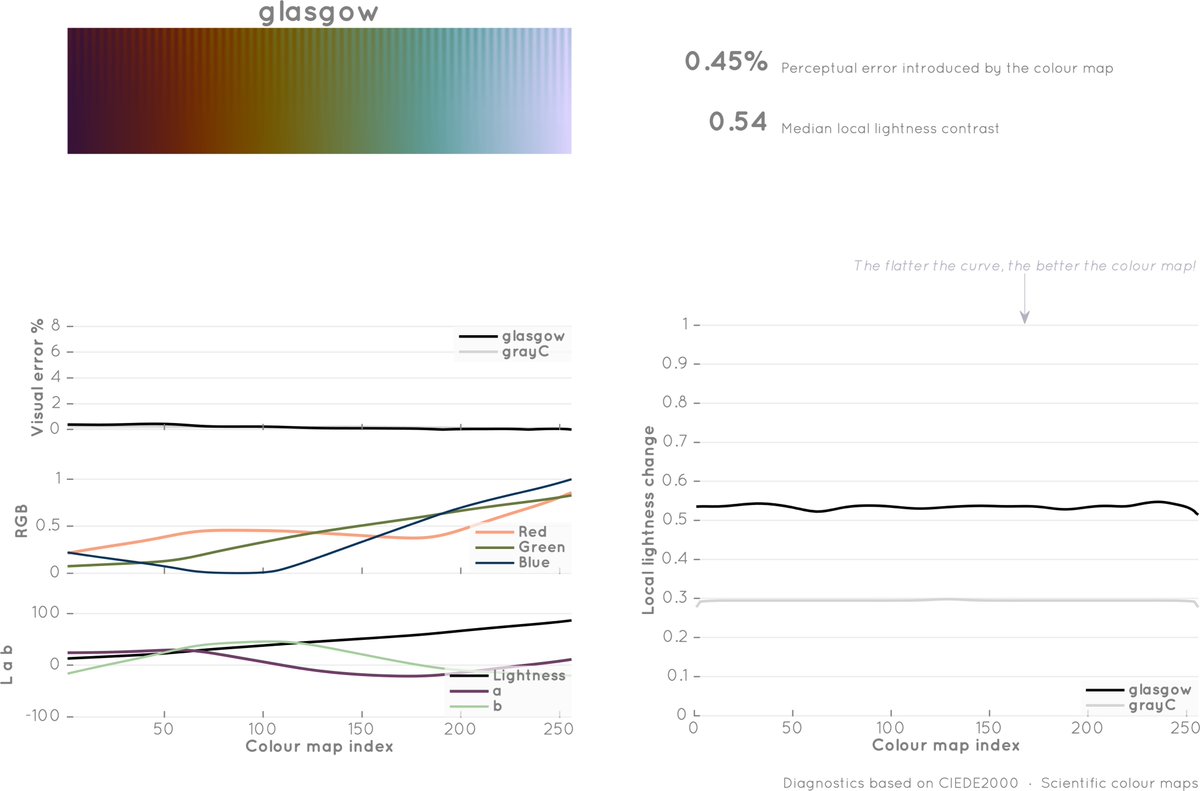
Scientific colour maps 8.0
fabiocrameri.ch/colourmaps
#useBatlow
#ScientificVisualisation #visualisation #Science #ColourPalette #DataVis #GraphicDesign
#OpenSource #Accessibility #Colour #AcademicCommunityContribution #ACC
1/n
fabiocrameri.ch/colourmaps
#useBatlow
#ScientificVisualisation #visualisation #Science #ColourPalette #DataVis #GraphicDesign
#OpenSource #Accessibility #Colour #AcademicCommunityContribution #ACC
1/n

🕵️ Why are they cool?
· Perceptually uniform
· Perceptually ordered
· Colour-blind friendly
· Readable as B&W print
· Highly compatible
· Versioned & citable
· Perceptually uniform
· Perceptually ordered
· Colour-blind friendly
· Readable as B&W print
· Highly compatible
· Versioned & citable
🧑🎤 What‘s new?
· #glasgow, #lipari, #navia & #managua
· Improvements to existing palettes
· More formats (e.g., .pal for ODV)
· Colour hand-picker for discrete & categorical palettes
See details about all new additions:
fabiocrameri.ch/colourmaps-use…


· #glasgow, #lipari, #navia & #managua
· Improvements to existing palettes
· More formats (e.g., .pal for ODV)
· Colour hand-picker for discrete & categorical palettes
See details about all new additions:
fabiocrameri.ch/colourmaps-use…


How to create dumbbell plots with ggplot2
Impress clients, make the complex simple and up your data vis game.
#rstats #datavis #datascience
Impress clients, make the complex simple and up your data vis game.
#rstats #datavis #datascience

Dumbbell plots are a great way of communicating information that can be grouped then split into two points.
I used one for TidyTuesday earlier this year:
github.com/neilcuz/tidytu…
But making them can be a little tricky.
I can show you how step-by-step.
I used one for TidyTuesday earlier this year:
github.com/neilcuz/tidytu…
But making them can be a little tricky.
I can show you how step-by-step.
Dumbbell plots can be created using 2 ggplot2 building blocks: geom_point and geom_line.
So let's start building from the ground up with some examples in each before combining to make a dumbbell plot.
So let's start building from the ground up with some examples in each before combining to make a dumbbell plot.
🚨New Pub🚨
Love #WOTUS & #CleanWaterAct? Us too! A state-wide analysis of #wetland protections in #NewYork
New pub from @JeffWadeHydro @hydrochrista @BeckySchewe30 dropped today in @HydroProcesses
Key findings 🧵
doi.org/10.1002/hyp.14…
Love #WOTUS & #CleanWaterAct? Us too! A state-wide analysis of #wetland protections in #NewYork
New pub from @JeffWadeHydro @hydrochrista @BeckySchewe30 dropped today in @HydroProcesses
Key findings 🧵
doi.org/10.1002/hyp.14…
We ask how changes to the legal definition of #WOTUS under the Clean Water Rule & Navigable Waters Protection Rule alter which wetlands are protected as a function of landscape position and size, taking New York as our case study (largest geographic analysis to date)
Methods for landscape analysis follow closely after existing studies, largely this one from @RileyKWalsh
doi.org/10.3389/frwa.2…
doi.org/10.3389/frwa.2…
I'm super excited to share my 1st first-author paper now out in @ScienceMagazine, where we tackle an age-old question in microbiology: How do dormant spores decide to wake up? Turns out that they can count in their sleep using electricity!😴⚡️
science.org/doi/10.1126/sc…
science.org/doi/10.1126/sc…
Bacterial spores are a special type of cell that look and function like microscopic plant seeds: a hyper-resilient DNA bunker that aims to weather bad conditions and reemerge in a better future. They are metabolically dormant, and by all practical means, pretty much dead.
Because of their extreme resistance to most stresses (like heat, UV, dryness, antibiotics), gaining a better understanding of spores has huge implications in healthcare, food safety, and biotechnology.
How to create dumbbell plots with ggplot2
Impress clients, communicate complex insights simply and up your data vis game.
👇🧵
#rstats #datavis
Impress clients, communicate complex insights simply and up your data vis game.
👇🧵
#rstats #datavis

Dumbbell plots are a great way of communicating information that can be grouped then split into two points.
I used one for last weeks TidyTuesday
github.com/neilcuz/tidytu…
But making them can be a little tricky.
I can show you how step-by-step.
1/15
I used one for last weeks TidyTuesday
github.com/neilcuz/tidytu…
But making them can be a little tricky.
I can show you how step-by-step.
1/15
Dumbbell plots can be created using 2 ggplot2 building blocks: geom_point and geom_line.
So let's start building from the ground up with some examples in each before combining to make a dumbbell plot.
2/15
So let's start building from the ground up with some examples in each before combining to make a dumbbell plot.
2/15
An interactive visualization of killings by police over time, categorized by race and armed/unarmed status. Includes filters for race, year, state, armed status, and encounter type. Feedback welcome. #datavis public.tableau.com/views/PoliceKi…
Source: mappingpoliceviolence.org
Interesting tidbit: an oft-repeated claim is that cops kill people at ordinary traffic stops. Digging into the data, it's quite apparent that more often than not the person killed was armed.
public.tableau.com/shared/GKFKBQT…
public.tableau.com/shared/GKFKBQT…

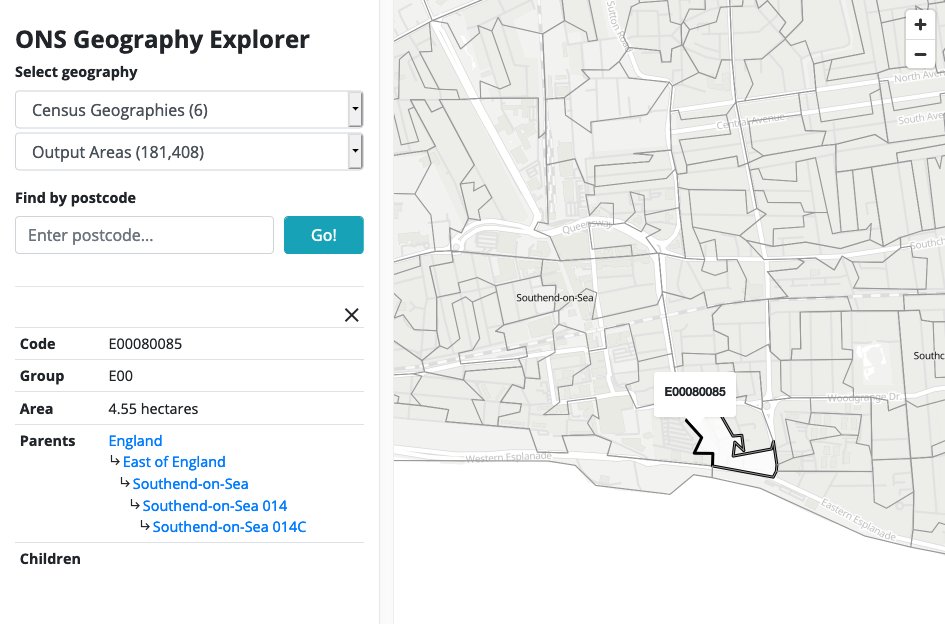
1/ Nerdy thread... I recently put together this tool for exploring @ONS statistical geographies & administrative regions for England & Wales. It's one of various prototypes that we're working on in the #DataVis team in thinking how to visualise @Census2021 bothness.github.io/geo-explorer/
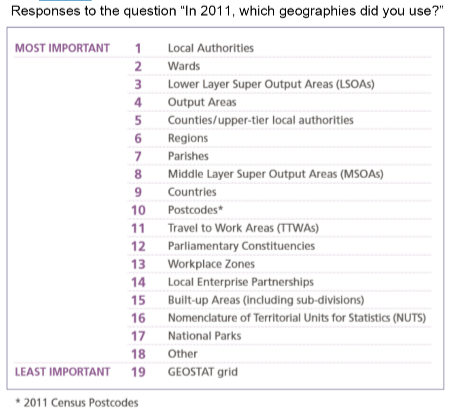
2/ Since joining @ONS a few months ago, I've been trying to make sense of the MANY geographies are used to report data across the UK, from neighbourhood level all the way up to national level, and to be honest it's been a challenge. Here's a list from the 2011 Census... 
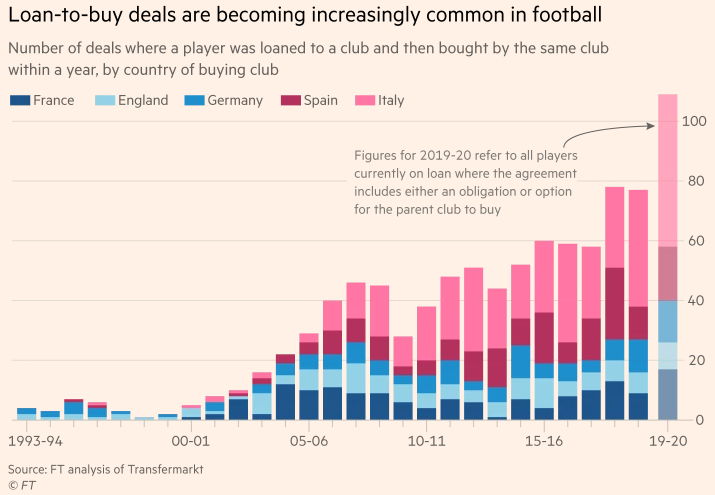
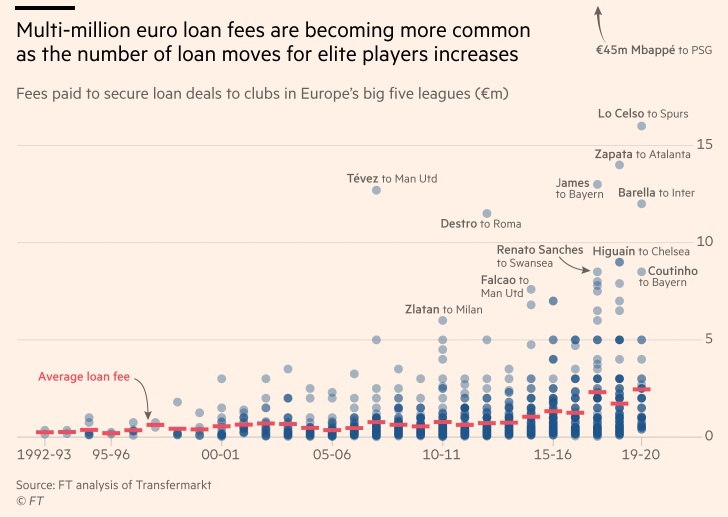
Our latest @FT long read: how loans are reshaping European football's transfer market.
"Loan-to-buy" deals carry less financial risk. New clauses ensure loaned players are guaranteed more minutes. But clampdown on abuses of loan system is also likely.
ft.com/content/9bd82b…
"Loan-to-buy" deals carry less financial risk. New clauses ensure loaned players are guaranteed more minutes. But clampdown on abuses of loan system is also likely.
ft.com/content/9bd82b…
@FT ...featuring more brilliant #datavis by @jburnmurdoch such as...
1: showing how loan-to-buy deals are becoming more common @FT ...
1: showing how loan-to-buy deals are becoming more common @FT ...
@FT @jburnmurdoch ... 2: How bigger loan fees involving more star players are also on the rise... @FT 
Não deu pra ir no #codabr18? Foi, mas queria mesmo era se clonar pra ver as muitas atividades simultâneas? A gente reuniu quase 40 apresentações e recursos didáticos usados nas mesas, bootcamps e workshops! Conhecimento bom é conhecimento aberto! #ddj escoladedados.org/2018/11/21/apr…
Vamos revisitar aos poucos as apresentações do #CodaBr18 :
Na abertura, o @albertocairo abordou a democratização da visualização de dados, falando de sua busca para que esta prática se torne uma linguagem universal 🌐
drive.google.com/file/d/1PrDaDB…
Na abertura, o @albertocairo abordou a democratização da visualização de dados, falando de sua busca para que esta prática se torne uma linguagem universal 🌐
drive.google.com/file/d/1PrDaDB…
Já @viegasf falou de suas pesquisas sobre inteligência artificial, #dataviz e inovação no Google. Aqui, você confere a oficina que ela deu sobre Interpretação e Fairness em Machine Learning
bit.ly/mlfairness-coda
bit.ly/mlfairness-coda
1 #BOU18TC
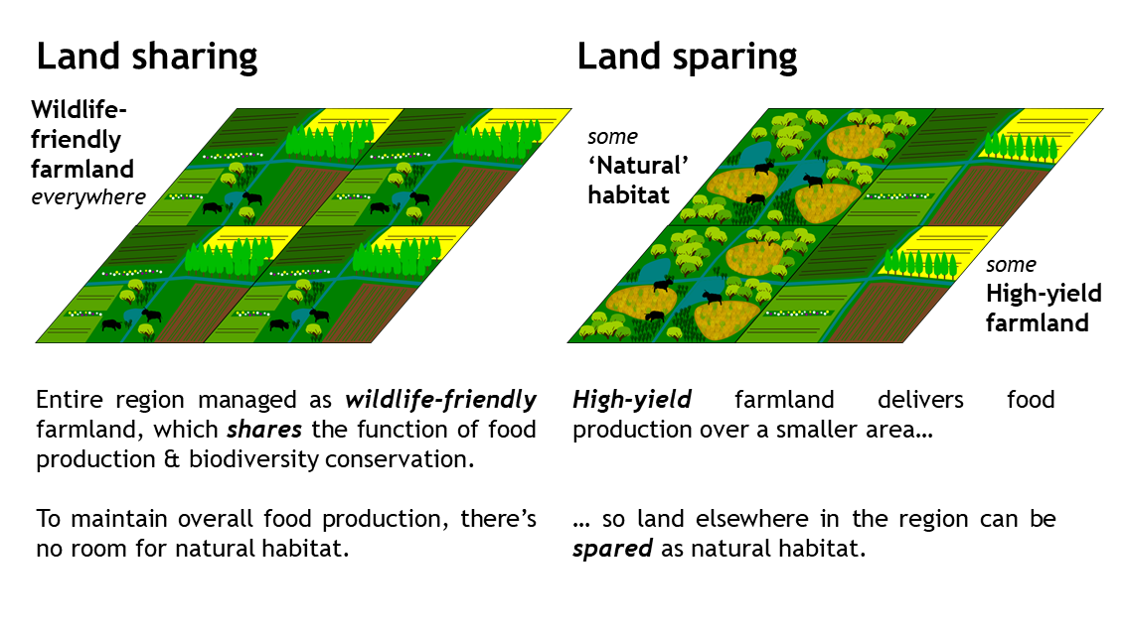
Often, conservation competes with food production by promoting less intensive farming and/or unfarmed reserves
Given that food production is essential for human wellbeing, what’s the best way of reconciling this trade-off?
To share, or spare; that is the question
Often, conservation competes with food production by promoting less intensive farming and/or unfarmed reserves
Given that food production is essential for human wellbeing, what’s the best way of reconciling this trade-off?
To share, or spare; that is the question
2 #BOU18TC
We compared land sharing and land sparing scenarios (+ intermediate ones) all of which, crucially, produce the *same amount of food* overall.
We also evaluated a ‘three compartment sparing’ scenario (far right) which combines elements of both sharing and sparing
We compared land sharing and land sparing scenarios (+ intermediate ones) all of which, crucially, produce the *same amount of food* overall.
We also evaluated a ‘three compartment sparing’ scenario (far right) which combines elements of both sharing and sparing

3 #BOU18TC
We used density-yield curves to estimate the regional population size of breeding birds under each scenario.
We fitted these curves separately for breeding birds in 2 regions of southern England: The Fens & Salisbury Plain
#ornithology
We used density-yield curves to estimate the regional population size of breeding birds under each scenario.
We fitted these curves separately for breeding birds in 2 regions of southern England: The Fens & Salisbury Plain
#ornithology

