Discover and read the best of Twitter Threads about #ArcticFires
Most recents (24)
Summarising 18 years of the distribution & intensity of June-August #ArcticFires & boreal #wildfires with @CopernicusECMWF Atmosphere Monitoring Service @ECMWF Global Fire Assimilation System #opendata confluence.ecmwf.int/display/CKB/CA…
More on 2020 monitoring➡️ atmosphere.copernicus.eu/copernicus-rev…
More on 2020 monitoring➡️ atmosphere.copernicus.eu/copernicus-rev…
Analyses of organic matter aerosol optical depth, based on 🛰️ obs, showing large-scale smoke transport around N Hemisphere from #Siberia #ArcticFires (& #CaliforniaFires) between 1 Aug to 2 Sept 2020. @CopernicusECMWF Atmosphere Monitoring Service @ECMWF atmosphere.copernicus.eu
#ArcticFires were very active in first week of August 2020 but reduced to more usual activity for most of the month with slight increase as summer came to an end. #opendata from #CopernicusAtmosphere Global Fire Assimilation System based on MODIS 🛰️ obs confluence.ecmwf.int/display/CKB/CA… 


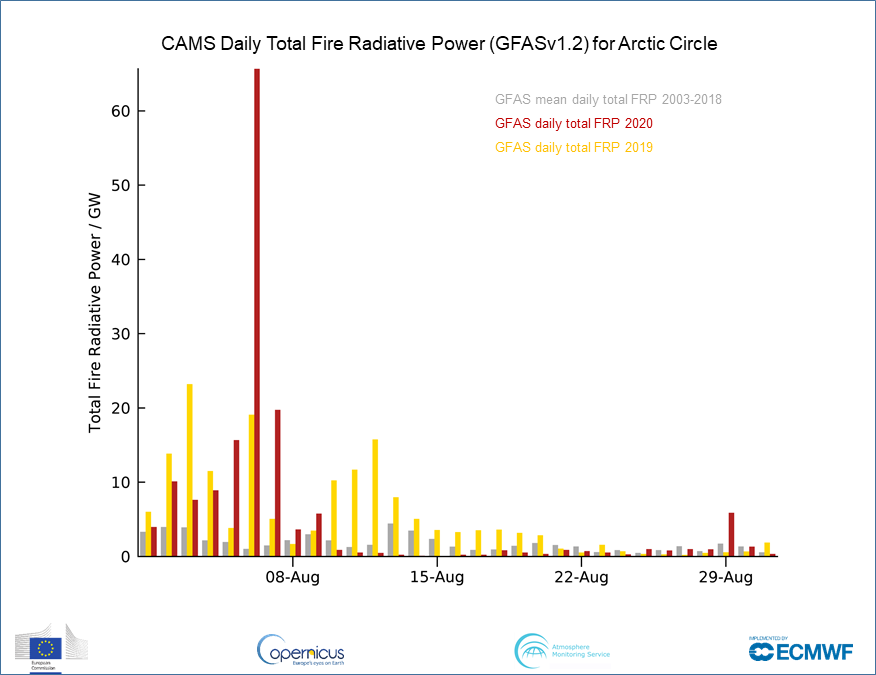

Peak #ArcticFires activity seems a long time ago but Sakha Republic & Chukotka🇷🇺still experiencing above average daily total #wildfire intensity for late August in #CopernicusAtmosphere GFAS data to 24/08. #TerraMODIS🛰️imagery shows continuation on 25/08 go.nasa.gov/3ldIDKV 


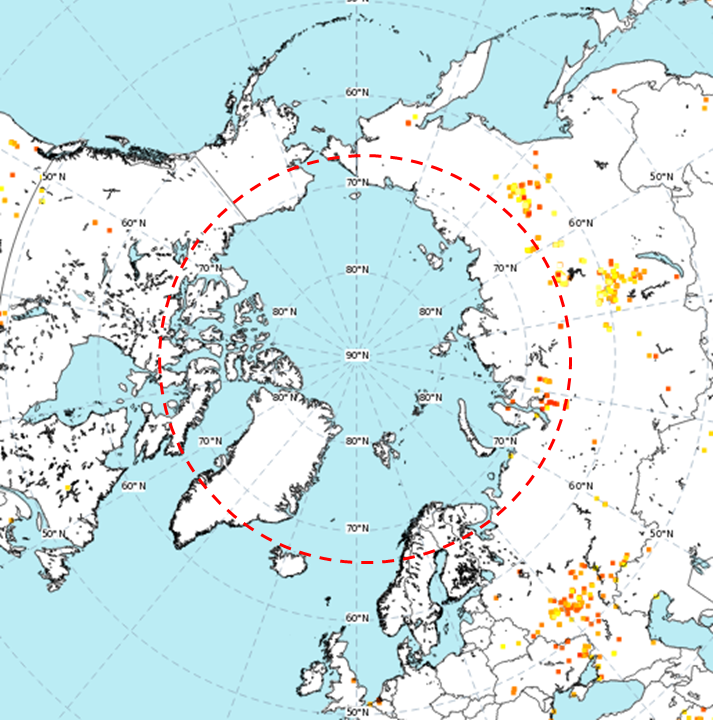
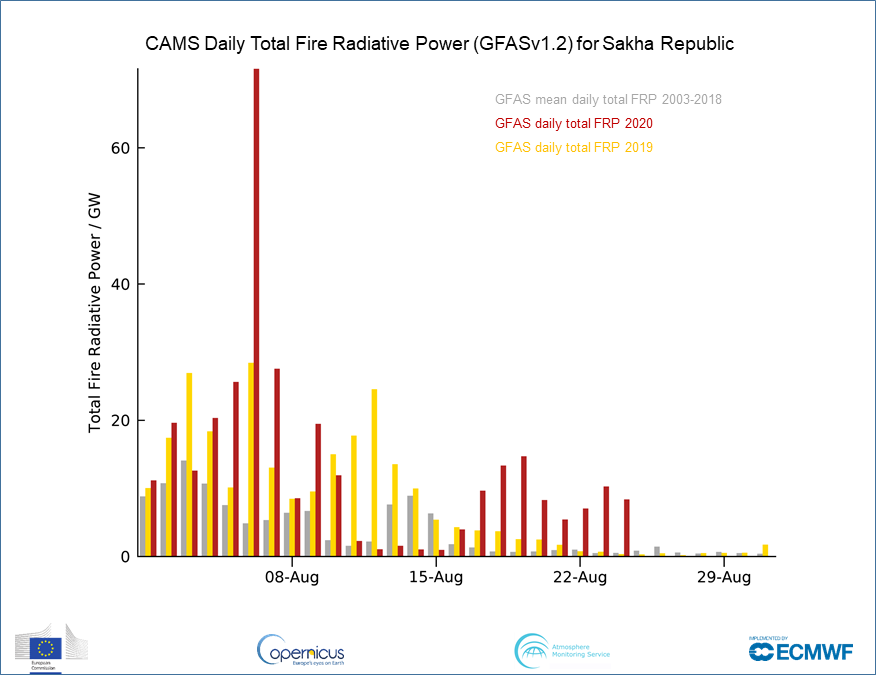
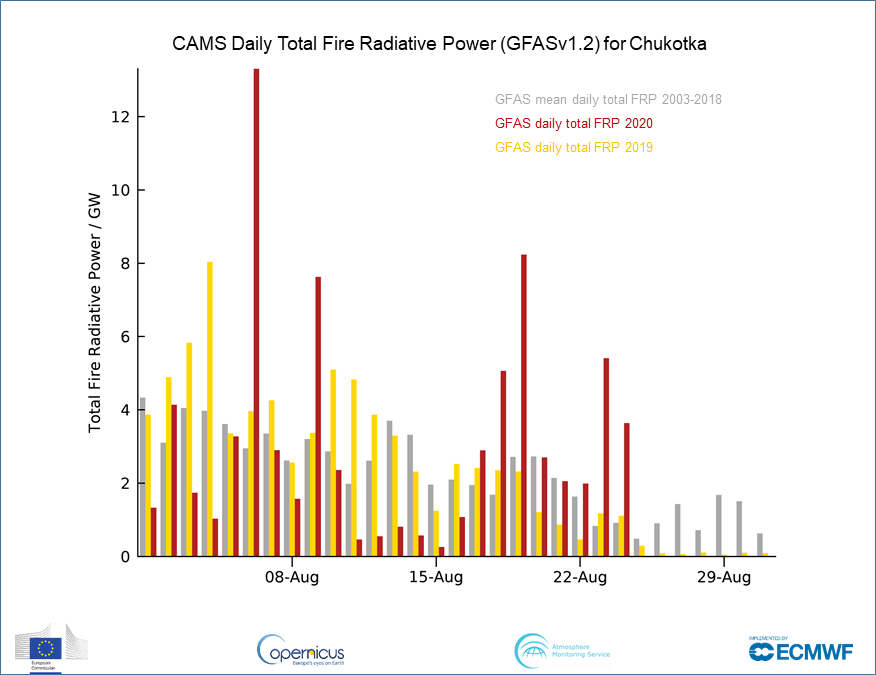

#Wildfire activity in other parts of #Siberia has been relatively low all summer. Krasnoyarsk & Irkustk have been experiencing increased daily total intensity over last 2 weeks close to 2003-2018 mean & << 2019. 


Global Fire Assimilation System data based on MODIS obs (only Terra available since 17 August)➡️ confluence.ecmwf.int/display/CKB/CA…
Latest maps➡️ atmosphere.copernicus.eu/charts/cams/fi…
NASA imagery➡️ go.nasa.gov/3ldIDKV
Latest maps➡️ atmosphere.copernicus.eu/charts/cams/fi…
NASA imagery➡️ go.nasa.gov/3ldIDKV
Greatly reduced #ArcticFires over the last week in #CopernicusAtmosphere GFAS data as the season starts to change although latest map atmosphere.copernicus.eu/charts/cams/fi… shows several continuing active #wildfires in #Siberia south of the #ArcticCircle 


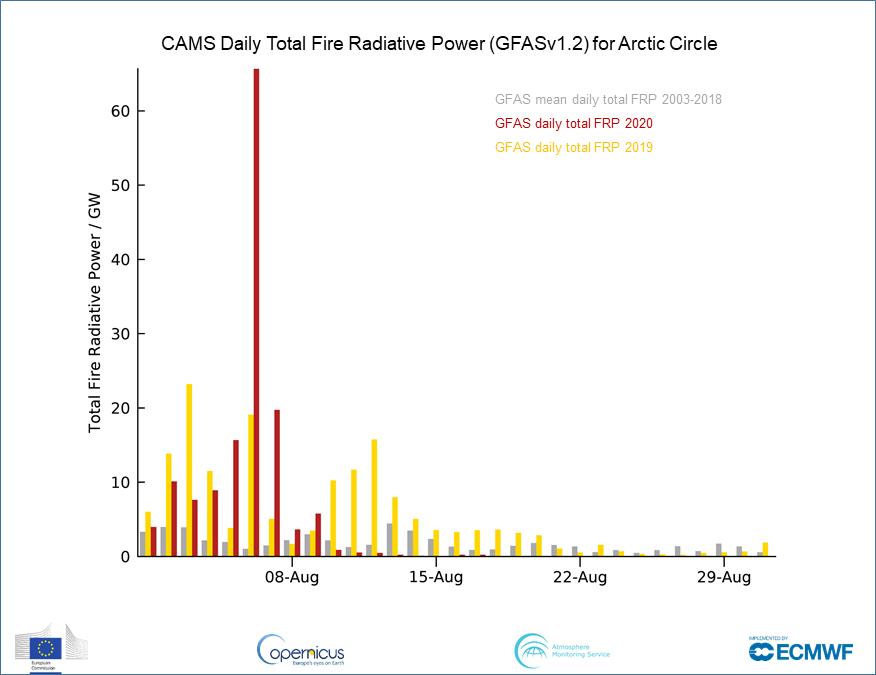
Have we seen the end of this year's #ArcticFires? Cloud still limits🛰️obs but #ArcticCircle #wildfires expected to die down in 2nd half August based on 18 years of #CopernicusAtmosphere Monitoring Service GFAS data. 240 Mt CO2 since 1 June 2020 higher than previous annual totals. 


Latest GFAS charts➡️ atmosphere.copernicus.eu/charts/cams/fi…
NASA worldview imagery➡️ go.nasa.gov/3kE6fbg
NASA worldview imagery➡️ go.nasa.gov/3kE6fbg
Cloud affecting NASA #AquaMODIS🛰️obs go.nasa.gov/3h6C7mA & daily intensity of #ArcticCircle #wildfires possibly leading to last few days of 2020 #ArcticFires if following 2019 & 2003-2018 average in #CopernicusAtmosphere Monitoring Service GFAS data confluence.ecmwf.int/display/CKB/CA… 


Comparing #wildfires in different regions of #Siberia & far eastern #Russia since between 1 June to 11 August shows #ArcticFires differences between 2020 & 2019: most activity in Sakha Republic (&Chukotka) but much less activity in Krasnoyarsk & Irkutsk. 


Another big increase in daily total #Arctic #wildfire intensity & smoke emissions in latest #CopernicusAtmosphere Monitoring Service GFAS #opendata➡️ confluence.ecmwf.int/display/CKB/CA…. @JPSSProgram
#VIIRS🛰️ imagery shows similar picture today go.nasa.gov/39nYcKu #ArcticFires


#VIIRS🛰️ imagery shows similar picture today go.nasa.gov/39nYcKu #ArcticFires


Early August #ArcticFires continuing at similar daily total intensity to 2019 in #CopernicusAtmosphere Monitoring Service GFAS data confluence.ecmwf.int/display/CKB/CA…. Latest CO forecast atmosphere.copernicus.eu/charts/cams/ca… shows high values over #Siberia & residual smoke over NE Canada & N Atlantic 


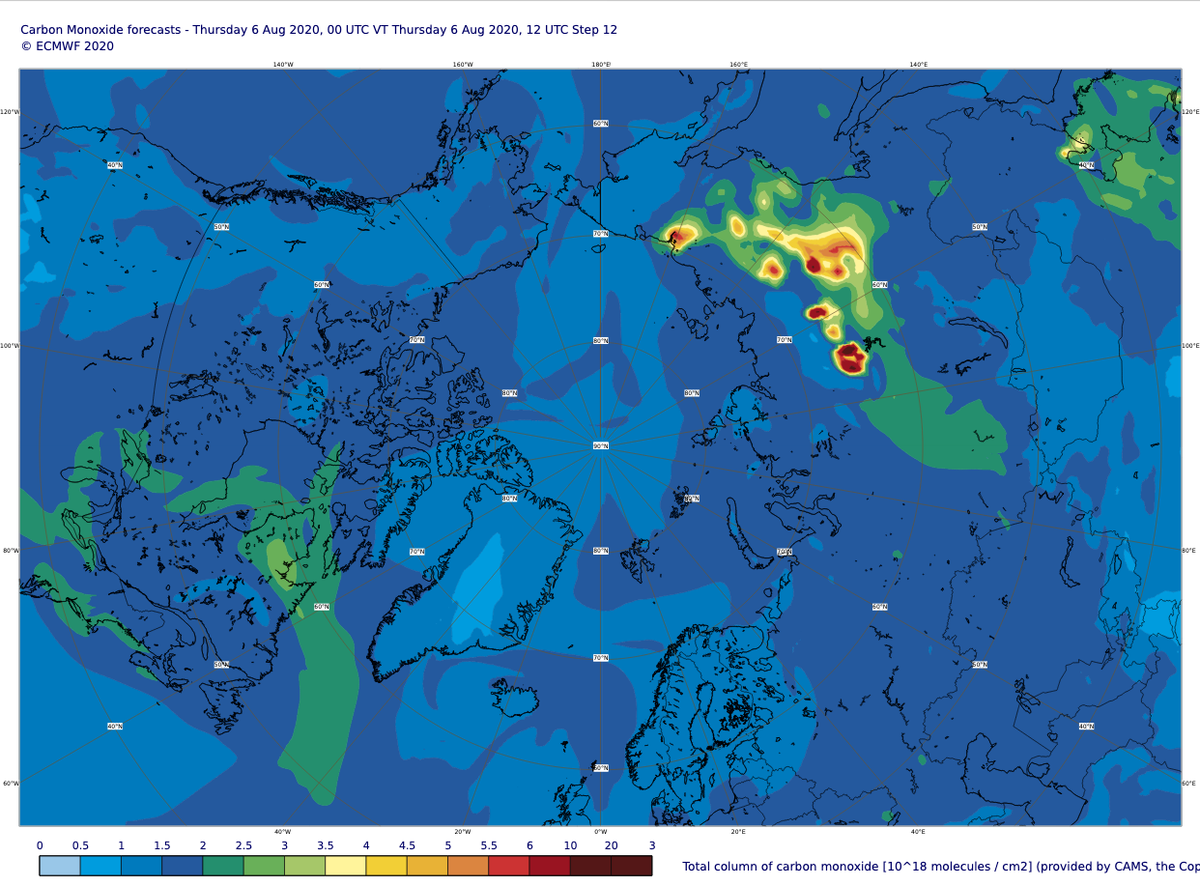
High values of total column CO over Hudson Bay but mid-troposphere (~5km altitude) concentrations show smoke from #ArcticFires already across N Atlantic & N+W Europe in latest #CopernicusAtmosphere Monitoring Service 12-hour forecast. More charts➡️atmosphere.copernicus.eu/charts/cams/ca… 


New precedent in scale & intensity of #Siberia/#Arctic #wildfires compared to previous 17 years in the #Copernicus Atmosphere Monitoring Service GFAS data based on MODIS obs confluence.ecmwf.int/display/CKB/CA… (145 Mt CO2 in July 2020 vs. 182 Mt CO2 total for 2019) #ArcticFires 


Daily cumulative estimated #ArcticCircle #wildfire carbon emissions for 2020 (red) were already increasing faster than in 2019 (gold) but increased significantly in the 2nd half of July 

Comparing the annual total estimated #wildfire CO2 emissions for the #ArcticCircle from 2003 to 2020 (up to 31 July 2020) shows that this year is already the highest for the region in the GFAS dataset. 

Massive smoke plume with very high values of total column carbon monoxide transported from #ArcticFires across Bering Strait to Alaska & Canada over next few days in latest @CopernicusECMWF Atmosphere Monitoring Service @ECMWF forecast atmosphere.copernicus.eu/charts/cams/ca… @CopernicusEU
@ESA_EO @eumetsat @Atmospheric_SAF @NASAEarth @AerosolWatch @VHPeuch @RichardJEngelen @AntjeInness @Mel_Ades @henk_eskes @SanGasso @jingqiumao @AlaskaWx @AKfirescience @environmentca @CanadaWildfire @eyeonthearctic @polarprediction @_Arctic_Circle @wildfiretoday @IAWF @defis_eu
Interesting to note low pressure system to north of Chukchi & East Siberian Seas leading to recirculation of smoke back to Siberia via N Pole. Leading edge could reach northern Greenland towards the weekend.
July 2020 has witnessed escalation in #ArcticFires previously unseen in #CopernicusAtmosphere Monitoring Service GFAS data. #ArcticCircle daily total FRP >> 2019 & July total estimated #wildfire carbon emissions almost double 2019 (2019 annual total was 50 megatonnes carbon). 


First, (very) rough, look at estimated surface deposition of black carbon over the #Arctic Ocean from 21-24 July with #CopernicusAtmosphere Monitoring Service model output. Clear increase (> 0.1 mg/m2) across Chukchi Sea region originating from #Siberian #ArcticFires 

*units are micrograms per square metre
Friday deep dive into #ArcticFires of Siberia, focusing on the 8,000+ fires detected by MODIS & VIIRS satellites between May 2020 and mid-July 2020 at latitudes above 70°N. (A thread). 

Important to note that Arctic fire regimes are not novel, but seem to be increasing in number. Here, @iccinet Climate Change Intern and @StOlaf undergraduate student, @BradenPohl, maps fires for last 3 years in northern Krasnoyarsk Krai and Sakha Republic. 

Continuing extreme daily total #Arctic #wildfire intensity & smoke emissions in latest #CopernicusAtmosphere Monitoring Service GFAS #opendata➡️ confluence.ecmwf.int/display/CKB/CA…. @JPSSProgram #VIIRS🛰️ imagery shows similar picture to previous days go.nasa.gov/39nYcKu #ArcticFires 


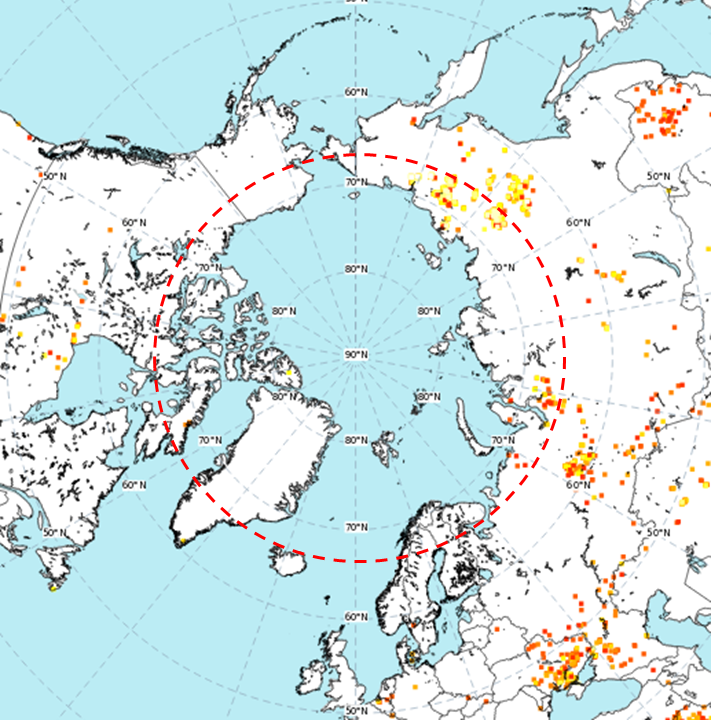


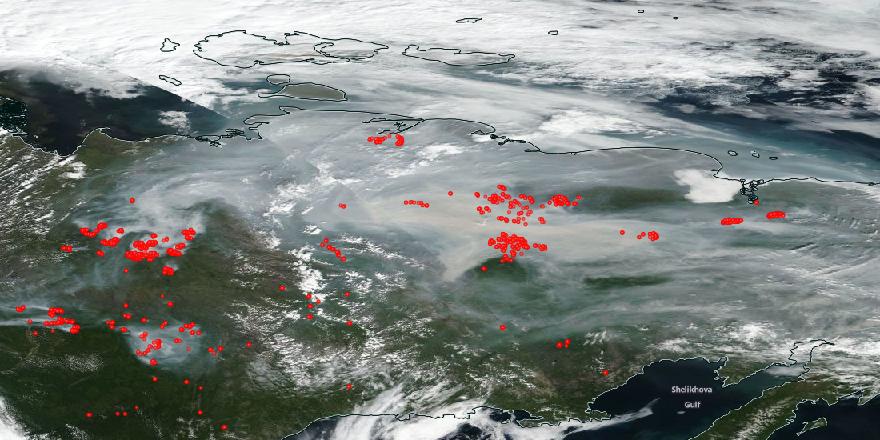
Another big increase in #ArcticCircle daily total #wildfire radiative power on 21 July, well above 2019 max daily total, with July total estimated carbon emissions almost catching up to 2019. #CopernicusAtmosphere Monitoring Service GFAS data confluence.ecmwf.int/display/CKB/CA… #ArcticFires 


#AquaMODIS visible imagery for 22 July shows the spatial extent of the fire activity is continuing, producing vast amounts of smoke, & another possible increase in the fire monitoring tomorrow. 

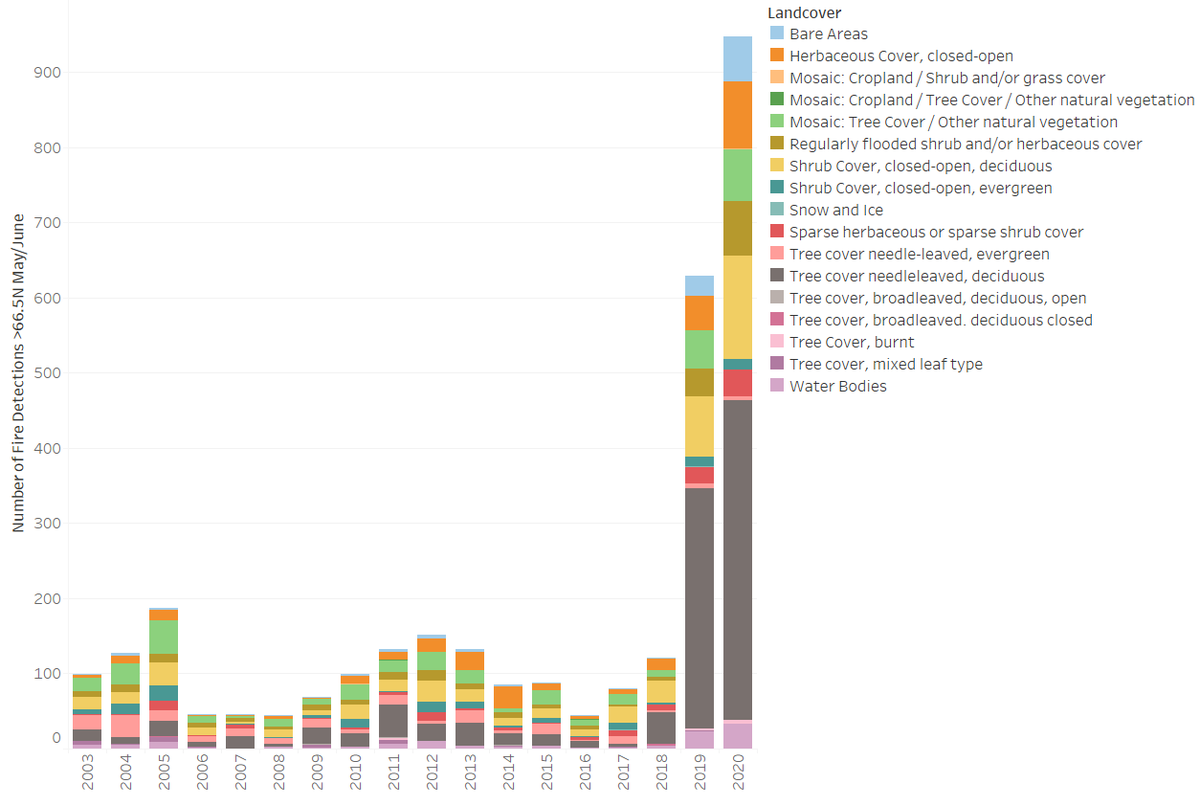
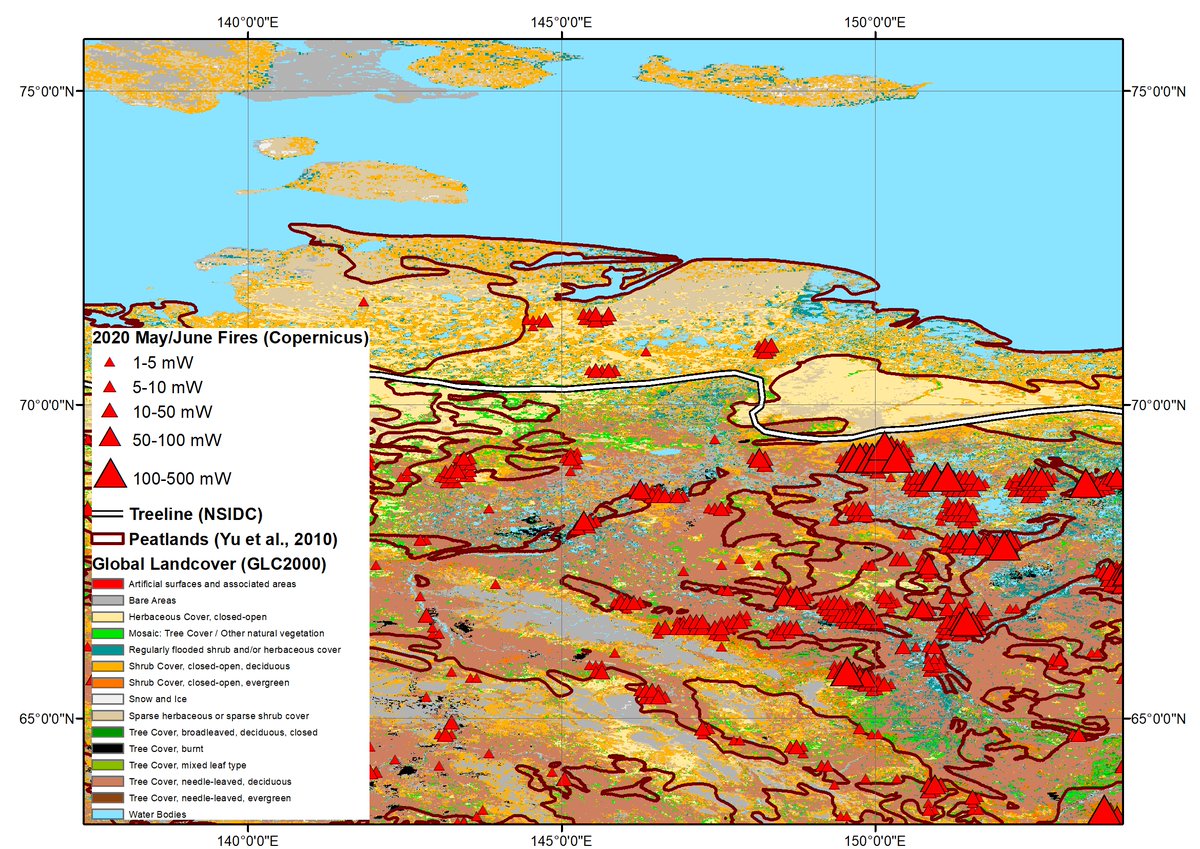
New spatial analysis of wildfires across the Arctic in May/June 2020, and how they compare to the satellite record (2003-2020). What is burning? Are there peat fires? What about permafrost? 🔥🛰️thread in collab with @m_parrington @CopernicusECMWF #ArcticFires [1/9] 

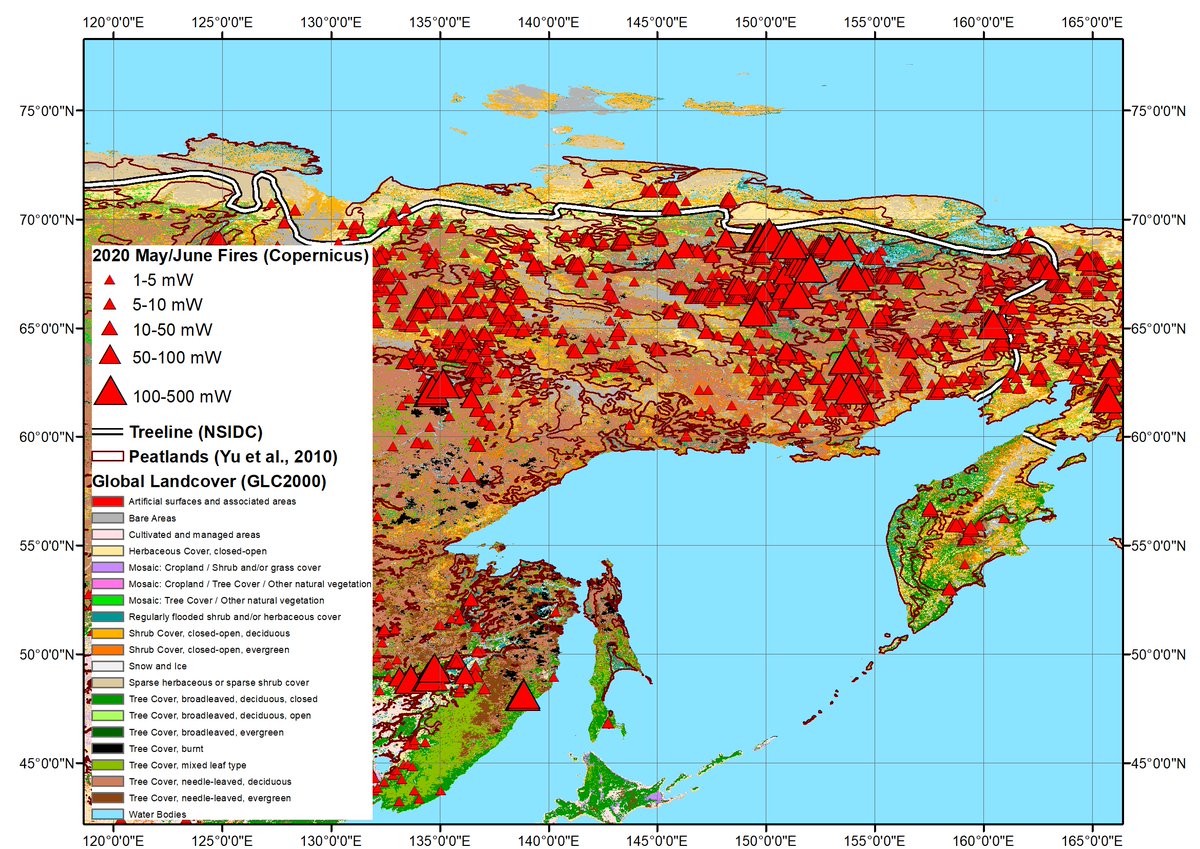
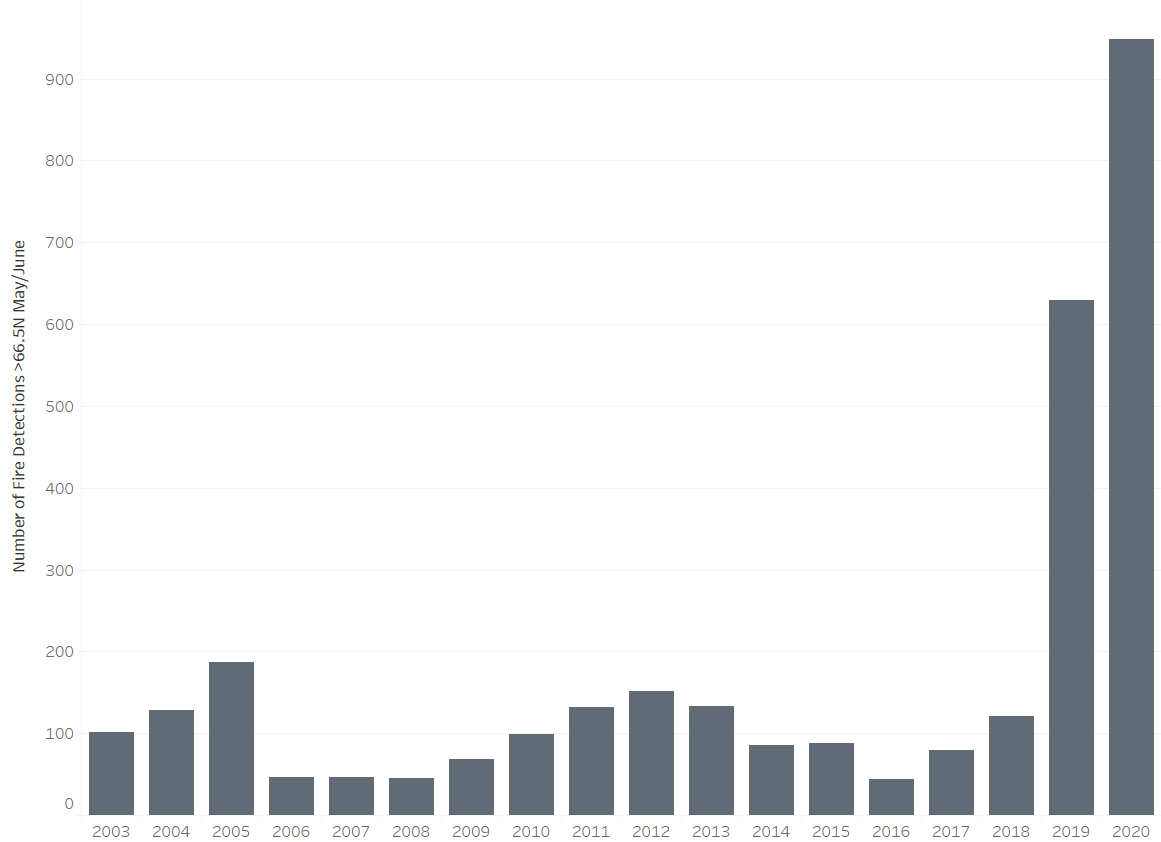
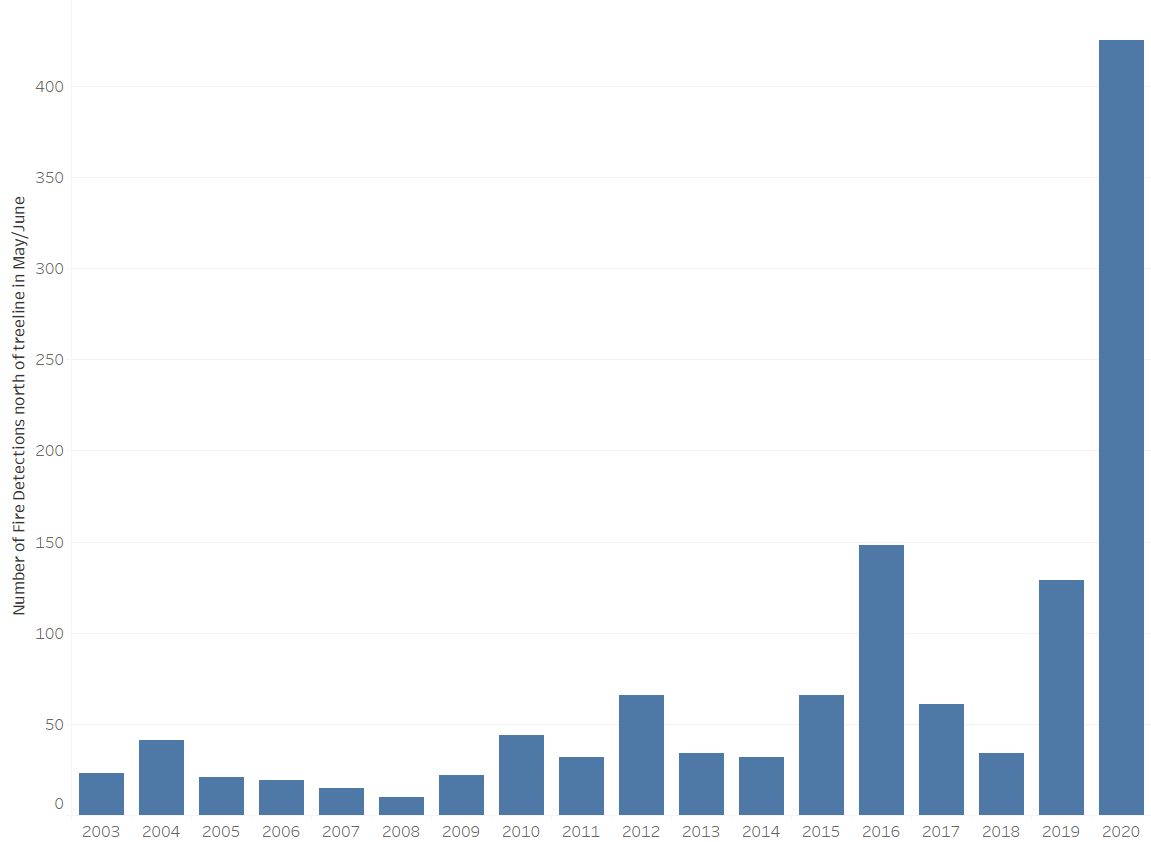
The Arctic Circle is an ecologically arbitrary line, so I also investigated fires burning north of the treeline, using @NSIDC's tundra & boreal forest boundary, a better representation of the Arctic Zone. May/June 2020 saw 10x more fires than 2003-18 average for this zone. [2/9] 

Large cluster of active #Siberian #ArcticCircle #wildfires clearly visible in NASA #AquaMODIS🛰️ imagery on 20&21 July go.nasa.gov/3fO8Qg4 causing another huge leap in Arctic daily total fire intensity in #CopernicusAtmosphere Monitoring Service GFAS #OpenData #ArcticFires 


Latest maps and more info on #CopernicusAtmosphere Monitoring Service GFAS data available from:
➡️atmosphere.copernicus.eu/charts/cams/fi…
➡️confluence.ecmwf.int/display/CKB/CA…
#opendata @EU_opendata
➡️atmosphere.copernicus.eu/charts/cams/fi…
➡️confluence.ecmwf.int/display/CKB/CA…
#opendata @EU_opendata
Mid-July view of #Siberia/#ArcticCircle #wildfires with #CopernicusAtmosphere Monitoring Service GFAS #opendata. Arctic daily total intensity > 2003-2018 mean & 1-15 July total estimated carbon emissions highest in 18 years of GFAS data (2004 due to Alaska fires) #ArcticFires 


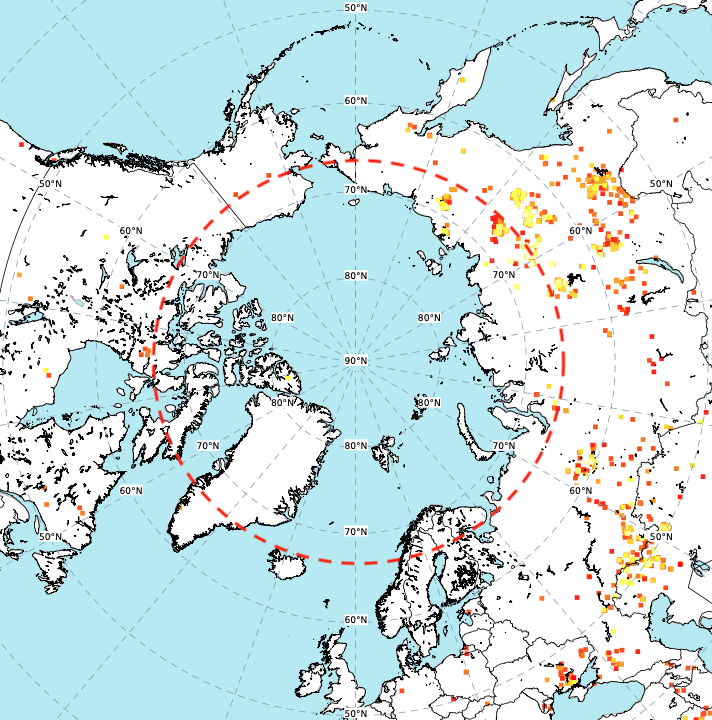


Increased #Siberia/#ArcticCircle #wildfire detections on 12 July atmosphere.copernicus.eu/charts/cams/fi…➡️ jump in #CopernicusAtmosphere Monitoring Service GFAS daily total intensity. #TerraMODIS🛰️ imagery on 13th shows continuation + smoke over Arctic Ocean go.nasa.gov/3epgOL8 #ArcticFires 


High values of aerosol optical depth from #Siberia/#Arctic #wildfires crossing Laptev Sea & heading toward Svalbard🇳🇴 in the coming days in latest #CopernicusAtmosphere Monitoring Service forecast atmosphere.copernicus.eu/charts/cams/ae… @CopernicusECMWF @ECMWF @CopernicusEU #ArcticFires
Note also possible plume of dust aerosol originating from Caspian Sea region and reaching NW Russia.
Cloud over E #Siberia limiting MODIS🛰️ active #wildfire obs over last few days go.nasa.gov/31XAMKo, with reduced daily intensity #ArcticFires in #CopernicusAtmosphere Monitoring Service GFAS data atmosphere.copernicus.eu/charts/cams/fi… over last 3-4 days, may increase again with clear skies 


A long smoke plume from #Siberia #wildfires was predicted to reach the North Pole in forecasts of aerosol optical depth & total column carbon monoxide initialized at 00z on 1 July 2020 from the #Copernicus Atmosphere Monitoring Service atmosphere.copernicus.eu/charts/cams/?f… #ArcticFires 


@VHPeuch @RichardJEngelen @Pierre_Markuse @DrTELS @jmccarty_geo @JChimotScience @cwiedinm @steverarnold @ACRoBEARArctic @arctic_today @ArcRCC_N @_Arctic_Circle @polarprediction @ScottDuncanWX @OroraTech @tonyveco @annamaria_84 @defis_eu
The scale & intensity of #Siberia/#Arctic #wildfires in June 2020 has been greater than the 'unprecedented' activity of June 2019 in #Copernicus Atmosphere Monitoring Service GFAS data based on MODIS🛰️obs confluence.ecmwf.int/display/CKB/CA… (total of 16 Mt C ≈ 59 Mt CO2) #ArcticFires 


