Discover and read the best of Twitter Threads about #AquaMODIS
Most recents (7)
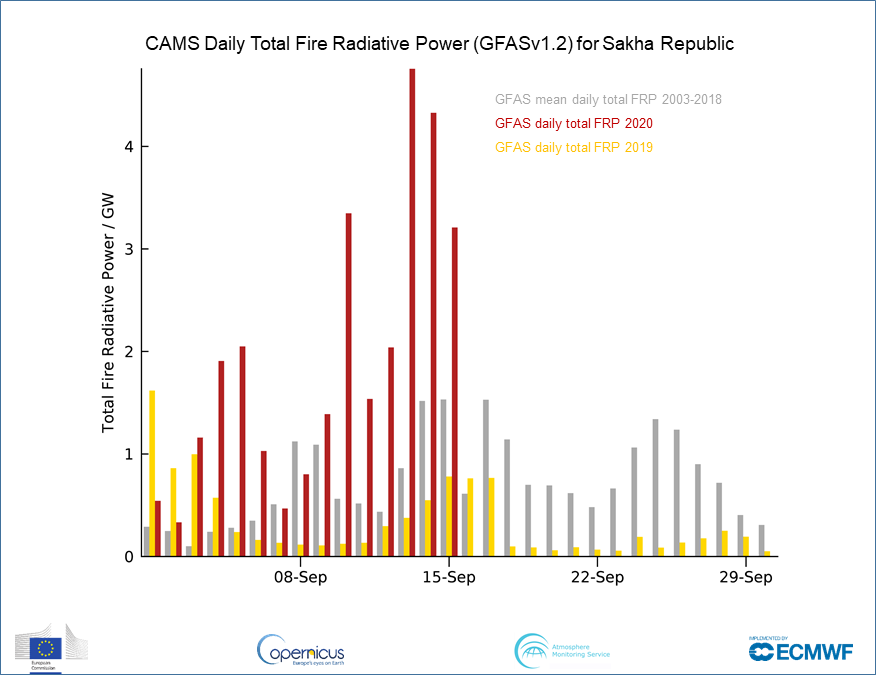
Late season #wildfires & smoke degrading local surface PM2.5 #airquality around Yakutsk & Sakha Republic, Russia in #CopernicusAtmosphere GFAS data & 24-h forecast visualized by @windyforecast windy.com/-PM2-5-pm2p5?c… & #AquaMODIS🛰️ imagery go.nasa.gov/2E6r3Yy 


Cloud affecting NASA #AquaMODIS🛰️obs go.nasa.gov/3h6C7mA & daily intensity of #ArcticCircle #wildfires possibly leading to last few days of 2020 #ArcticFires if following 2019 & 2003-2018 average in #CopernicusAtmosphere Monitoring Service GFAS data confluence.ecmwf.int/display/CKB/CA… 


Comparing #wildfires in different regions of #Siberia & far eastern #Russia since between 1 June to 11 August shows #ArcticFires differences between 2020 & 2019: most activity in Sakha Republic (&Chukotka) but much less activity in Krasnoyarsk & Irkutsk. 


Another big increase in #ArcticCircle daily total #wildfire radiative power on 21 July, well above 2019 max daily total, with July total estimated carbon emissions almost catching up to 2019. #CopernicusAtmosphere Monitoring Service GFAS data confluence.ecmwf.int/display/CKB/CA… #ArcticFires 


#AquaMODIS visible imagery for 22 July shows the spatial extent of the fire activity is continuing, producing vast amounts of smoke, & another possible increase in the fire monitoring tomorrow. 

Large cluster of active #Siberian #ArcticCircle #wildfires clearly visible in NASA #AquaMODIS🛰️ imagery on 20&21 July go.nasa.gov/3fO8Qg4 causing another huge leap in Arctic daily total fire intensity in #CopernicusAtmosphere Monitoring Service GFAS #OpenData #ArcticFires 


Latest maps and more info on #CopernicusAtmosphere Monitoring Service GFAS data available from:
➡️atmosphere.copernicus.eu/charts/cams/fi…
➡️confluence.ecmwf.int/display/CKB/CA…
#opendata @EU_opendata
➡️atmosphere.copernicus.eu/charts/cams/fi…
➡️confluence.ecmwf.int/display/CKB/CA…
#opendata @EU_opendata
First look at #Arctic Circle #wildfires for 2020 with #Copernicus Atmosphere Monitoring Service GFAS data confluence.ecmwf.int/display/CKB/CA… following satellite obs. Fairly typical recent fire activity but will increase over next few weeks as 2003-2019 climatology shows #ArcticFires 


Maps show latest GFAS fire radiative power atmosphere.copernicus.eu/charts/cams/fi… and NASA #AquaMODIS visible satellite obs go.nasa.gov/3bEESYY for 18 May 2020.
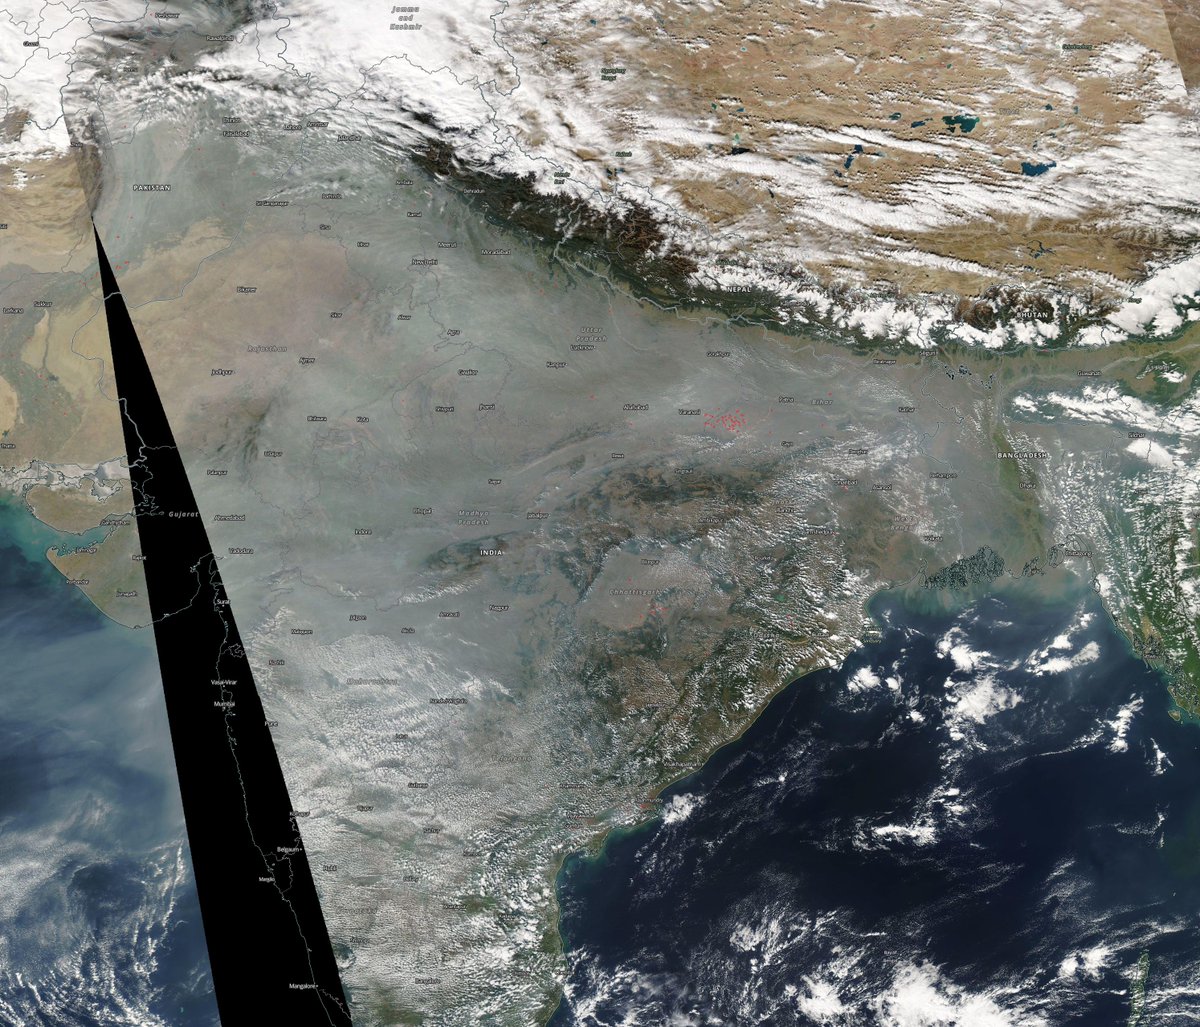
High values of surface PM2.5 & organic matter aerosol contribute to continuing #smog in northern #India as seen in #CopernicusAtmosphere Monitoring Service forecasts at 15z on 10 Dec atmosphere.copernicus.eu/charts/cams/pa… & NASA #AquaMODIS 🛰️ imagery go.nasa.gov/2YyEyWK 


@CopernicusECMWF @ECMWF @CopernicusEU @CopernicusEMS @ESA_EO @eumetsat @Atmospheric_SAF @NASAEarth @airqualityindia @airsouthasia cc @ashimmitra @pallavipnt @hjethva05 @amrit_sharma @UrbanEmissions @iccialtopenburn @jmccarty_geo @SanGasso @EPIC_India @CCACoalition @CEEWIndia @CopernicusLand @Atmospheric_SAF
@CopernicusECMWF @ECMWF @CopernicusEU @CopernicusEMS @ESA_EO @eumetsat @Atmospheric_SAF @NASAEarth @airqualityindia @airsouthasia @ashimmitra @pallavipnt @hjethva05 @amrit_sharma @UrbanEmissions @iccialtopenburn @jmccarty_geo @SanGasso @EPIC_India @CCACoalition @CEEWIndia @CopernicusLand @jksmith34 @CareForAirIndia
Charting daily total intensity of #NSWbushfires since 1 Sept with #CopernicusAtmosphere Monitoring Service GFAS data confluence.ecmwf.int/display/CKB/CA… shows significant increase on 7 November & anticipating more on the 8th based on #AquaMODIS 🛰️ imagery go.nasa.gov/2NwhyUt 


@CopernicusECMWF @ECMWF @CopernicusEU @CopernicusEMS @NASAEarth @WMO @EUinAus @BOM_au @CSIRO @bnhcrc Comparing the total estimated FRP of #NSWbushfires between 1 September and 7 November from 2003 to 2019 reveals the current activity to be at a scale not seen in at least the last 17 years. 

