Discover and read the best of Twitter Threads about #stockstotrade
Most recents (24)
In Technical Analysis, a candlestick pattern is a movement in prices shown graphically on a candlestick chart that some believe can predict a particular market movement.
A thread 🧵 with @Stocktwit_IN & @TradingView_IN
#TechnicalTrades #TradingView
A thread 🧵 with @Stocktwit_IN & @TradingView_IN
#TechnicalTrades #TradingView

History: Some of the earliest technical trading analysis was used to track prices of rice in the 18th century. Much of the credit for candlestick charting goes to Munehisa Homma (1724–1803), a rice merchant from Sakata, Japan who traded in the Ojima Rice market in Osaka
#stocks
#stocks
Formation of the candlestick: Candlesticks are graphical representations of price movements for a given period of time. They are commonly formed by the opening, high, low, and closing prices of a financial instrument.
#priceaction #StocksToTrade
#priceaction #StocksToTrade
The biggest mistake beginners do in #stockmarket is to directly start FnO trading.
I did the same mistake but you can avoid it!
Here is a profitable mean-reverting intraday stocks strategy from @vishalmehta29 that you can begin with.
#StocksToTrade #Nifty #stocks
Read on👇
I did the same mistake but you can avoid it!
Here is a profitable mean-reverting intraday stocks strategy from @vishalmehta29 that you can begin with.
#StocksToTrade #Nifty #stocks
Read on👇

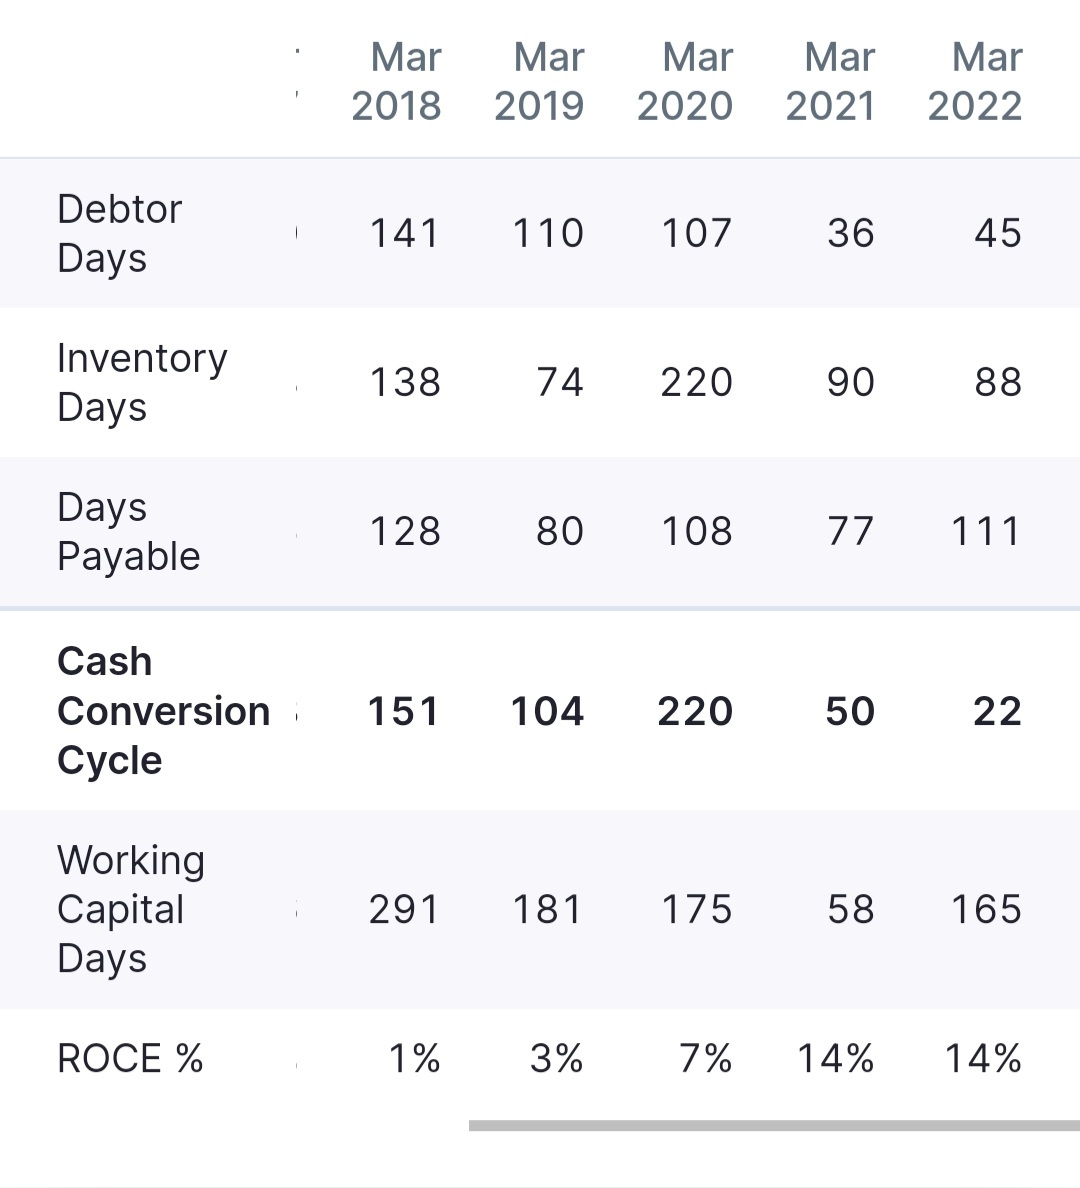
#orchidpharma #stockstobuy #breaoutstocks Long term Invest - Catch me if u can kind of setup with sky as the limit... Its buy n forget #rsistudy #stockstudy #nifty50 #investing #sensex #trading #nse #stocks #stockstotrade #stockmarket #marketing #investing #zerodha
Wkly & Daily BB Blast, Daily EMA COnvergence, Daily Golden Crossover, RSI ND failure has validated PR & Price has closed abv Resistance wth a strong vol candle. There is no res in sight. Still it cud fail so manage position size according to SL.
Rise cud be as furious as the fall n it has potential to be a multibagger - 2650 is the ATH. Funda - ROCE is positive after 5 Yrs for 2 consecutive FY n current is higher then previous/ OPM is Good/ Low Float, Check PE & DE or talk to ur advisor
#stockstobuy #breaoutstocks Long term Invest - Catch me if u can kind of setup with sky as the limit... Its buy n forget #rsistudy #stockstudy #nifty50 #investing #sensex #trading #nse #stocks #stockstotrade #stockmarket #marketing #investing #zerodha 


Wkly & Daily BB Blast, Daily EMA COnvergence, Daily Golden Crossover, RSI ND failure has validated PR & Price has closed abv Resistance wth a strong vol candle. There is no res in sight. Still it cud fail so manage position size according to SL.
Rise cud be as furious as the fall n it has potential to be a multibagger - 2650 is the ATH.
Funda - ROCE is positive after 5 Yrs for 2 consecutive FY n current is higher then previous/ OPM is Good/ Low Float, Check PE & DE or talk to ur advisor
Funda - ROCE is positive after 5 Yrs for 2 consecutive FY n current is higher then previous/ OPM is Good/ Low Float, Check PE & DE or talk to ur advisor
#stockstobuy #breaoutstocks #cashbaskettrading - Wil try to post charts later on the stocks in my watchlist #rsistudy #stockstudy #nifty50 #investing #sensex #trading #nse #stocks #stockstotrade #stockmarket #marketing #investing #zerodha
#eimcoeleco - PDH Break #justdial - PDH Break #carerating - PFH Break #GLS - PDH Break #jaibalaji - IB Break #hudco - PDH Break #akzoindia - PDH Break, #zensar - IB Break, #dynamatech - IB Break, #BLKashyap - PDH Break
Hi Friends,
Sharing some useful #trading threads here
Like & Retweet for Max Reach for learners benefit
it's 100% FREE
by @TechTradesTT & @Stocktwit_IN
1- Technical Analysis, a candlestick pattern -- part 1
#TechnicalTrades #TradingView
Sharing some useful #trading threads here
Like & Retweet for Max Reach for learners benefit
it's 100% FREE
by @TechTradesTT & @Stocktwit_IN
1- Technical Analysis, a candlestick pattern -- part 1
#TechnicalTrades #TradingView
Some Complex candlestick patterns ---- thread Part 2
@KommawarSwapnil @nakulvibhor @Abhishekkar_ @chartmojo @KhapreVishal
@KommawarSwapnil @nakulvibhor @Abhishekkar_ @chartmojo @KhapreVishal
How to create a watch list before market opening- A thread
@tapariachandan @Rishikesh_ADX @kuttrapali26 @ProfitKing7
@tapariachandan @Rishikesh_ADX @kuttrapali26 @ProfitKing7
Moving average is one the simplest indicator which many traders and investor use for technical analysis.
𝗔 𝗧𝗵𝗿𝗲𝗮𝗱 𝗼𝗻 𝗠𝗼𝘃𝗶𝗻𝗴 𝗔𝘃𝗲𝗿𝗮𝗴𝗲 🧵 by @me__kaushik
Retweet ♻ for maximum reach.
𝗔 𝗧𝗵𝗿𝗲𝗮𝗱 𝗼𝗻 𝗠𝗼𝘃𝗶𝗻𝗴 𝗔𝘃𝗲𝗿𝗮𝗴𝗲 🧵 by @me__kaushik
Retweet ♻ for maximum reach.

📍What is Moving Average?
A moving average is a technical indicator that investors and traders use to determine the trend direction of a stock or to determine its support and resistance levels.
It is a trend-following or lagging indicator because it is based on past prices.
A moving average is a technical indicator that investors and traders use to determine the trend direction of a stock or to determine its support and resistance levels.
It is a trend-following or lagging indicator because it is based on past prices.
📍Types of Moving Average
👉 Simple Moving Average (SMA): SMA is a technical indicator calculated by adding the most recent data points in a set and dividing the total by the number of time periods.
👉 Simple Moving Average (SMA): SMA is a technical indicator calculated by adding the most recent data points in a set and dividing the total by the number of time periods.
In Technical Analysis, a candlestick pattern is a movement in prices shown graphically on a candlestick chart that some believe can predict a particular market movement.
thread 🧵 👇 with @valuelevels
& @TradingView_IN
#TechnicalTrades #TradingView
thread 🧵 👇 with @valuelevels
& @TradingView_IN
#TechnicalTrades #TradingView

History:
Some of the earliest technical trading analysis was used to track prices of rice in the 18th century. Much of the credit for candlestick charting goes to Munehisa Homma (1724–1803), a rice merchant from Sakata, Japan who traded in the Ojima Rice market in Osaka
#stocks
Some of the earliest technical trading analysis was used to track prices of rice in the 18th century. Much of the credit for candlestick charting goes to Munehisa Homma (1724–1803), a rice merchant from Sakata, Japan who traded in the Ojima Rice market in Osaka
#stocks
Formation of the candlestick:
Candlesticks are graphical representations of price movements for a given period of time. They are commonly formed by the opening, high, low, and closing prices of a financial instrument.
#priceaction #StocksToTrade
Candlesticks are graphical representations of price movements for a given period of time. They are commonly formed by the opening, high, low, and closing prices of a financial instrument.
#priceaction #StocksToTrade
In Technical Analysis, a candlestick pattern is a movement in prices shown graphically on a candlestick chart that some believe can predict a particular market movement.
thread 🧵 👇 with @valuelevels
& @TradingView_IN
#TechnicalTrades #TradingView
thread 🧵 👇 with @valuelevels
& @TradingView_IN
#TechnicalTrades #TradingView

@valuelevels @TradingView_IN History:
Some of the earliest technical trading analysis was used to track prices of rice in the 18th century. Much of the credit for candlestick charting goes to Munehisa Homma (1724–1803), a rice merchant from Sakata, Japan who traded in the Ojima Rice market in Osaka
#stocks
Some of the earliest technical trading analysis was used to track prices of rice in the 18th century. Much of the credit for candlestick charting goes to Munehisa Homma (1724–1803), a rice merchant from Sakata, Japan who traded in the Ojima Rice market in Osaka
#stocks
@valuelevels @TradingView_IN Formation of the candlestick:
Candlesticks are graphical representations of price movements for a given period of time. They are commonly formed by the opening, high, low, and closing prices of a financial instrument.
#priceaction #StocksToTrade
Candlesticks are graphical representations of price movements for a given period of time. They are commonly formed by the opening, high, low, and closing prices of a financial instrument.
#priceaction #StocksToTrade
Tips to Choose the Right Intraday Trading Stocks:
THREAD 🧵 with @Stocktwit_IN @valuelevels
Liquid Stocks
Volatile Stocks
Correlation Stocks
Right Stock
Trade after Research
#trading #investing #invest #StockMarket #StocksToTrade #Nifty #sensex #banknifty #TechnicalTrades
THREAD 🧵 with @Stocktwit_IN @valuelevels
Liquid Stocks
Volatile Stocks
Correlation Stocks
Right Stock
Trade after Research
#trading #investing #invest #StockMarket #StocksToTrade #Nifty #sensex #banknifty #TechnicalTrades

Liquidity is the most important intraday trading tip while choosing the right stocks to trade during the day. Liquid stocks have huge trading volumes whereby larger quantities can be purchased and sold without significantly affecting the price. Don’t forget to check... 

liquidity at various price levels. You will find some stocks that are highly liquid at a lower price level, but the volume drops drastically after reaching a certain price zone. Variability of liquidity at different price levels will help you buy these stocks at the right time.
Hi Friends,
Sharing some useful #trading threads here
Like & Retweet for Max Reach for learners benefit
it's 100% FREE 🖐️
1- Technical Analysis, a candlestick pattern -- part 1
Sharing some useful #trading threads here
Like & Retweet for Max Reach for learners benefit
it's 100% FREE 🖐️
1- Technical Analysis, a candlestick pattern -- part 1
Some Complex candlestick patterns ---- thread Part 2
Are you Stock Market Trader? Learn something new every day
In Technical Analysis, a candlestick pattern is a movement in prices shown graphically on a candlestick chart that some believe can predict a particular market movement.
thread 🧵 👇 with @valuelevels & @TradingView_IN
#TechnicalTrades #TradingView
thread 🧵 👇 with @valuelevels & @TradingView_IN
#TechnicalTrades #TradingView

History:
Some of the earliest technical trading analysis was used to track prices of rice in the 18th century. Much of the credit for candlestick charting goes to Munehisa Homma (1724–1803), a rice merchant from Sakata, Japan who traded in the Ojima Rice market in Osaka
#stocks
Some of the earliest technical trading analysis was used to track prices of rice in the 18th century. Much of the credit for candlestick charting goes to Munehisa Homma (1724–1803), a rice merchant from Sakata, Japan who traded in the Ojima Rice market in Osaka
#stocks
Formation of the candlestick:
Candlesticks are graphical representations of price movements for a given period of time. They are commonly formed by the opening, high, low, and closing prices of a financial instrument.
#priceaction #StocksToTrade
Candlesticks are graphical representations of price movements for a given period of time. They are commonly formed by the opening, high, low, and closing prices of a financial instrument.
#priceaction #StocksToTrade
Definition of Alpha Figure
An Alpha indicates the measure by which a stock or portfolio has managed to outperform a benchmark like an index of shares.
#investing #StockMarcket
An Alpha indicates the measure by which a stock or portfolio has managed to outperform a benchmark like an index of shares.
#investing #StockMarcket

It takes into account the active returns on investment.
A positive Alpha means that the security or portfolio is beating the market while a negative Alpha means that it is lagging.
#stocks #nifty #niftybank #trading #priceaction
#StocksToTrade #stockstowatch
A positive Alpha means that the security or portfolio is beating the market while a negative Alpha means that it is lagging.
#stocks #nifty #niftybank #trading #priceaction
#StocksToTrade #stockstowatch

Alpha can also be used to measure the competence of a fund manager and their strategies.
It is also called an ‘abnormal rate of return’ or ‘excess return.’
#stockmarketindia
It is also called an ‘abnormal rate of return’ or ‘excess return.’
#stockmarketindia

Technical analysis on 7 Adani stocks
Might help for planning a move ahead
Last one is personal fav
🧵 A Thread 🧵
#Nifty #Adani #StocksToBuy #stockmarkets #StockMarket #stockstowatch #StocksToTrade #nseindia #NSE
@kuttrapali26 @nakulvibhor @Curious_Indian_ @VCPSwing
Might help for planning a move ahead
Last one is personal fav
🧵 A Thread 🧵
#Nifty #Adani #StocksToBuy #stockmarkets #StockMarket #stockstowatch #StocksToTrade #nseindia #NSE
@kuttrapali26 @nakulvibhor @Curious_Indian_ @VCPSwing
1) #Adani total gas limited (#ATGL)
- Consolidating in tight range
- 4.8% approx from ATH and might give a BO soon
- Dried volumes
- In uptrend hence higher chances of BO
- Near 21 EMA
Buy price :- 3771
TGT :- 4238
SL :- 3497
@Chartsbank @charts_breakout
- Consolidating in tight range
- 4.8% approx from ATH and might give a BO soon
- Dried volumes
- In uptrend hence higher chances of BO
- Near 21 EMA
Buy price :- 3771
TGT :- 4238
SL :- 3497
@Chartsbank @charts_breakout

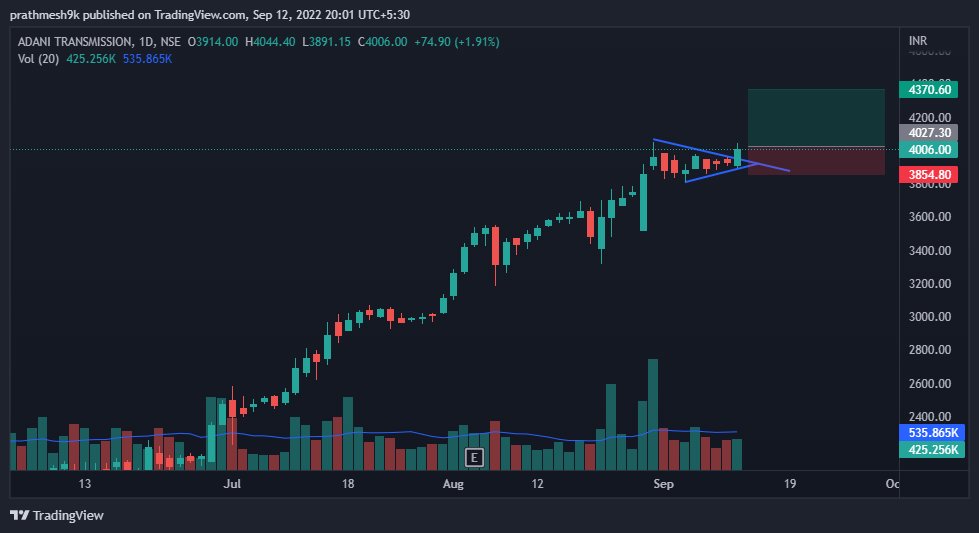
2) #adanitransmission
- Gave a BO from triangle pattern
- Dried volumes
- Low volume on BO hence caution
- If volumes increase on next candle then only enter
the stock
Buy Price :- 4027
TGT :- 4370
SL :- 3854
@charts_zone @chartswealth
- Gave a BO from triangle pattern
- Dried volumes
- Low volume on BO hence caution
- If volumes increase on next candle then only enter
the stock
Buy Price :- 4027
TGT :- 4370
SL :- 3854
@charts_zone @chartswealth

Intraday trading O-H-L Strategy
This is a very popular Intraday Strategy with good Accuracy. In this strategy, a Buy signal is generated when a Stock or Index has same value for Open and Low, while a Sell signal is generated when it has same value for Open & High @valuelevels
This is a very popular Intraday Strategy with good Accuracy. In this strategy, a Buy signal is generated when a Stock or Index has same value for Open and Low, while a Sell signal is generated when it has same value for Open & High @valuelevels

This is Tried and Tasted Strategy. Traders should follow 100% disciplined in executing those strategies with Risk and Money management Rules.
Traders can keep the Stop loss at 1% from Entry level or Previous Days High or Low levels.
Traders can keep the Stop loss at 1% from Entry level or Previous Days High or Low levels.
Take ENTRY after 9.30 AM
Check Stocks where Open=High OR Open=Low (before 9.30 AM)
RULE: Open=High means SELL AND Open=Low means BUY
#StocksToTrade
#stockstowatch #StockMarket
#Nifty #sensex #banknifty
#TechnicalTrades
Check Stocks where Open=High OR Open=Low (before 9.30 AM)
RULE: Open=High means SELL AND Open=Low means BUY
#StocksToTrade
#stockstowatch #StockMarket
#Nifty #sensex #banknifty
#TechnicalTrades

Tips to Choose the Right Intraday Trading Stocks:
THREAD 🧵
Liquid Stocks
Volatile Stocks
Correlation Stocks
Right Stock
Trade after Research
#trading #investing #invest #StockMarket #StocksToTrade #stockstowatch #StockMarket
#Nifty #sensex #banknifty #TechnicalTrades
THREAD 🧵
Liquid Stocks
Volatile Stocks
Correlation Stocks
Right Stock
Trade after Research
#trading #investing #invest #StockMarket #StocksToTrade #stockstowatch #StockMarket
#Nifty #sensex #banknifty #TechnicalTrades

Liquidity is the most important intraday trading tip while choosing the right stocks to trade during the day. Liquid stocks have huge trading volumes whereby larger quantities can be purchased and sold without significantly affecting the price. Don’t forget to check... 

liquidity at various price levels. You will find some stocks that are highly liquid at a lower price level, but the volume drops drastically after reaching a certain price zone. Variability of liquidity at different price levels will help you buy these stocks at the right time.
Tips to Choose the Right Intraday Trading Stocks:
THREAD 🧵
Liquid Stocks
Volatile Stocks
Correlation Stocks
Right Stock
Trade after Research
#trading #investing #invest #StockMarket #StocksToTrade #stockstowatch #StockMarket
#Nifty #sensex #banknifty #TechnicalTrades
THREAD 🧵
Liquid Stocks
Volatile Stocks
Correlation Stocks
Right Stock
Trade after Research
#trading #investing #invest #StockMarket #StocksToTrade #stockstowatch #StockMarket
#Nifty #sensex #banknifty #TechnicalTrades

Liquidity is the most important intraday trading tip while choosing the right stocks to trade during the day. Liquid stocks have huge trading volumes whereby larger quantities can be purchased and sold without significantly affecting the price. Don’t forget to check... 

liquidity at various price levels. You will find some stocks that are highly liquid at a lower price level, but the volume drops drastically after reaching a certain price zone. Variability of liquidity at different price levels will help you buy these stocks at the right time.
(1/n)
GMR Power & Urban Infra Ltd
A detailed 🧵on a Potential MULTIBAGGER from the Power & Infra Sector
🔁Do Retweet/Share for wider reach
#StockMarket #stocks #StocksInFocus #StocksToTrade #invest #Investment #trading #MultiBagger
GMR Power & Urban Infra Ltd
A detailed 🧵on a Potential MULTIBAGGER from the Power & Infra Sector
🔁Do Retweet/Share for wider reach
#StockMarket #stocks #StocksInFocus #StocksToTrade #invest #Investment #trading #MultiBagger
(2/n)
GMR Power & Urban Infra Limited (GPUIL), holds expertise in the sectors of Energy, Urban Infrastructure & Transportation. Urbanization has given the country rapid growth and contributing towards this growth, GMR Group ventured into this business sector.
GMR Power & Urban Infra Limited (GPUIL), holds expertise in the sectors of Energy, Urban Infrastructure & Transportation. Urbanization has given the country rapid growth and contributing towards this growth, GMR Group ventured into this business sector.
(3/n)
The division leverages on its collective experience and expertise in building successful projects across the country
The division leverages on its collective experience and expertise in building successful projects across the country
International conveyors ltd
INTLCONV Intlc #INTLCONV #Internationalconveyors
I never want to share a small company which has risk but if u r a long term investor then there is little risk.
But don't take recommendation, do ur own study(1/3)
#StockMarket #stocks #stock #investing


INTLCONV Intlc #INTLCONV #Internationalconveyors
I never want to share a small company which has risk but if u r a long term investor then there is little risk.
But don't take recommendation, do ur own study(1/3)
#StockMarket #stocks #stock #investing


International conveyors ltd INTLCONV #Internationalconveyors #INTLCONV #Intlc
#StockMarket #stockmarkets #stocks #stock #StockMarcket #investing #stockstowatch #StocksInFocus #StocksToTrade #stocktobuy #Nifty #StockToWatch #sharemarket #investor #invest #Investment (2/3)


#StockMarket #stockmarkets #stocks #stock #StockMarcket #investing #stockstowatch #StocksInFocus #StocksToTrade #stocktobuy #Nifty #StockToWatch #sharemarket #investor #invest #Investment (2/3)


International conveyors ltd INTLCONV
#Internationalconveyors #INTLCONV #Intlc
#StockMarket #stockmarkets #stocks #stock #StockMarcket #investing #stockstowatch #StocksInFocus #StocksToTrade #stocktobuy #Nifty #StockToWatch #sharemarket #investor #invest #Investment (3/3)

#Internationalconveyors #INTLCONV #Intlc
#StockMarket #stockmarkets #stocks #stock #StockMarcket #investing #stockstowatch #StocksInFocus #StocksToTrade #stocktobuy #Nifty #StockToWatch #sharemarket #investor #invest #Investment (3/3)


(1/n)
SPML Infra - A MULTIBAGGER in the making
A Detailed Thread on India's Leading Water Infra Co
🔄Do Retweet to Educate Investor Community
#StockMarket #StocksToTrade #StocksInFocus #StocksToBuy #stocks #Investment #investing
SPML Infra - A MULTIBAGGER in the making
A Detailed Thread on India's Leading Water Infra Co
🔄Do Retweet to Educate Investor Community
#StockMarket #StocksToTrade #StocksInFocus #StocksToBuy #stocks #Investment #investing
(2/n)
Mkt cap - 190cr
Book Value - 76
P/B - 0.67x
▫️SPML Infra Limited is a leading Infrastructure Development company with over 40 years experience in the public as well as private sector.
Mkt cap - 190cr
Book Value - 76
P/B - 0.67x
▫️SPML Infra Limited is a leading Infrastructure Development company with over 40 years experience in the public as well as private sector.
(3/n)
▫️Co undertakes tender based contract from government departments & has a pan-India presence with ongoing projects at Delhi, Uttar Pradesh, Rajasthan, Bihar, Gujarat, Maharashtra & Karnataka.
▫️Co undertakes tender based contract from government departments & has a pan-India presence with ongoing projects at Delhi, Uttar Pradesh, Rajasthan, Bihar, Gujarat, Maharashtra & Karnataka.
(1/n)
JSW Ispat Special Products Ltd (JSWISPL) - A Strong Rerating Candidate
A Detailed Thread🧵
Do Retweet to Help Educate more Investors
#Investing #StockToWatch #StocksToTrade #MultiBagger
JSW Ispat Special Products Ltd (JSWISPL) - A Strong Rerating Candidate
A Detailed Thread🧵
Do Retweet to Help Educate more Investors
#Investing #StockToWatch #StocksToTrade #MultiBagger
(2/n)
JSWISPL is engaged in manufacturing and marketing of sponge iron, steel & ferro alloys, billets & pellets
Co has upgraded its production process from commodity steel to special steel products catering to needs of seamless pipe industries, automobile & high-speed rail steel
JSWISPL is engaged in manufacturing and marketing of sponge iron, steel & ferro alloys, billets & pellets
Co has upgraded its production process from commodity steel to special steel products catering to needs of seamless pipe industries, automobile & high-speed rail steel
(3/n)
In August 2018, a joint consortium of AION Investments Private II Ltd. (AION) & JSW Steel Limited acquired controlling stake in JSW Ispat Special Products Ltd
In August 2018, a joint consortium of AION Investments Private II Ltd. (AION) & JSW Steel Limited acquired controlling stake in JSW Ispat Special Products Ltd
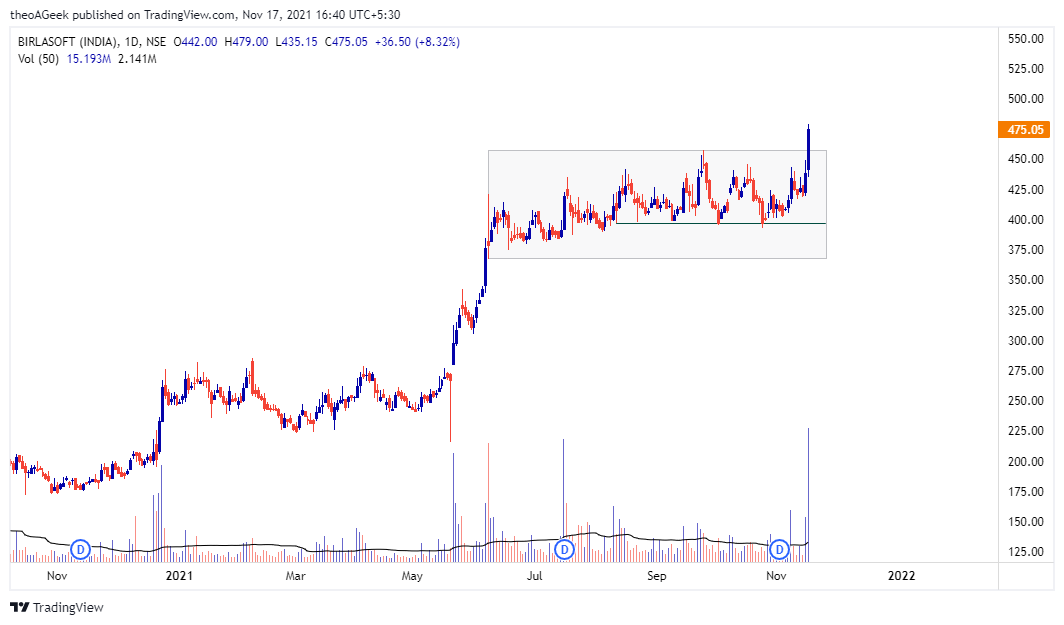
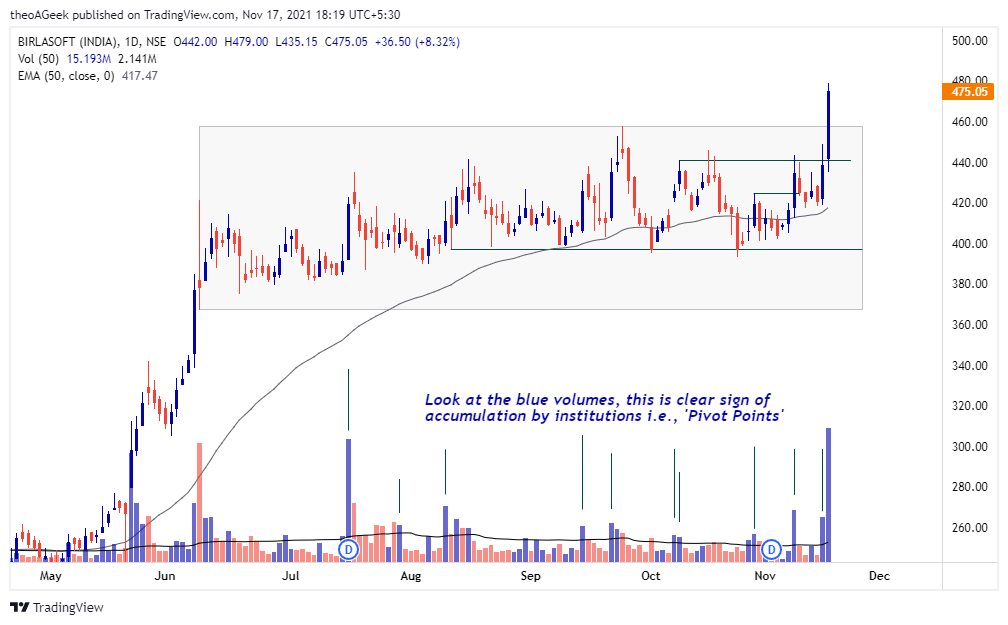
𝐁𝐈𝐑𝐋𝐀𝐒𝐎𝐅𝐓 - 𝐀 𝐂𝐚𝐬𝐞 𝐒𝐭𝐮𝐝𝐲
(How I took the trade in #BIRLASOFT, and how I'll be managing the trade now)
~A THREAD 🧵~
𝘋𝘪𝘴𝘤𝘭𝘢𝘪𝘮𝘦𝘳: 𝘐 𝘢𝘮 𝘯𝘰𝘵 𝗦𝗘𝗕𝗜 𝘳𝘦𝘨𝘪𝘴𝘵𝘦𝘳𝘦𝘥.
#stocks #StocksToTrade #BREAKOUTSTOCKS #StockMarketindia
(How I took the trade in #BIRLASOFT, and how I'll be managing the trade now)
~A THREAD 🧵~
𝘋𝘪𝘴𝘤𝘭𝘢𝘪𝘮𝘦𝘳: 𝘐 𝘢𝘮 𝘯𝘰𝘵 𝗦𝗘𝗕𝗜 𝘳𝘦𝘨𝘪𝘴𝘵𝘦𝘳𝘦𝘥.
#stocks #StocksToTrade #BREAKOUTSTOCKS #StockMarketindia
#Thread
How to Place Stop Loss and Trail Stop Loss in Intraday trades.
This is the biggest problem which every trader faces where to keep SL if breakout happened and you have entered the trade. Initially you can take SL as the low of the breakout candle in 15 min.(1/n)
How to Place Stop Loss and Trail Stop Loss in Intraday trades.
This is the biggest problem which every trader faces where to keep SL if breakout happened and you have entered the trade. Initially you can take SL as the low of the breakout candle in 15 min.(1/n)
If the breakout candle low is too far than you can place SL below VWAP or the below previous swing low.
Now How to ride the trend in Intraday by trailing SL.
IF you will use 20 EMA its too fast and profits can run away(2/n)
Now How to ride the trend in Intraday by trailing SL.
IF you will use 20 EMA its too fast and profits can run away(2/n)
If we use 10 EMA it's too slow and more chances of hitting the SL. So by backtesting i have found 15 EMA seems to be the best among all for trailing SL.
IF you have more patience then you can use previous swing low also as a trailing SL (3/n)
IF you have more patience then you can use previous swing low also as a trailing SL (3/n)
Introducing the #T20list
This list covers #CNX500 stocks but excludes F&O stocks from the study
stocks at new 20Day highs or lows suggest range #breakout
20Day volume gainers indicate #action
top 20Day % gainers & losers suggests #momentum
This list covers #CNX500 stocks but excludes F&O stocks from the study
stocks at new 20Day highs or lows suggest range #breakout
20Day volume gainers indicate #action
top 20Day % gainers & losers suggests #momentum

#Locustsattack could lead to a #bounty for #agrochemical companies
Smaller #cement stocks are gaining interest. Watch out.
#stockstowatch #howtotrade #trading #T20list
Smaller #cement stocks are gaining interest. Watch out.
#stockstowatch #howtotrade #trading #T20list


