Discover and read the best of Twitter Threads about #overbought
Most recents (4)
The #BullBearReport is out.
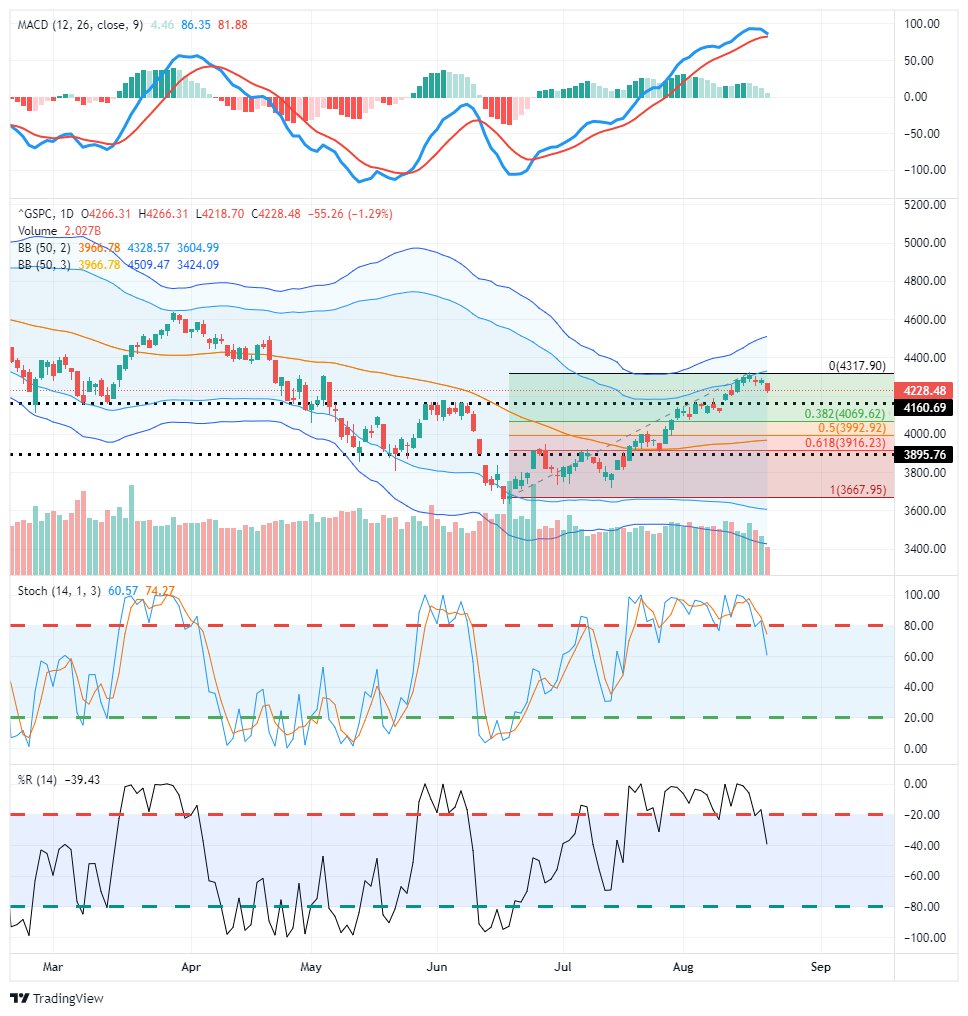
The #rally runs into resistance and backtracks as #overbought conditions slow the #bulls. Is the run over, or just resting? We review the #FOMC minutes, what it means for #investors, the #technical backdrop and #allocations.
realinvestmentadvice.com/fomc-minutes-e…
The #rally runs into resistance and backtracks as #overbought conditions slow the #bulls. Is the run over, or just resting? We review the #FOMC minutes, what it means for #investors, the #technical backdrop and #allocations.
realinvestmentadvice.com/fomc-minutes-e…
At 2-standard deviations above the 50-dma, and the 200-dma acting as resistance, the #market pullback, as discussed last week, was expected. Support levels reside just below between 4000 and 4160.
realinvestmentadvice.com/fomc-minutes-e…
realinvestmentadvice.com/fomc-minutes-e…

Great note from BofA this weekend.
“Applying a 20th century PE of 15x gets you to an S&P500 index of 3300, applying a 21st century PE of 20x gets you to an S&P500 of 4400; there’s your range."
Problem: The drivers of the 21st century range are reversing.
realinvestmentadvice.com/fomc-minutes-e…
“Applying a 20th century PE of 15x gets you to an S&P500 index of 3300, applying a 21st century PE of 20x gets you to an S&P500 of 4400; there’s your range."
Problem: The drivers of the 21st century range are reversing.
realinvestmentadvice.com/fomc-minutes-e…

It's #VALUE_SERIES 🚀
@izra_elf a student of #DG_ACADEMY will ride us into the world of indicators as he will explain "RSI: RELATIVE STRENGTH INDICATOR"
#Value awaits as we ride 🚀🚀
🧵1
#ValueSeries #trading #Crypto #dgcryptotv #indicators #RSI
@izra_elf a student of #DG_ACADEMY will ride us into the world of indicators as he will explain "RSI: RELATIVE STRENGTH INDICATOR"
#Value awaits as we ride 🚀🚀
🧵1
#ValueSeries #trading #Crypto #dgcryptotv #indicators #RSI

The #Relative_Strength_Index is a convenient indicator for one to use for trades. This #indicator mainly spells out the #overbought and #oversold situation of the market. So, What exacty is the Relative Strength Indicator?
🧵2
🧵2
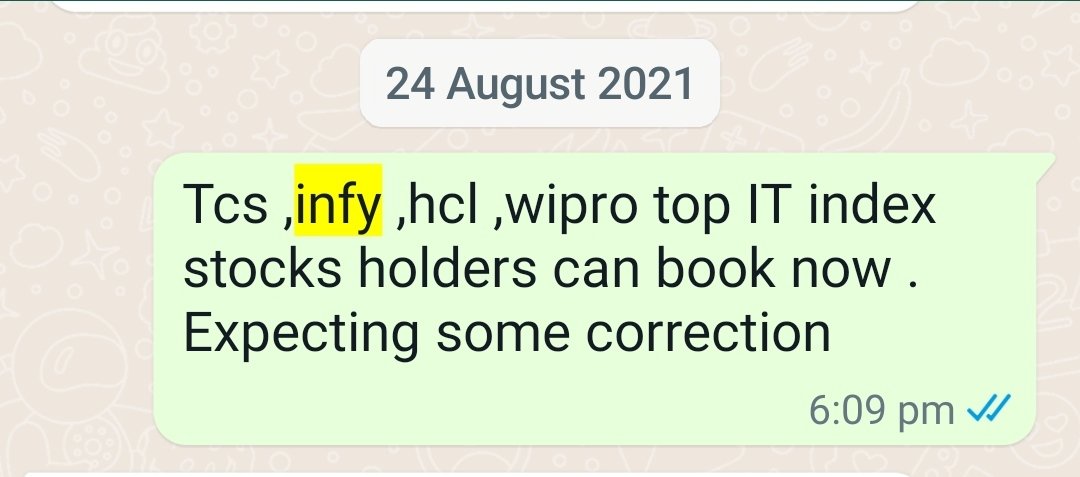
தொடர்ச்சியாக சந்தையில் #ITstocks ஏன் விழுகுதுன்னு சிலருக்கு புரியாமல் இருக்கலாம். என்னோட ஒரு சின்ன அனாலிஸிஸ் இங்கே ஷேர் பண்றேன்.எவ்வளவு நல்ல செக்டார் அல்லது கம்பனியாக இருந்தாலும் தொடர்ச்சியாக மேலே போகாது. கீழேயும் வராது.நீண்ட காலத்தில் பல ஏற்ற இறக்கங்கள் இருக்கும்.
#overbought ,#oversold இது கண்டிப்பாக தெரிஞ்சிருக்கணும். நான் இருக்கும் வாட்சாப் குழுமத்தில் மெட்டல் ஸ்டாக்ஸ் ,மற்றும் ஐடி ஸ்டாக்ஸ் முன் கூட்டியே வெளியேறச் சொல்லிட்டேன். கோவிட் 2020 மார்ச் இறக்கத்தில் இருந்து நிப்டி மற்றும் பல இண்டெக்ஸ் ரிட்டர்ன்ஸ் எடுத்து பார்த்தாலே தெரியும். 

2020 மார்ச் 25 க்கு பிறகு சந்தை ஏற ஆரம்பித்தது.லாக் டவுணில் பல தொழில்கள் பாதிக்கப்பட்டபோது வீட்டில் இருந்து பணி செய்யும் ஆப்சன் மற்றும் அதிகப்படியான மெடிக்கல் தேவைகள் கொண்டு முதலில் ஏற ஆரம்பித்தவை பார்மா மற்றும் ஐடி பங்குகள். மெதுவா ஒவ்வொன்னா மேலே வர லாக்டவுணில் சந்தையில் நுழைந்த
Thread 🧵on #Indicators used in #TechnicalAnalysis.
Must read for those who wish to learn #TechnicalAnalysis.
(Re-Tweet if you like to maximize the reach.)
Must read for those who wish to learn #TechnicalAnalysis.
(Re-Tweet if you like to maximize the reach.)

1/n
#Technicalindicators are mathematical calculations or pattern-based signals produced by the price, volume, and/or open interest of a security or contract used by traders who follow #TechnicalAnalysis.
#Technicalindicators are mathematical calculations or pattern-based signals produced by the price, volume, and/or open interest of a security or contract used by traders who follow #TechnicalAnalysis.
2/n
Technical Indicators are divided in 4 broad types -
1. Trend Indicators
2. Momentum Indicators
3. Volatility Indicators
4. Volume Indicators
#TechnicalAnalysis #Technicalindicators
Technical Indicators are divided in 4 broad types -
1. Trend Indicators
2. Momentum Indicators
3. Volatility Indicators
4. Volume Indicators
#TechnicalAnalysis #Technicalindicators
