Discover and read the best of Twitter Threads about #Indicators
Most recents (24)
In the bear market, as I've always mentioned, it's the perfect time to expand knowledge, accumulate funds, and build a long-term investment portfolio.
So how can we effectively manage your crypto longterm portfolio?
Check out my tips as below:
🧵 👇🏻
So how can we effectively manage your crypto longterm portfolio?
Check out my tips as below:
🧵 👇🏻

📌 This thread will conclude with:
Part 1: Project Selection Process
Part 2: Top 3 Portfolio Management Tools
Today, we will begin with Part 1.
Part 1: Project Selection Process
Part 2: Top 3 Portfolio Management Tools
Today, we will begin with Part 1.

Part 1: Project (PJs) Selection Process
▪️ The PJ selection process, done by the PJ #portfolio manager, evaluates PJs ideas in terms of benefits and ensures alignment with overall strategic goals.
▪️ Effective PJs selection for long-term investment leads to better #ROI
▪️ The PJ selection process, done by the PJ #portfolio manager, evaluates PJs ideas in terms of benefits and ensures alignment with overall strategic goals.
▪️ Effective PJs selection for long-term investment leads to better #ROI

Here's a personal story that goes along with my previous tweet.
For a long time I was focused on metrics, I made them the indicators of my success whether in blogging, life, or business.
Until I realized it was pointless to worry about how many people read my articles, it was simply something out of my control, what I could do though.....
Until I realized it was pointless to worry about how many people read my articles, it was simply something out of my control, what I could do though.....
was write 10 high-quality articles a month and those would get me to where I wanted. And so I acted.
Writing articles was something I could control directly. Bounce rates, views, and other metrics I could not.
Now I'm proud to say I surpassed my previous ........
Writing articles was something I could control directly. Bounce rates, views, and other metrics I could not.
Now I'm proud to say I surpassed my previous ........
It's #VALUE_SERIES 🚀
@izra_elf a student of #DG_ACADEMY will ride us into the world of indicators as he will explain "RSI: RELATIVE STRENGTH INDICATOR"
#Value awaits as we ride 🚀🚀
🧵1
#ValueSeries #trading #Crypto #dgcryptotv #indicators #RSI
@izra_elf a student of #DG_ACADEMY will ride us into the world of indicators as he will explain "RSI: RELATIVE STRENGTH INDICATOR"
#Value awaits as we ride 🚀🚀
🧵1
#ValueSeries #trading #Crypto #dgcryptotv #indicators #RSI

The #Relative_Strength_Index is a convenient indicator for one to use for trades. This #indicator mainly spells out the #overbought and #oversold situation of the market. So, What exacty is the Relative Strength Indicator?
🧵2
🧵2
1. Always keep your trading plan ready: #Trading without a plan is sureshot way of exposing yourself to danger.
Set a Trading plan based on the Market trend👇 (2/15)
Set a Trading plan based on the Market trend👇 (2/15)

1/ το βίντεο με τον #ξιαρχο εμετικό...κατ`ελάχιστο...
Πιθανότατα "υπο την επήρεια" όπως εντόπισε και η κυρία που υπέστει το bullying αλλά αντέδρασε εξαιρετικά...
Είναι η συγνώμη του #ξιαρχο στο instagram, αληθινή και ειλικρινής; Παμε να δουμε σε #thread...
Πιθανότατα "υπο την επήρεια" όπως εντόπισε και η κυρία που υπέστει το bullying αλλά αντέδρασε εξαιρετικά...
Είναι η συγνώμη του #ξιαρχο στο instagram, αληθινή και ειλικρινής; Παμε να δουμε σε #thread...

2/ Στην πρώτη κιολας πρόταση της "συγνώμης" βλέπουμε τον ορισμό του #psychological #distancing με τα εμετικά σχόλια περι...οριζόντιων ριγων - συνοδευομένα με τα ηλίθια γέλια - να βαπτίζονται..."σχολιασμός" ενώ μιλάμε για τον ορισμό του εκφοβισμου (#bullying) και της παρενοχλησης 

3/ θα θυμούνται οι φίλοι/ες ότι το psychological distancing είναι παγια τακτική των θυτών οταν αυτοί νιωθουν ένοχοι για κάτι...την οποία βλέπουμε σε πολλές μορφές βιας... ("πηρα" αντι για "εκλεψα", "σεξουαλική πραξη" αντι για "βιασμος", "έκανα κακό" αντι για "δολοφονησα" κτλ)...
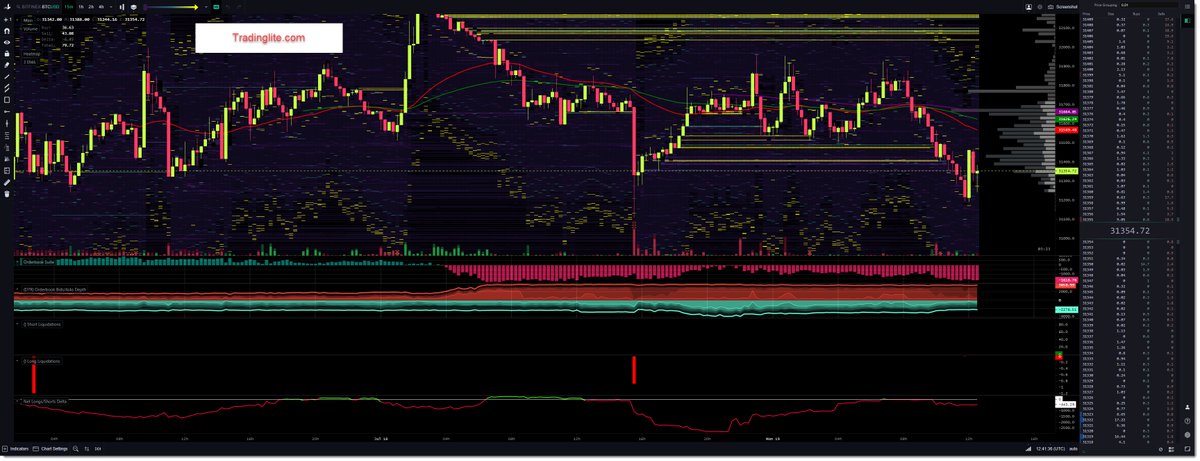
Chart Apps, Indicator and M_Analysis list by Inspo:
#ChartApps
tradinglite.com
Heatmap showing Buy and Sell Order Books
exocharts.com
bid/Ask Ratio. Detection of Buy/Sell Walls and Trade Activities
#BTC #ETH #XRP #Crypto #Analysis #Tools #Indicators

#ChartApps
tradinglite.com
Heatmap showing Buy and Sell Order Books
exocharts.com
bid/Ask Ratio. Detection of Buy/Sell Walls and Trade Activities
#BTC #ETH #XRP #Crypto #Analysis #Tools #Indicators

tradingview.com
Charts incl. a lot of diff. indicators
Charts incl. a lot of diff. indicators
#Indicators
RSI
BTCUSDSHORTS - Shorts
BTCUSDSHORTS - Longs
BBWP
Volatility
BB (Bollinger Bands)
MA Cross
VWAP
Volume (2000)
GC (Gaussian Channel)
RSI
BTCUSDSHORTS - Shorts
BTCUSDSHORTS - Longs
BBWP
Volatility
BB (Bollinger Bands)
MA Cross
VWAP
Volume (2000)
GC (Gaussian Channel)
Launching A Thread On #Value #Investing
In Coming Days,I Will Share Fundamental Check List By Famous Investors-What They Look in Companies Before Investing
“Gems Included-Work In Progress👨🏼💼”
🌁Warren Buffett
🌁Charlie Munger
🌁Jessie Livermore
🌁John Templeton
Stay tuned…😎
In Coming Days,I Will Share Fundamental Check List By Famous Investors-What They Look in Companies Before Investing
“Gems Included-Work In Progress👨🏼💼”
🌁Warren Buffett
🌁Charlie Munger
🌁Jessie Livermore
🌁John Templeton
Stay tuned…😎
Investing Is A Unique Kind Of Casino Where You Cannot Lose In The End,So Long As You Play
Only By The Rules That Put The Odds Squarely In Your Favor."
—Benjamin Graham
(The Intelligent Investor)
Only By The Rules That Put The Odds Squarely In Your Favor."
—Benjamin Graham
(The Intelligent Investor)
Understanding How To Selects
Winning Stocks Starts With Analysing The Investment Philosophy Of The Company.The Company Should Have
📝Consistent Earning Power(EPS)
📝Good Return On Equity (ROE)
📝Capable Management
📝Stock Should Be Sensibly Priced
—Benjamin Graham
Winning Stocks Starts With Analysing The Investment Philosophy Of The Company.The Company Should Have
📝Consistent Earning Power(EPS)
📝Good Return On Equity (ROE)
📝Capable Management
📝Stock Should Be Sensibly Priced
—Benjamin Graham
Alligator indicator is created by Bill Williams. He was a popular trader and author.
Before we discuss the indicator, let us understand an important concept.
Before we discuss the indicator, let us understand an important concept.
When creating a #datacollection system for your #MonitoringEvaluation activities there are 7 steps you can follow to ensure you are building an effective system. Here they are:
Step 1: Map the information flow in your organization & programmes.
How?
• List all actors involved in reporting
• Add those interested in the activities' progress
• Map out how information flows from each department, field office or colleague to another & eventually to you
How?
• List all actors involved in reporting
• Add those interested in the activities' progress
• Map out how information flows from each department, field office or colleague to another & eventually to you
Then, find out:
• Where each type of information resides
• Who is responsible for providing it
Tip: If you find out that there are various different systems storing information you can consider replacing them with one so as to streamline the overall #datacollection process.
• Where each type of information resides
• Who is responsible for providing it
Tip: If you find out that there are various different systems storing information you can consider replacing them with one so as to streamline the overall #datacollection process.
Thread 🧵on #Indicators used in #TechnicalAnalysis.
Must read for those who wish to learn #TechnicalAnalysis.
(Re-Tweet if you like to maximize the reach.)
Must read for those who wish to learn #TechnicalAnalysis.
(Re-Tweet if you like to maximize the reach.)
1/n
#Technicalindicators are mathematical calculations or pattern-based signals produced by the price, volume, and/or open interest of a security or contract used by traders who follow #TechnicalAnalysis.
#Technicalindicators are mathematical calculations or pattern-based signals produced by the price, volume, and/or open interest of a security or contract used by traders who follow #TechnicalAnalysis.
2/n
Technical Indicators are divided in 4 broad types -
1. Trend Indicators
2. Momentum Indicators
3. Volatility Indicators
4. Volume Indicators
#TechnicalAnalysis #Technicalindicators
Technical Indicators are divided in 4 broad types -
1. Trend Indicators
2. Momentum Indicators
3. Volatility Indicators
4. Volume Indicators
#TechnicalAnalysis #Technicalindicators
Daily Bookmarks to GAVNet 01/17/2021 greeneracresvaluenetwork.wordpress.com/2021/01/17/dai…
2020 UST March Madness - Money: Inside and Out
moneyinsideout.exantedata.com/p/2020-ust-mar…
#money #march #bonds
moneyinsideout.exantedata.com/p/2020-ust-mar…
#money #march #bonds
Thread: Parabolic SAR Indicator
Parabolic SAR (PSAR) indicator was developed by J. Welles Wilder.
#PSAR #Indicators #Definedge
Parabolic SAR (PSAR) indicator was developed by J. Welles Wilder.
#PSAR #Indicators #Definedge
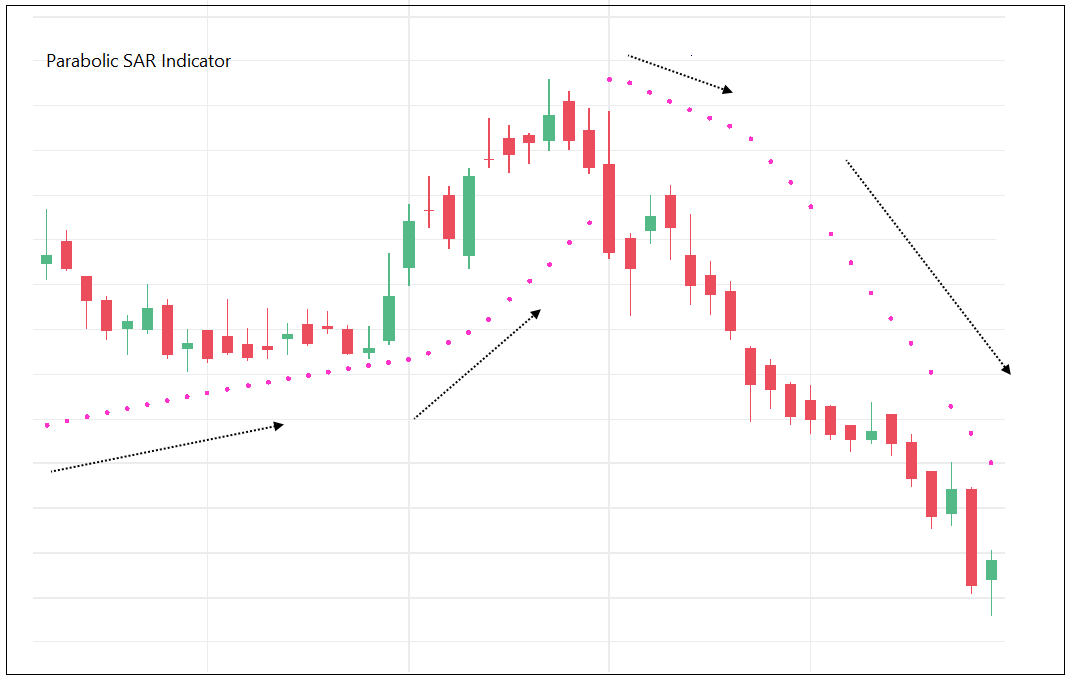
The calculation of this indicator is a bit complex, but the concept is extremely useful. I will try to simplify it and explain the logic. I will briefly explain the concept, calculation and reading.
Let us think about creating an indicator that shows the trend.
Let us think about creating an indicator that shows the trend.
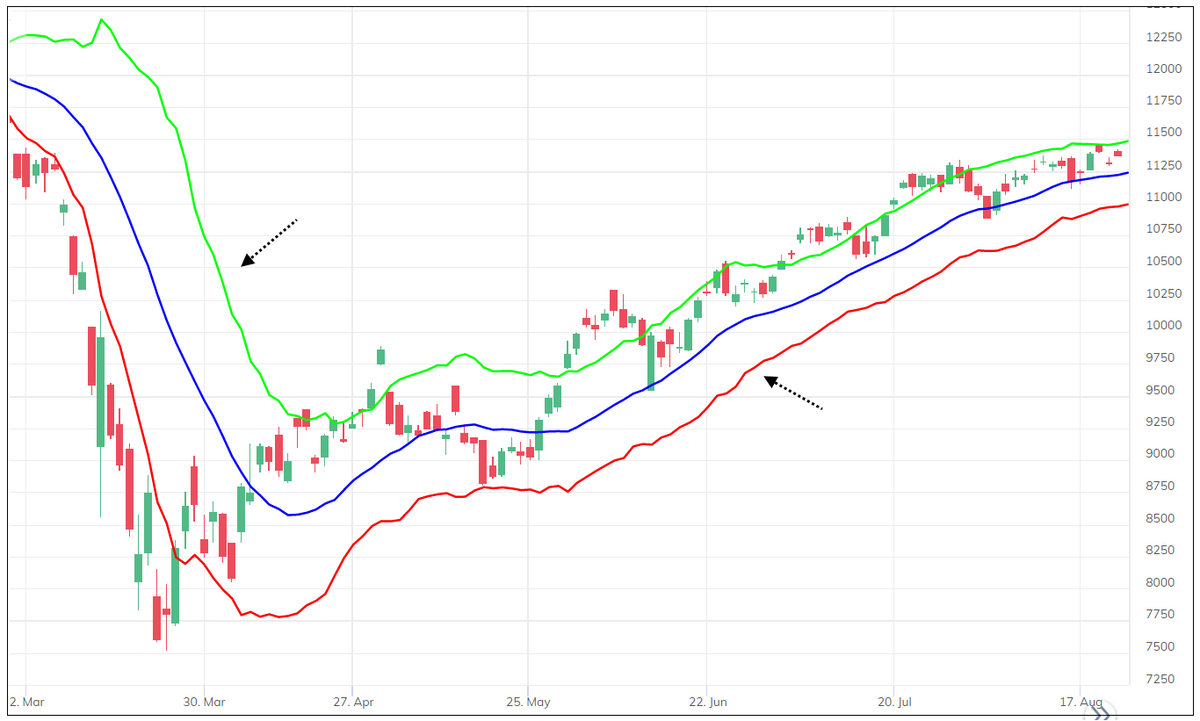
Chester W. Keltner (1909-1998) was a Chicago grain trader. He worked with successful traders who back-tested trading systems. He talked about Ten-Day Moving average trading rule in his book 'How to Make Money in Commodities' in 1960.
He did not claim that he invented the strategy so origin of this idea is uncertain. But people started referring it as Keltner channel after the book.
There are two versions of Keltner channel. First is explained by Keltner in his book, and the other one is a modified version.
There are two versions of Keltner channel. First is explained by Keltner in his book, and the other one is a modified version.
Thread: Adaptive Moving Average (AMA)
AMA is an indicator devised by Perry Kaufman explained in his book Trading System and Methods. It is also known as Kaufman’s Adaptive Moving Average (KAMA).
#AMA #Adaptivemovingaverage #indicators #definedge
AMA is an indicator devised by Perry Kaufman explained in his book Trading System and Methods. It is also known as Kaufman’s Adaptive Moving Average (KAMA).
#AMA #Adaptivemovingaverage #indicators #definedge
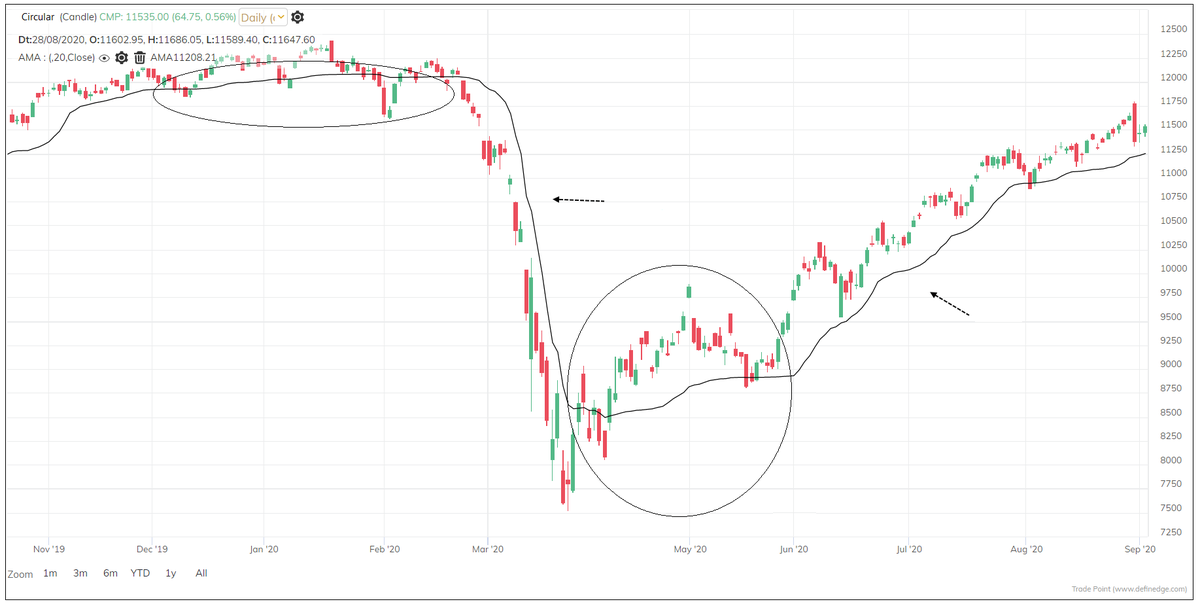
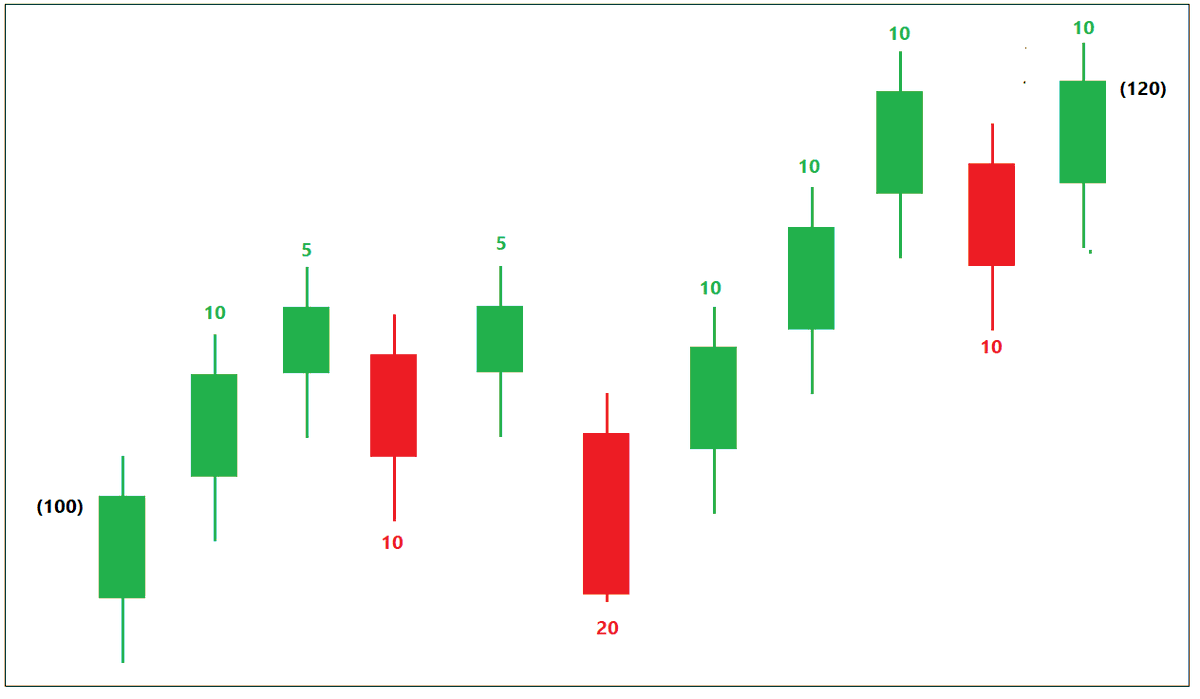
Rate of change (ROC) is a study that measures how much price moved up or down from previous bar. The daily rate of change captures the trend. When we make it absolute, captures volatility.
Meaning,
Price went up or down by 10 points = trend
Price moved by 10 points = volatility
Meaning,
Price went up or down by 10 points = trend
Price moved by 10 points = volatility
Thread: Bollinger Bands
Bollinger Bands® is a wonderful invention of John Bollinger.
#Bollingerbands #Indicators #Definedge
Bollinger Bands® is a wonderful invention of John Bollinger.
#Bollingerbands #Indicators #Definedge
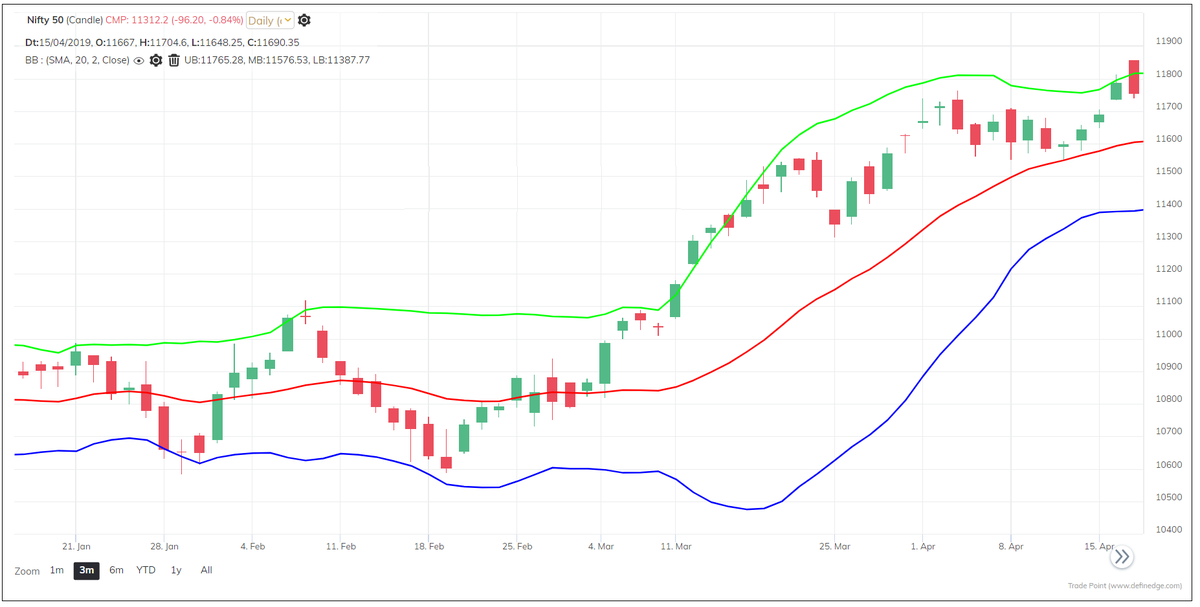
Thread: Donchian Channels
Donchian channels were invented by Richard Donchian. He is known as a father of trend following trading. He was founder of world’s first managed fund in 1949.
#donchianchannels #indicators #definedge
Donchian channels were invented by Richard Donchian. He is known as a father of trend following trading. He was founder of world’s first managed fund in 1949.
#donchianchannels #indicators #definedge
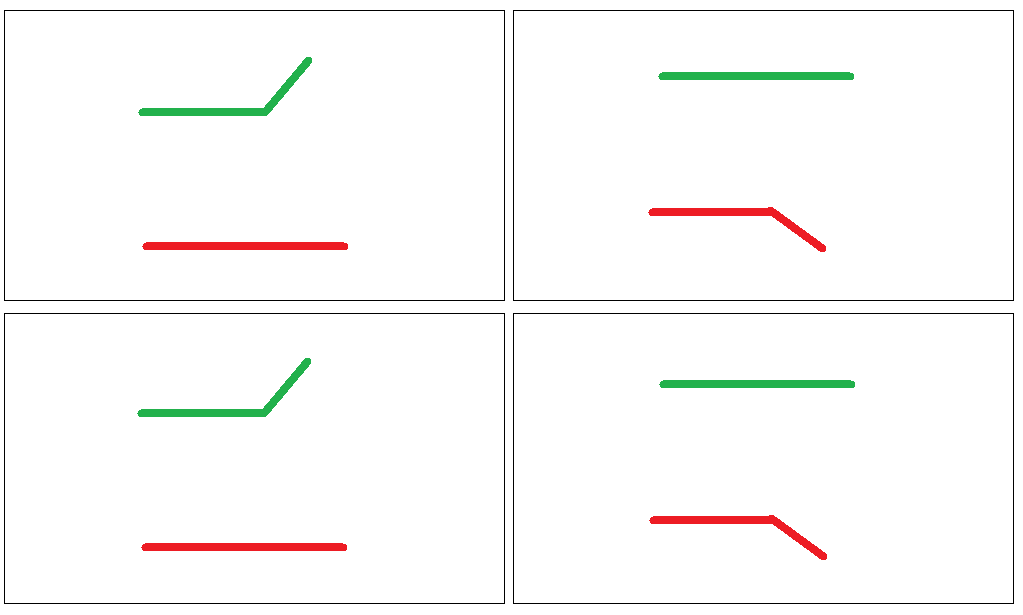
Donchian was born in 1905, he got interested in trading after learning abt story of Jesse Livermore. Donchian started relatively at young age but wasn’t successful initially in the market. He lost significant money in 1929 crash. Bt managed to come back & started practicing again
He was a self-taught chartist and technician. He created strategies using charts and indicators and also studied company’s underlying fundamental characteristics. He also wrote technical newsletters for over two decades for well-known firms.
Thread: MFI Indicator
Created by Gene Quong and Avrum Soudack, MFI stands for Money Flow Index.
#MFI #Indicators #Definedge
Created by Gene Quong and Avrum Soudack, MFI stands for Money Flow Index.
#MFI #Indicators #Definedge
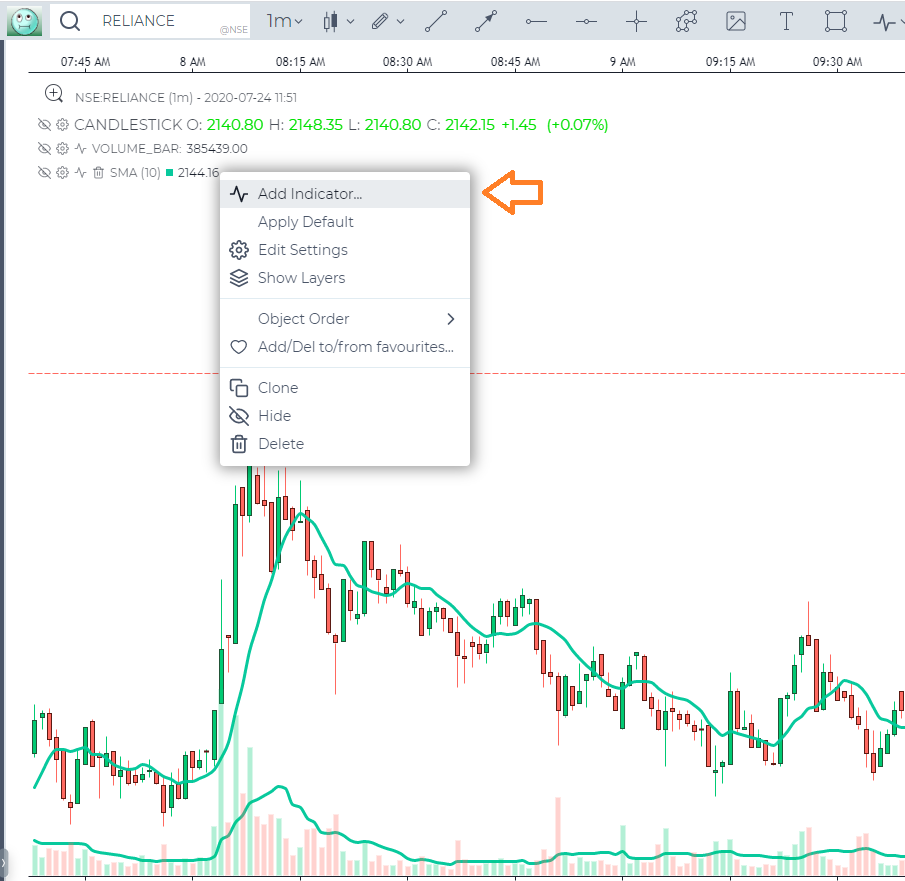
Indicator on Indicator (beta) -
Another premium feature in other popular platforms is now available for FREE in GoCharting.
Please follow the steps in this thread
#premium #indicators #charting #advanced
Another premium feature in other popular platforms is now available for FREE in GoCharting.
Please follow the steps in this thread
#premium #indicators #charting #advanced

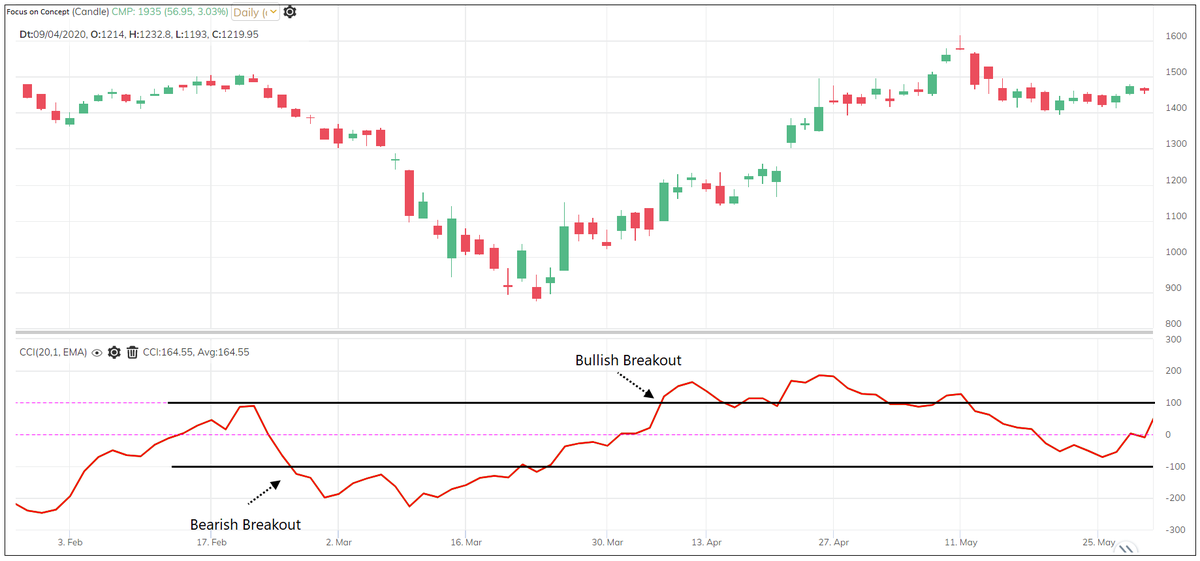
Thread: CCI Indicator
Invented by Donald Lambert, CCI stands for Commodity Channel Index.
There are three parts of CCI Indicator: You can remember it as TMC.
#CCI #Indicators #Definedge
Invented by Donald Lambert, CCI stands for Commodity Channel Index.
There are three parts of CCI Indicator: You can remember it as TMC.
#CCI #Indicators #Definedge
NEW PAPER: A #review of #Indigenous #knowledge and #participation in #environmental #monitoring ecologyandsociety.org/vol25/iss2/art… @UVicENVI @UVicSocialSci @ale_uvic #openaccess @EcologySociety1
We reviewed and analyzed the #academic #literature to answer the following questions: How have #Indigenous peoples participated in #environmentalmonitoring, and how has their #participation influenced #monitoring #objectives, #indicators, #methods, and #monitoring #outcomes?
Findings: 1. The literature most often characterized participation as data collection;
#DXone_Indicators [13/03/20]:
#AccumulationDistributionLine
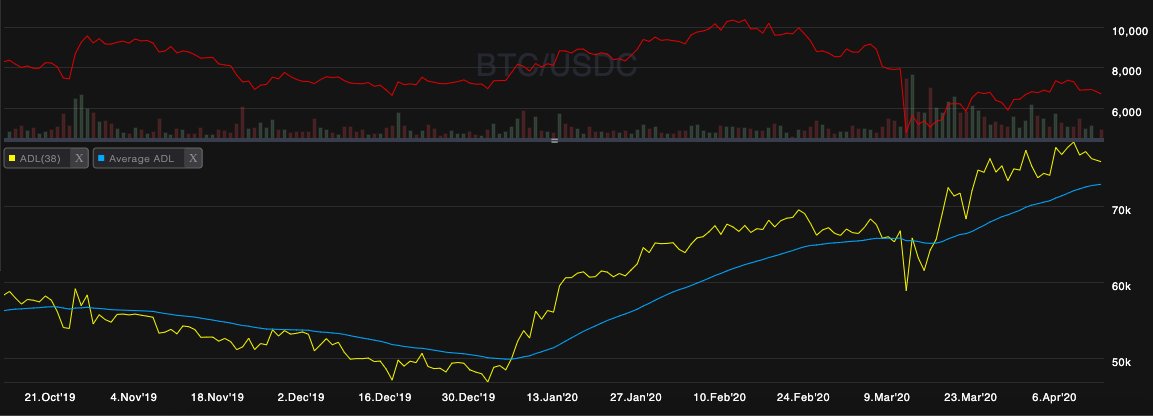
The #ADL is a #trendline that indicates #VOLUME. If it goes up, it indicates #BUYING_VOLUME is #high, and vice versa.
It depicts the cumulative flow of money.
Note: It Does Not Indicate Price But Indicates Demand.
#AccumulationDistributionLine
The #ADL is a #trendline that indicates #VOLUME. If it goes up, it indicates #BUYING_VOLUME is #high, and vice versa.
It depicts the cumulative flow of money.
Note: It Does Not Indicate Price But Indicates Demand.

ADL to Analyse Historical Bitcoin Movement:
From early January to March, a steady inflow into #BTC with stable price depicts what traders call - #Accumulation. The increase in #volume after the initial #pandemic scare depicts larger renewed interest in BTC than last year.
From early January to March, a steady inflow into #BTC with stable price depicts what traders call - #Accumulation. The increase in #volume after the initial #pandemic scare depicts larger renewed interest in BTC than last year.
Disclaimer: This is not trading advice and is intended for educational purposes only. #DYOR
#MetaphysicsOfQuality iⁿtrade:
• Fixed #RiskManagement is Percentage #StopLoss.
• Such a StopLoss is -100% of the initial MarginLevel Percentage.
• So #netting may appear at -50% of MarginLevel Percentage.
• Any #LEVERAGE just offers #DrawDown —
kind of limited LOSS.
🔻


• Fixed #RiskManagement is Percentage #StopLoss.
• Such a StopLoss is -100% of the initial MarginLevel Percentage.
• So #netting may appear at -50% of MarginLevel Percentage.
• Any #LEVERAGE just offers #DrawDown —
kind of limited LOSS.
🔻

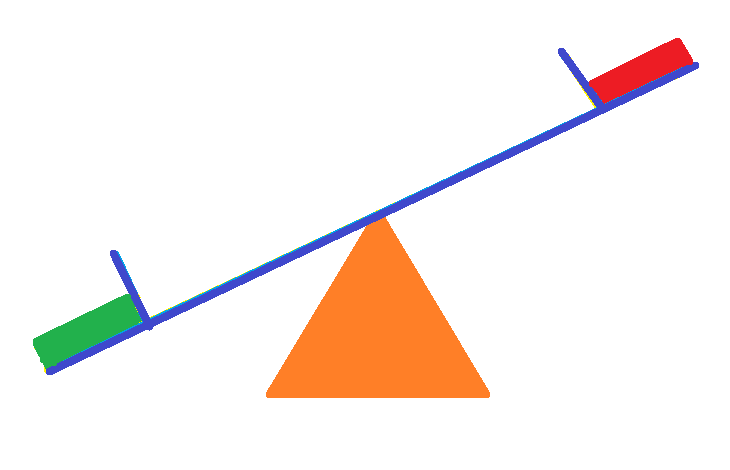
• A #lever on #fulcrum is
better than leverage!
• My #BreadthScreener™ is
not a BLACKBOX!
• It SPOTS the FULCRUM &
NABS the SHORT LEVER:
• The #BreadthScreener™ is a #non_forecasting,
#volatility-gauging,
#trading #system
• #ConstantRisk #FixedRisk #Management SURVIVES!
🔻
better than leverage!
• My #BreadthScreener™ is
not a BLACKBOX!
• It SPOTS the FULCRUM &
NABS the SHORT LEVER:
• The #BreadthScreener™ is a #non_forecasting,
#volatility-gauging,
#trading #system
• #ConstantRisk #FixedRisk #Management SURVIVES!
🔻
• Since #practice precedes #theory,
— #RiskManagement precedes #trading setups;
• Since theory doesn't make difference between theory & practice,
— Setups' forecasting don't forecast fail;
• Since practice makes the difference,
— #FixedRisk precedes #TradingStrategy setups
🔻


— #RiskManagement precedes #trading setups;
• Since theory doesn't make difference between theory & practice,
— Setups' forecasting don't forecast fail;
• Since practice makes the difference,
— #FixedRisk precedes #TradingStrategy setups
🔻
