Discover and read the best of Twitter Threads about #debugging
Most recents (8)
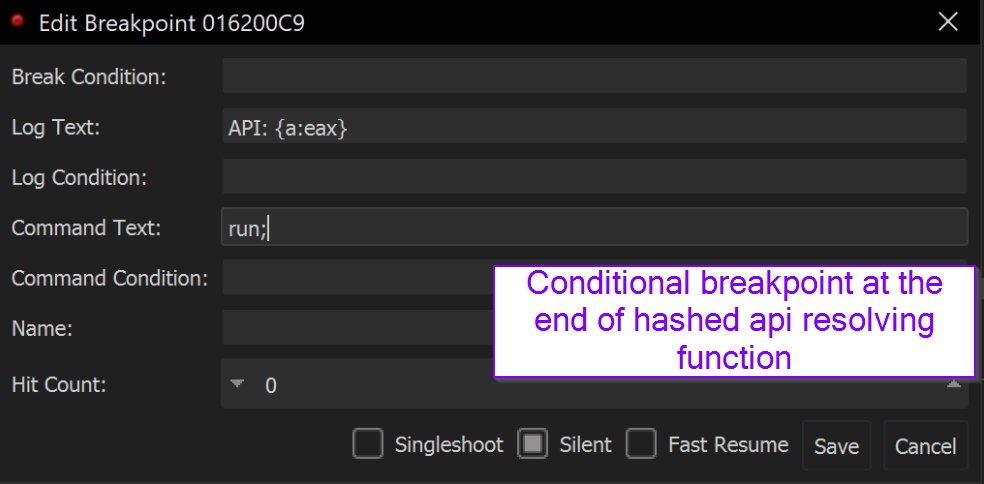
🚨Malware Tips 🚨 - Resolving API Hashes Using Conditional Breakpoints.
By adding breakpoints and log conditions to a function that resolves api hashes, it's possible to quickly resolve api hashes in bulk.
Thread
[1/11] 👇
#Malware #AgentTesla #Ghidra #Debugging


By adding breakpoints and log conditions to a function that resolves api hashes, it's possible to quickly resolve api hashes in bulk.
Thread
[1/11] 👇
#Malware #AgentTesla #Ghidra #Debugging


[1.1/11]
Link to original sample: bazaar.abuse.ch/sample/7512be2…
Link to Full Blog: embee-research.ghost.io/agenttesla-ful…
Link to original sample: bazaar.abuse.ch/sample/7512be2…
Link to Full Blog: embee-research.ghost.io/agenttesla-ful…
[1/10] 🚀 Advanced R Debugging: Debugging & error handling are essential skills for every R programmer. In this thread, we'll explore powerful tools & techniques like traceback(), browser(), & conditional breakpoints to make debugging in R a breeze. #rstats #datascience 

[2/10] 📝 traceback(): When your code throws an error, use traceback() to get a detailed call stack. This function helps you identify the exact location of the error in your code, making it easier to pinpoint the issue. #rstats #debugging #datascience
[3/10] 🔍 browser(): With browser(), you can pause the execution of your code & step through it one line at a time. This interactive debugging tool allows you to inspect the values of variables and expressions, which can be a game-changer when diagnosing complex issues. #rstats
Yesterday we talked about function writing and how to write them in R. But there is (unfortunately) a chance that your function won't work at the first try - and that's where debugging comes in 🕵️♀️
Ways to approach this problem are, for instance, to google the error message (if there is one), take separate parts of your code and let them run, or to use the more formal debugging tools that #rstats offers.
One major thing that I learned throughout the years is the power of #debugging. Irrespective of the programming language I use, debugging is for me key when it comes to understanding the functionality of code (also for code written by someone else).
Hello everyone 👋 my name is Cosima and I usually tweet at @cosima_meyer.
In my professional life, I work as a data scientist in the field of AI. I love my job because it allows me to work with fantastic teams to solve puzzles👩🏼💻
In my professional life, I work as a data scientist in the field of AI. I love my job because it allows me to work with fantastic teams to solve puzzles👩🏼💻

@cosima_meyer Before working in the industry, I explored my passion for research in academia. I hold a PhD from the University of Mannheim in #politicalscience (my dissertation dealt with post-civil war stability 🕊).
@cosima_meyer While working at @MZESUniMannheim, I co-founded a #datascience blog “Methods Bites” (@mzes_ssdl) which provides several hands-on tutorials on #NLP, scraping #Twitter data, #dataviz, or how to publish your package on #CRAN.
"I'm really really good at #debugging" a #sap #abap developer friend once said to me. I replied "oh thats awful". Why? Because it means he spent a lot of time finding bugs in code that was probably not covered by tests. But how do you debug efficiently? (1)
Many people use breaks points, watchpoints, breakpoints on messages, exceptions, post mortems, job debugging, etc and are successful that way. But at some point you have to "look at code". Over the years I've seen a few repeating patterns: (2)
"Just go for it". Is the error reproducible at all? Before debugging, it is better to check that, otherwise you lose a lot of time with code in which the error is not / only difficult to see by debugging. Because everything works as it should durching your debugging session. (3)
#React was indeed in the spotlight last month, so we spared your time and collected the champions of #meetup videos in January. Which one is your favorite? 🥳
blog.meetupfeed.io/react-meetups-…
#programming #devtools #application
blog.meetupfeed.io/react-meetups-…
#programming #devtools #application
🔥1st: #Debugging a Non Reproducible Crash by @almouro
Hear the story of an epic struggle to vanquish a non reproducible #bug and learn what to do (and what not).
@ReactAdvanced
meetupfeed.io/talk/debugging…
Hear the story of an epic struggle to vanquish a non reproducible #bug and learn what to do (and what not).
@ReactAdvanced
meetupfeed.io/talk/debugging…
😎2nd: #React Performance with React Dev Tools by @yanaiEdri
@ReactNext
All of us are familiar with the react #devtool - how to select a component and observe the state and the props - but this tool also has the profiler tab.
meetupfeed.io/talk/yanai-edr…
@ReactNext
All of us are familiar with the react #devtool - how to select a component and observe the state and the props - but this tool also has the profiler tab.
meetupfeed.io/talk/yanai-edr…
Como depurar programas #Python 🐍 através da linha de comando. 🐛 #debugging #debug
#DicaDePythonCodeShow
🧵
#DicaDePythonCodeShow
🧵
A maneira mais fácil de interagir com um script Python é usando o argumento `-i` (interactive) no python ou no ipython.
$ ipython -i script.py
O script é executado e então o terminal interativo abre permitindo a inspeção do estado das variáveis.
$ ipython -i script.py
O script é executado e então o terminal interativo abre permitindo a inspeção do estado das variáveis.

Para uma depuração mais estruturada o melhor é o pdb que é o debugger built-in do Python docs.python.org/3/library/pdb.…
Executar e parar na linha 5
$ python -m pdb -c "until 5" script.py
O script é executado e então ao chegar na linha 5 o interpretador pausa.
Executar e parar na linha 5
$ python -m pdb -c "until 5" script.py
O script é executado e então ao chegar na linha 5 o interpretador pausa.

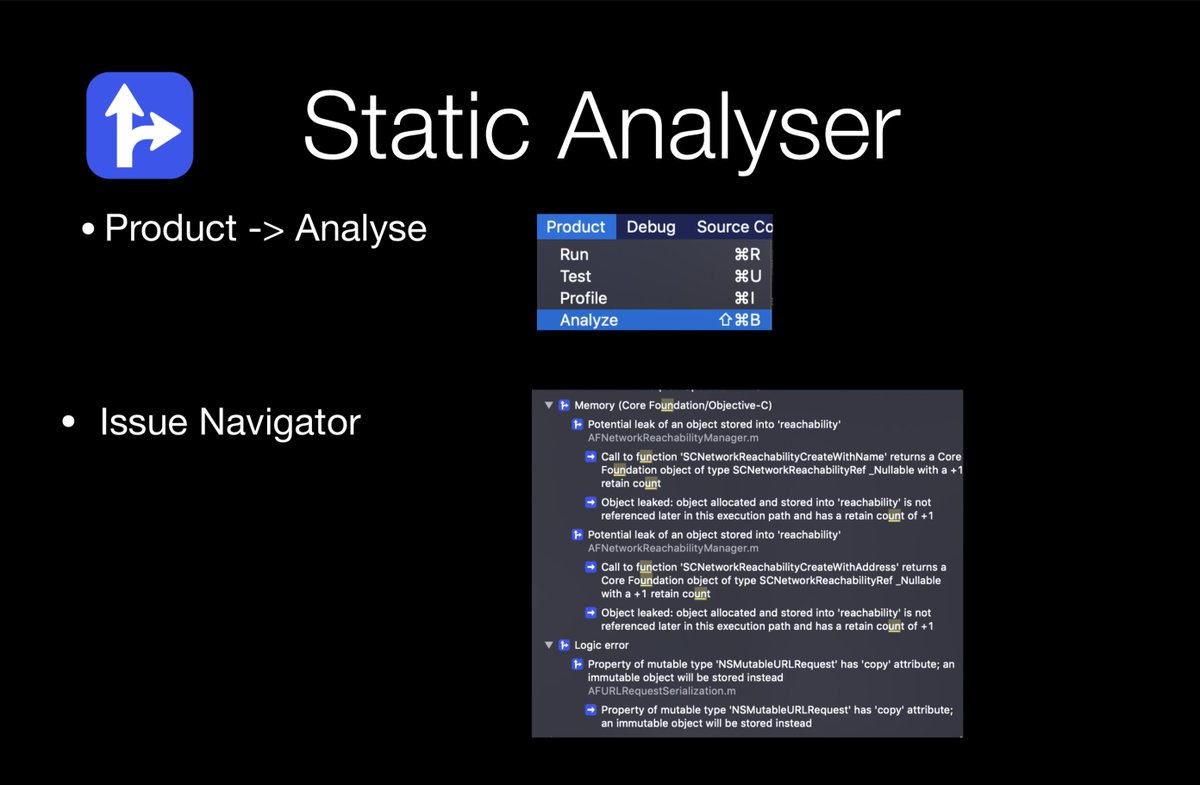
1/n Summary of my talk "Debugging in Xcode" at Swift Mumbai Chapter 8 @swiftindiagroup is as follow


