Discover and read the best of Twitter Threads about #OrderFlow
Most recents (14)
#orderflow can help make a reasonable guess if markets will remain in range or find potential strong break out points. This then helps build context to take positions on either range reversals or range breaks.
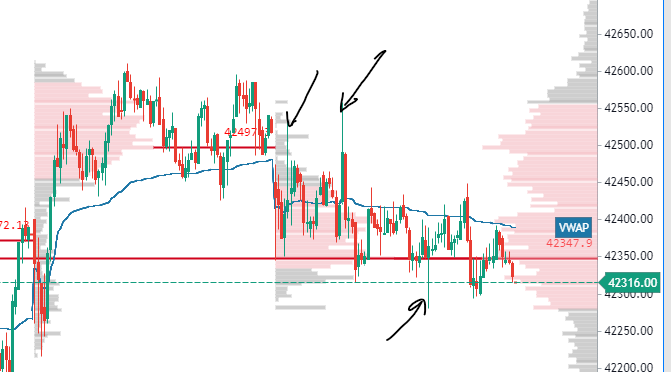
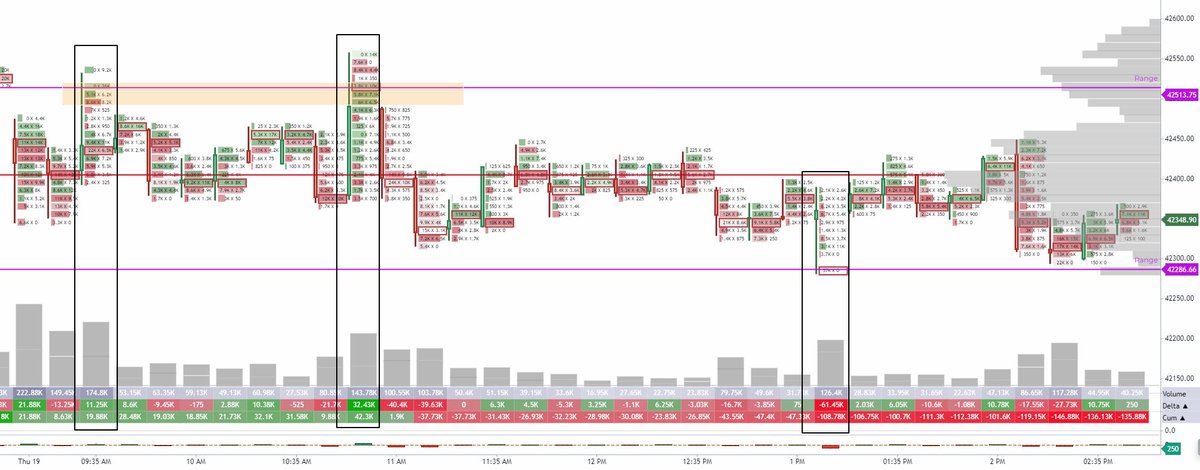
So today markets opened lower. Question- Break lower or pullback?(1/n)
So today markets opened lower. Question- Break lower or pullback?(1/n)

#banknifty as an eg., assuming first scenario as a potential pullback into yday range. This is stopped out by large limit sellers near 42500, this coupled with large OI increase and aggressive selling at 42500CE adds credence to a downside theory. 150K+ traded in 2 candles (2/n) 

1) Sup, folks. While you're busy in your #BlackFriday spending spree, I figured it might be a good time to write a thread about #journaling and, in general, all those practices that seem to be quite undervalued in the #trading world that I find useful. 🧵👇
2) First step: preparation.
Probably you noticed that almost every day, I tweet out stuff like this:
The whole sense of these posts is to remind me in advance of the levels where I'm interested in doing business for the trading session ahead.
Probably you noticed that almost every day, I tweet out stuff like this:
The whole sense of these posts is to remind me in advance of the levels where I'm interested in doing business for the trading session ahead.

3) The procedure is very simple:
- On your analysis TF (timeframe), mark out each relevant level;
- Describe the scenarios around these levels in an IF => THEN style;
- Take a screenshot and use it as a map during the trading session.
- On your analysis TF (timeframe), mark out each relevant level;
- Describe the scenarios around these levels in an IF => THEN style;
- Take a screenshot and use it as a map during the trading session.
1/n
Let's start with the definition of COT High/Low and how it is used in Daytrading with Orderflow
COT is the abbreviation for Commitment Of Traders. There are two COTs:
COT High
COT Low
🧵 #daytading #gocharting #orderflow
Let's start with the definition of COT High/Low and how it is used in Daytrading with Orderflow
COT is the abbreviation for Commitment Of Traders. There are two COTs:
COT High
COT Low
🧵 #daytading #gocharting #orderflow
2/n
COT High is cumulative bid/ask Delta starting from the moment when the price makes new high or repeats previous one.
COT Low is cumulative bid/ask Delta starting from the moment when the price makes new low or repeats previous one.
COT High is cumulative bid/ask Delta starting from the moment when the price makes new high or repeats previous one.
COT Low is cumulative bid/ask Delta starting from the moment when the price makes new low or repeats previous one.
COT helps to see buy/sell balance after new price level has been reached. In other words, it helps us identify TRAPPED buyers and sellers in the market
Price changes perception.
Your view of the price level on a Friday and your view of the same price at the same level on a Monday may be 2 different things.
Prices force you to think differently.
Your view of the price level on a Friday and your view of the same price at the same level on a Monday may be 2 different things.
Prices force you to think differently.
In the markets,
Situations change.
Things happen.
Sentiment moves
Prices react.
Let me repeat - Prices REACT
The degree of reaction changes and forces traders who were previously bullish to now go bearish or vice versa
Have you seen this before?
Situations change.
Things happen.
Sentiment moves
Prices react.
Let me repeat - Prices REACT
The degree of reaction changes and forces traders who were previously bullish to now go bearish or vice versa
Have you seen this before?
As reactions/ responses flow in, price starts moving abruptly
Then inventory has to adjust.
Inventory is defined as an existing position of the market participant
I could be cash market inventory as in stocks, or could be derivatives as in futures or options.
Then inventory has to adjust.
Inventory is defined as an existing position of the market participant
I could be cash market inventory as in stocks, or could be derivatives as in futures or options.
as mentioned previously , have not been trading overnight positions and happy with all the volatility and the massive intra day swings.
This is excellent for trading .
For the swing, of interest to me is the lows in #Nifty of today right at the channel of importance at 16980
This is excellent for trading .
For the swing, of interest to me is the lows in #Nifty of today right at the channel of importance at 16980
There hasn't been buying in the #Orderflow for quite a while.
Was watching 17700 earlier last week and that did not show any buying.
This is a snippet from our room
Was watching 17700 earlier last week and that did not show any buying.
This is a snippet from our room

#BTC #VolumeProfile Aquí hay un uso operativo perfecto del perfil de volumen el cual lo explico brevemente (aunque con más tiempo prepararé un hilo con mayor detalle). Primero vamos con el gráfico: 

El precio se debate constantemente entre equilibrios y desequilibrios. Cuando la oferta y la demanda negocian y están en equilibrio construyen un rango lateral (aunque también puede ser lateral alcista o bajista como vimos el ejemplo de #BTC).
265 bookd half
#BNF #Orderflow was clean and long from the open.
My long view from 09.30 am
The entire trading room was long and no one picked shorts as #process was clean for us
My long view from 09.30 am
The entire trading room was long and no one picked shorts as #process was clean for us

#BTC
i use sierra chart but @ExochartsC is likely the better option for newcomers
maybe one day i write a manual (just kidding 🤓)...but until then y can check out the @Workedia
#orderflow channel
my fav go to vids are the old DTG vids on YT
👇
i use sierra chart but @ExochartsC is likely the better option for newcomers
maybe one day i write a manual (just kidding 🤓)...but until then y can check out the @Workedia
#orderflow channel
my fav go to vids are the old DTG vids on YT
👇
oldie but goodie...good take on oderflow from oldschool tradif traders...with 3 real world OF setups in it...at about the 50min mark theres a summary of how these 3 setups do work together
keep in mind..OF is part of an approach based on "levels" tho!

keep in mind..OF is part of an approach based on "levels" tho!

very important to understand!!!!
for these guys OF is not a standalone tool but has a specific place in an overall approach!!
also y have to import the setups into the crypto space..y have to adjust for volatility and other things ofc
for these guys OF is not a standalone tool but has a specific place in an overall approach!!
also y have to import the setups into the crypto space..y have to adjust for volatility and other things ofc
As part of Orderflow releases, we have enhanced the existing VWAP indicator to show standard deviation channels
Why is it important? For people who do not understand Market Profile charts, these bands are good approximations of a developing Value Area and POC
#VWAP #Orderflow
Why is it important? For people who do not understand Market Profile charts, these bands are good approximations of a developing Value Area and POC
#VWAP #Orderflow

We have now released an important Orderflow Indicator called the Bar Statistics
A Bar Statistics provides a tabular view of the important Orderflow metrics at a candle level in a time series format while each of the footprint provides a cohort view of the similiar metrics
A Bar Statistics provides a tabular view of the important Orderflow metrics at a candle level in a time series format while each of the footprint provides a cohort view of the similiar metrics

To activate this particular indicator, please choose Bar Statistics from Inidcators menu on the top bar under Orderflow section
#Orderflow #Footprint #Cluster #NSE
#Orderflow #Footprint #Cluster #NSE

[1/X] Attempt to explain Orderflow basics. It will be a long thread but will try to make the content worth the read.
Below is a Depth of Market (DOM). The
Blue ones = Bid Limit orders
Red ones = Ask Limit orders
So what happens to these orders in the trade cycle
#Basics
Below is a Depth of Market (DOM). The
Blue ones = Bid Limit orders
Red ones = Ask Limit orders
So what happens to these orders in the trade cycle
#Basics

[2/X] Such limit orders are invariable absorbed by the Market Orders.
It is the Market Orders that drive the markets up and down.
Lesson # 1: Every auction starts with a Bid and an Ask
Lesson # 2: Market orders move the price
It is the Market Orders that drive the markets up and down.
Lesson # 1: Every auction starts with a Bid and an Ask
Lesson # 2: Market orders move the price
Bueno amig@s, vamos cerrando máquinas aprovechando para compartir un hilo, explicando una operación de última hora en el #NQ_F (contrato mini de junio y para desearos a tod@s un feliz (y confinado) fin de semana.
😷 👇
#orderflow
😷 👇
#orderflow
I work with candle sticks also. They are present in all my #Orderflow charts and I have them plotted to the left of my charts .
This disclaimer to all who think I do not use candle sticks and bars.
I repeat they are present in all my charts, even my #Orderflow charts.
This disclaimer to all who think I do not use candle sticks and bars.
I repeat they are present in all my charts, even my #Orderflow charts.
But for intra-day , if you are using 5 mins and 15 mins or even 30 mins and using them to make decisions, you are at a big disadvantage.
Allow me to explain. I'll take a few minutes
Allow me to explain. I'll take a few minutes
Candles give us the Open, High, Low ,Close. We call it OHLC.
- 4 parameters to make trading decisions out of.
Then the relation between the open and the close and the shape it gets decides
a) the color of the bar
b) Bullishness or bearishness
Would you agree?
- 4 parameters to make trading decisions out of.
Then the relation between the open and the close and the shape it gets decides
a) the color of the bar
b) Bullishness or bearishness
Would you agree?
Thought of arranging my earlier tweets on #mp_amt in serial order. Hope it would be useful-
#mp_amt
#LearningTogether
#mp_amt
#LearningTogether
2. Composite portrait of the Model Superforecaster By Philip Tetlock and Dan Gardener in Superforcasting


