Discover and read the best of Twitter Threads about #NQ
Most recents (11)
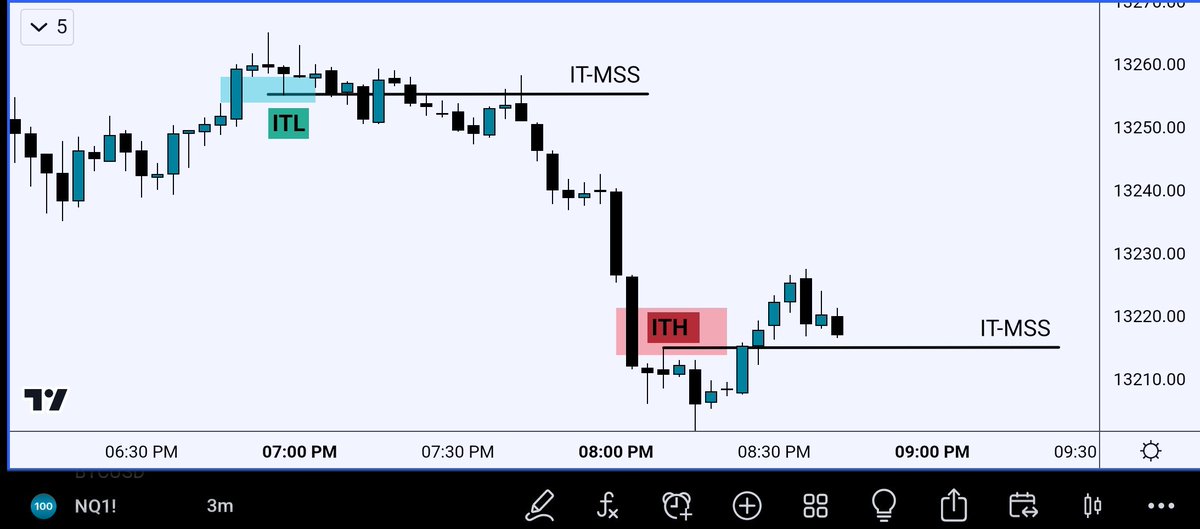
Forget the ICT Market Structure Shift 📈
Use Intermediate Term High and Lows instead
These are highs and lows that fill a FvG 🎯
3 Min intermediate term MSS then enter on a 1 min Fvg or ITOB 💥
Straight Fire 🔥🔥 You will be profitable with this strategy!!!!!
Use Intermediate Term High and Lows instead
These are highs and lows that fill a FvG 🎯
3 Min intermediate term MSS then enter on a 1 min Fvg or ITOB 💥
Straight Fire 🔥🔥 You will be profitable with this strategy!!!!!

You will know when the trend is changing 📉
3 MIN ITL and ITH are almost never broken until there is a change in direction that lasts for a few hours .
#ES and #NQ this strategy is almost idiot proof
3 MIN ITL and ITH are almost never broken until there is a change in direction that lasts for a few hours .
#ES and #NQ this strategy is almost idiot proof
2.) You only need to mark out the possible liquidity 🧲 on HTF ( EQH , EQL, PDH, PDL ) Just so you know of possible reversal incoming .
BIG #TRADE Q1: Shortened Plan
Short #NASDAQ: Thread ⬇️⬇️⬇️
Read the whole thread!
➡️ pls retweet
1. Flight path
2. Entry / exit dates
3. Trade mgmt
4. Entry options
5. Background
6. Other Q1 Trades
PS - Not an advice, this is what I plan to do!
Short #NASDAQ: Thread ⬇️⬇️⬇️
Read the whole thread!
➡️ pls retweet
1. Flight path
2. Entry / exit dates
3. Trade mgmt
4. Entry options
5. Background
6. Other Q1 Trades
PS - Not an advice, this is what I plan to do!
Entry / Exit dates: Turn dates is a guide.
1. Entry date: After 20th Jan when price is near high range
2. Exit date: March 17th or thereabout. Read trade management.
1. Entry date: After 20th Jan when price is near high range
2. Exit date: March 17th or thereabout. Read trade management.
There is a lot of talking around #Footprint #charts in #cryptotwitter lately. Many people smash them on their templates without even knowing the basics of #DOM reading, making many mistakes when interpreting them. This thread will get you covered 🧵👇
#Footprint candlesticks were first introduced to the public by Market Delta back in 2003. The most famous one is the Bid x Ask split view and most traders' first approach with Footprints is with this kind of visualisation, which is helpful on thick, liquid markets, like bonds. 

One of the most common mistakes that inexperienced traders make is comparing orders that hit the Bid (left side) with those that lift the offer (right side) horizontally.
The interaction among market participants always happens diagonally from the Bid to the Ask.
The interaction among market participants always happens diagonally from the Bid to the Ask.
#NQ_F #NQ Post CPI landscape. Long setup into continuation, cover at the top of the balance - multi day resistance. A new bull flag is being formed. 

Structural breaks during the upside move keeps the buy side in control. A rejection of the previously accepted level may offer a short setup. Double top first rule.
#NQ_F #NQ A large view. A clear pullback with a first stop around 950ish. A few potential scenarios are presented. A double top with lower high would be preferable for shorts, a back test of the broken wedge is for longs. 

A smaller view. The price made to the bottom of the broken consolidation area. A clear bear flag. Post CPI action to watch. The default outcome of this pattern is to resume the downside. A failed bear flag is bullish. 

the previous day close 13050ish acceptance/rejection to watch. may set the tone for today's day session.
#NQ_F #NQ A breach of the bull flag formation and downside move into yearly projected zone. At this point, a reversal is highly unlikely. We may see reactions from each level on first test. 

Some time ago I posted a weekly view indicating that the wave 3 is about to end and we should expect a pullback - the wave 4 (38.2% ret).
buy side is active at the zone. they may stop the bleeding for now.
#NQ_F #NQ Inside session so far. A narrow range. The ON session range expansion to watch, it would set a short term directional bias to tag along. The air pocket below is a good candidate to fill, but let the market show its hand first. 

At this point the previous day low is a resistance. The bearish sentiment, triggered by yesterday's fake out, is intact. Buyers may attempt to change it at the opening.
#NQ #NQ An attempt to break outside of the flag. The previous high is pivoting level now. The price may oscillate around it until accepting/rejecting. 

So far a reaction from 420 level mentioned in the previous tweet.
Rotational charts, like p&f offer a better inside for me through price action patterns.
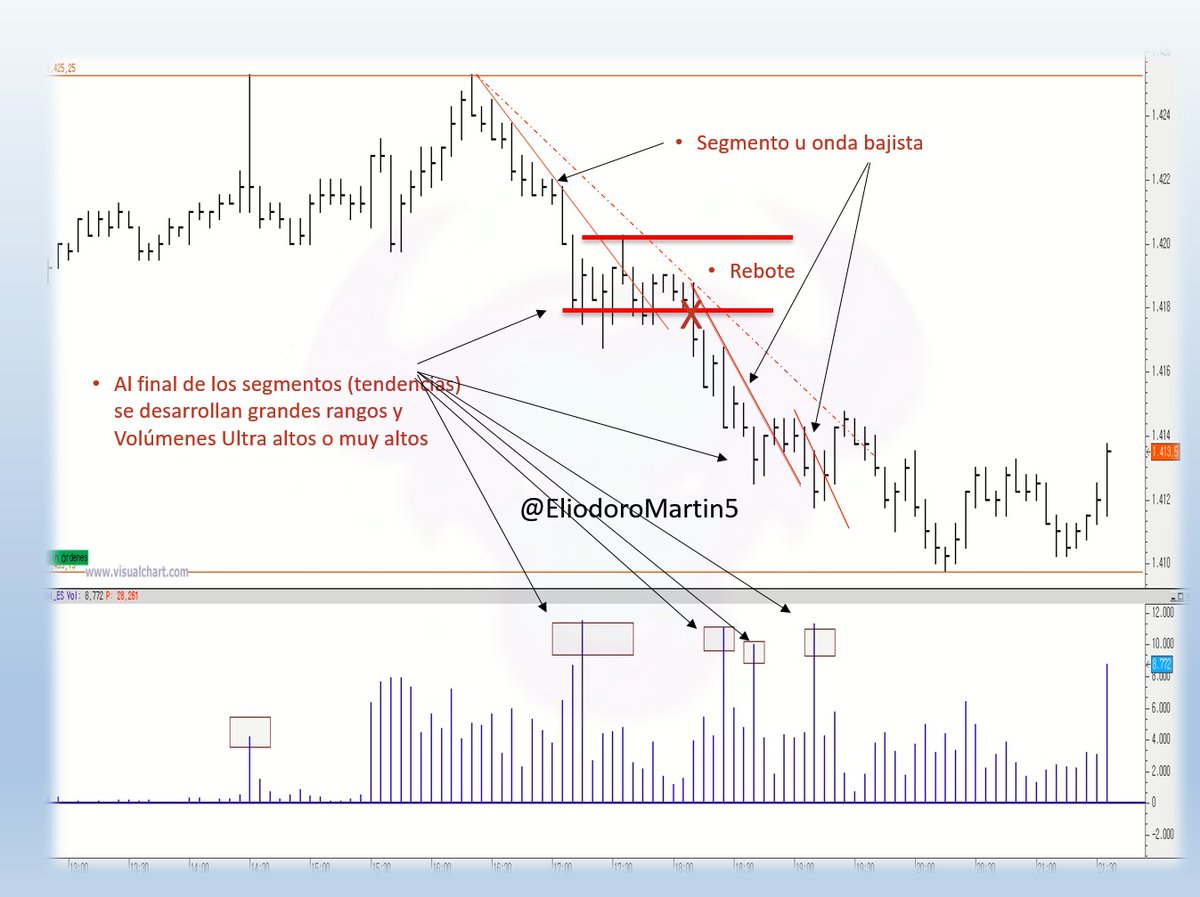
Os traigo hoy unas ideas que podéis utilizar para cuando estáis esperando entrar al mercado en las #cripto en #BTC o para cuando estéis con posiciones abiertas. Vale para cualquier activo. #ES, #NQ, #GC, #HC, #CL Lo aprendí como FASE DE MOVIMIENTO. Es = q Mark up/Markdown. 1/14 

1/x
Wow, my first thread.
Analyzing the NQZ21 contract, I looked at 9/2 to 12/10 and at various opening ranges (OR), gap fills and overnight high/low. I only looked at the last 72 days. I downloaded data from Sierra chart and analyzed it in excel. #NQ_F #NQ
Wow, my first thread.
Analyzing the NQZ21 contract, I looked at 9/2 to 12/10 and at various opening ranges (OR), gap fills and overnight high/low. I only looked at the last 72 days. I downloaded data from Sierra chart and analyzed it in excel. #NQ_F #NQ
2/x
I did use NQ close data from Yahoo finance because the previous close line on SC was being stubborn and not giving me correct data (probably my fault). There’s a bunch of numbers and percentages, you can scroll to the end if you’d like, or ignore it. idc.
I did use NQ close data from Yahoo finance because the previous close line on SC was being stubborn and not giving me correct data (probably my fault). There’s a bunch of numbers and percentages, you can scroll to the end if you’d like, or ignore it. idc.
3/x
30m OR L =LOD 38.9% (28/72)
30m OR H =HOD 31.9% or (23/72)
So 70.8% (51/72) of the time, the 30 min OR puts in HOD or LOD.
Which means both sides are broken 29.2% (21/72) because the 30m OR did not put in both the HOD and LOD at any point.
30m OR L =LOD 38.9% (28/72)
30m OR H =HOD 31.9% or (23/72)
So 70.8% (51/72) of the time, the 30 min OR puts in HOD or LOD.
Which means both sides are broken 29.2% (21/72) because the 30m OR did not put in both the HOD and LOD at any point.
monitor below chart closely.
$NQ just re-tested the lower support level
$NQ low = 11,598
they can't allow to plunge below 11,600 level.
otherwise, tomorrow bloodbath.
see below Support & Resistance levels
super accurate😉
stop-run levels on both sides: bulls & bears👇
$NQ just re-tested the lower support level
$NQ low = 11,598
they can't allow to plunge below 11,600 level.
otherwise, tomorrow bloodbath.
see below Support & Resistance levels
super accurate😉
stop-run levels on both sides: bulls & bears👇


