Discover and read the best of Twitter Threads about #LetsLearn
Most recents (7)
Some thoughts on today’s schools announcements for the @stmonicas community.
1. We CAN’T wait to see school full again. It’s only a building when none of the pupils are in it. Most importantly we are looking forward to some type of normal. #excited #letslearn
1. We CAN’T wait to see school full again. It’s only a building when none of the pupils are in it. Most importantly we are looking forward to some type of normal. #excited #letslearn
2. There is a real challenge around onsite testing. Please can parents be patient as we plan how best to manage this. We may well need a phased return - the testing isn’t as easy to facilitate as @BorisJohnson suggests. It’s the most challenge part of returning.
3. New guidance experts pupils to wear face coverings in lessons. We will look to follow the guidance as closely as possible. As ever we can’t do things everyone likes, but things that are in the interests of everyone. We just have to get on with it.
#LetsLearn
#MarketData sort
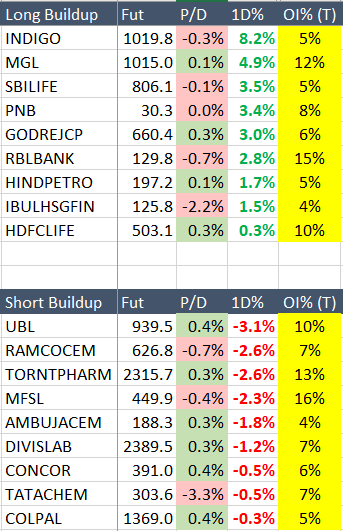
Very few number of stocks showing OI buildup after 11% rally in 6 days..
This suggests Table Tennis action in market going forward.
Fresh commitment missing at higher levels.
#MarketData sort
Very few number of stocks showing OI buildup after 11% rally in 6 days..
This suggests Table Tennis action in market going forward.
Fresh commitment missing at higher levels.
#LetsLearn
#MarketData sort
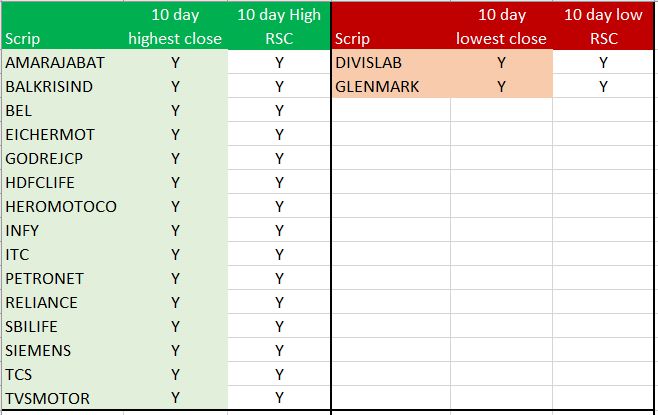
More number of stocks with Relative Strength against Index closed at a 10 day high vs very few at 10 day low with weakness.
This is momentum based market breadth scanner which is signalling ratio of 15:2.
Bullish
#MarketData sort
More number of stocks with Relative Strength against Index closed at a 10 day high vs very few at 10 day low with weakness.
This is momentum based market breadth scanner which is signalling ratio of 15:2.
Bullish
#LetsLearn
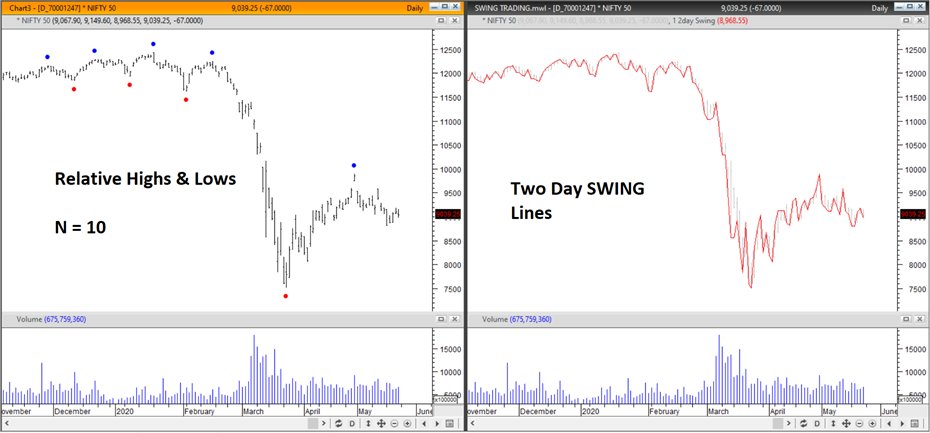
Earlier I explained how to make charts cleaner by using Two day Swing Lines & today I explained how to identify Relative Highs & Relative Lows in an objective manner
Link1:
Link2:
1/n
Earlier I explained how to make charts cleaner by using Two day Swing Lines & today I explained how to identify Relative Highs & Relative Lows in an objective manner
Link1:
Link2:
1/n
#LetsLearn
Now I will try to show how to make a TRADING system out of the two....
Tools used:
Relative High AND Low identifier (N=10) and
Two day Swing Lines
.....2/n
Now I will try to show how to make a TRADING system out of the two....
Tools used:
Relative High AND Low identifier (N=10) and
Two day Swing Lines
.....2/n
#LetsLearn
Further to the above thread to find trade setups using the above mentioned tools.
Topic: Identifying "TREND FOLLOWING trade setups" using Top-Down approach
- Weekly and Daily charts are taken with Relative Highs and Relative Lows marked (parameter N=5)
..contd..
Further to the above thread to find trade setups using the above mentioned tools.
Topic: Identifying "TREND FOLLOWING trade setups" using Top-Down approach
- Weekly and Daily charts are taken with Relative Highs and Relative Lows marked (parameter N=5)
..contd..
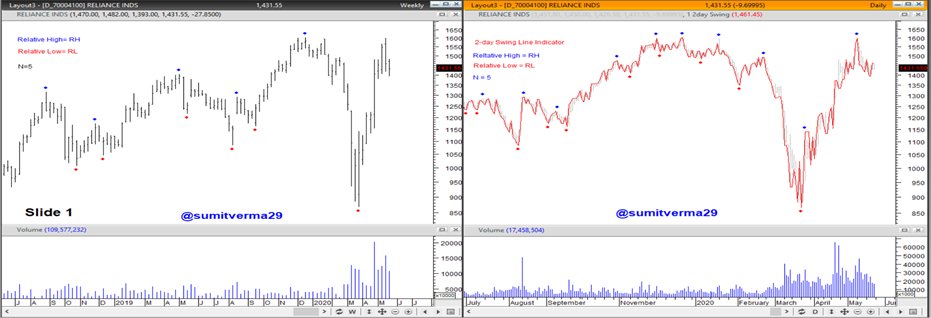
A thread on how to Define correct Swing Highs / Lows for the purpose of Dow Theory analysis or drawing Trendlines:
Thomas DeMark in his book "The New Science of Technical Analysis" said that drawing
of trend lines is a highly arbitrary process. 1/n
Thomas DeMark in his book "The New Science of Technical Analysis" said that drawing
of trend lines is a highly arbitrary process. 1/n
A trend line is typically intended to connect
several Relative Highs or Relative lows. If there are two or more such points, the trend line can be drawn
precisely. (notes from Jack Schwager's book "The Complete Guide to the Futures Market").. 2/n
several Relative Highs or Relative lows. If there are two or more such points, the trend line can be drawn
precisely. (notes from Jack Schwager's book "The Complete Guide to the Futures Market").. 2/n
Relative high is a High that is higher than high on the N prior & N succeeding bars.
where N is a number of bars (can be anything as per individual's setup 5 / 10 / 20...)
if N = 5, Relative High is Current High > last 5 days & succeeding 5 days. Viceversa for Relative Low.. 3/n
where N is a number of bars (can be anything as per individual's setup 5 / 10 / 20...)
if N = 5, Relative High is Current High > last 5 days & succeeding 5 days. Viceversa for Relative Low.. 3/n
Further to my initiative of #LetsLearn where my objective is to de-code complex things & make things simple and available for analysis...
Today, I will try to make a complex looking chart into a clean & simple one (only useful for people who are PATTERN based trader/analyst)..1/n
Today, I will try to make a complex looking chart into a clean & simple one (only useful for people who are PATTERN based trader/analyst)..1/n
amazon.in/Pring-Price-Pa…
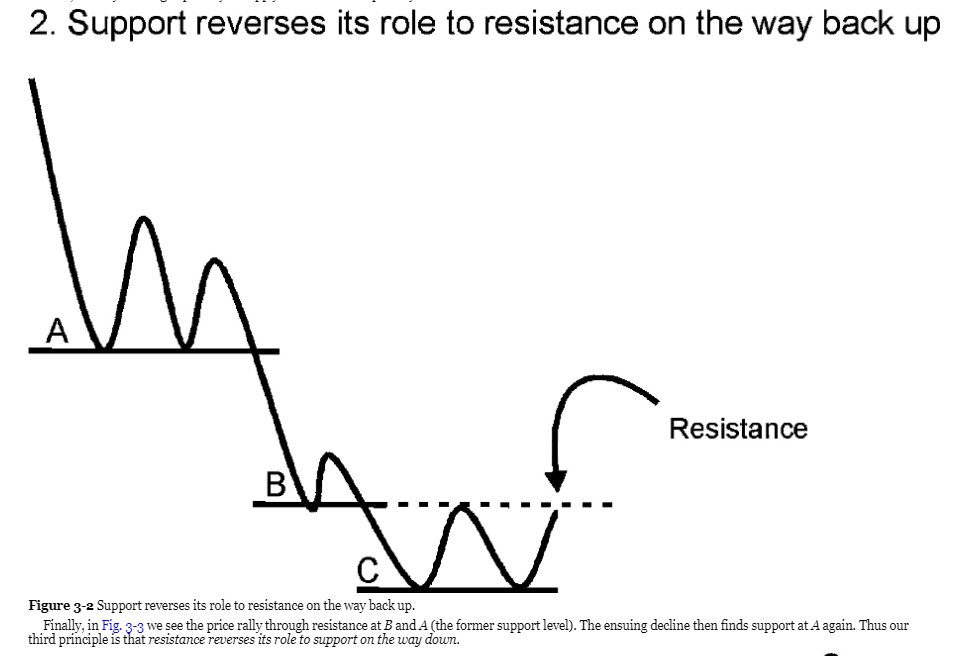
Further as disclaimer, the presented way will be more useful for people who have followed Martin Pring's book on chart patterns.. (images taken from Kindle version of the book)

Further as disclaimer, the presented way will be more useful for people who have followed Martin Pring's book on chart patterns.. (images taken from Kindle version of the book)

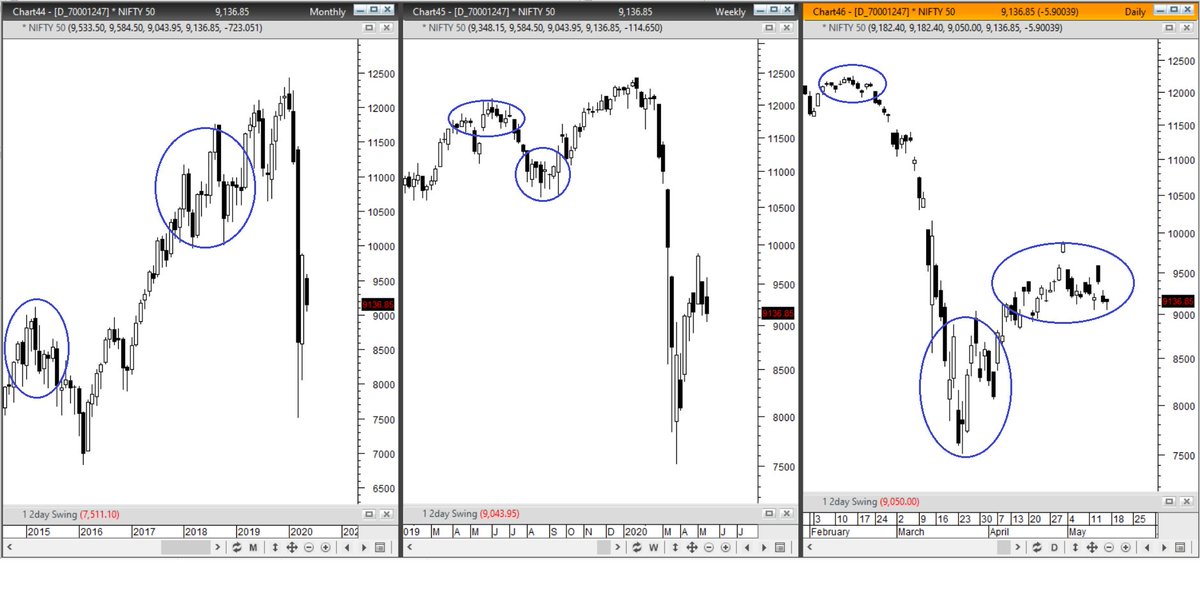
The below are Candlestick charts of #NIFTY50.. a lot of times market moves inside a range throwing multiple Bullish/Bearish candlestick patterns and adds up the clutter in analysis (Pro Candlestick / Bar / short term traders wont have a problem) but for others it is a confusion.. 
#LetsLearn
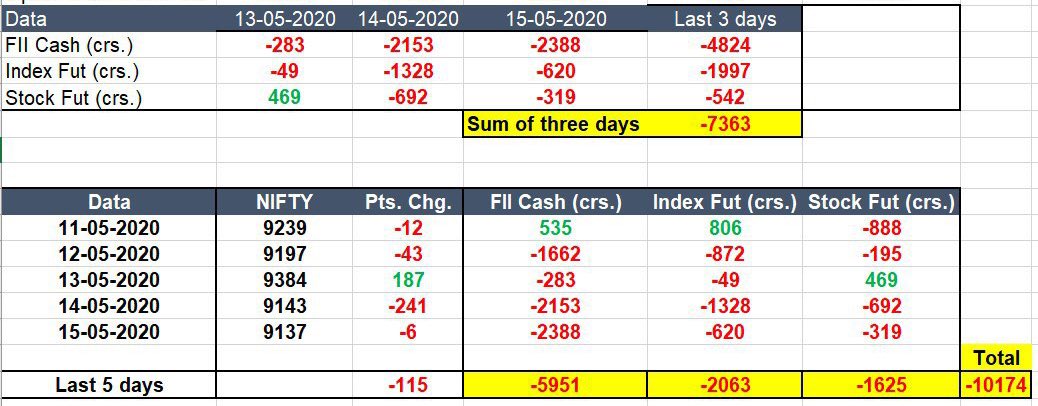
This is how see / read through #FII data.. (Participantwise category)
Quantum of Buying / Selling in. cash Market + Index Futures + Stock Futures.
How the flows are basis last 3 days? How the flows are basis current week? It give an indication which camp is strong
This is how see / read through #FII data.. (Participantwise category)
Quantum of Buying / Selling in. cash Market + Index Futures + Stock Futures.
How the flows are basis last 3 days? How the flows are basis current week? It give an indication which camp is strong
Starting a new series of #LetsLearn wherein I will try to present few interesting techniques in charting softwares where we can use our creativity to see different things:
cont..
@JainSumeetS @purohitjay @entrepreneur987 tagging u so that it reaches maximum people who can benefit
cont..
@JainSumeetS @purohitjay @entrepreneur987 tagging u so that it reaches maximum people who can benefit
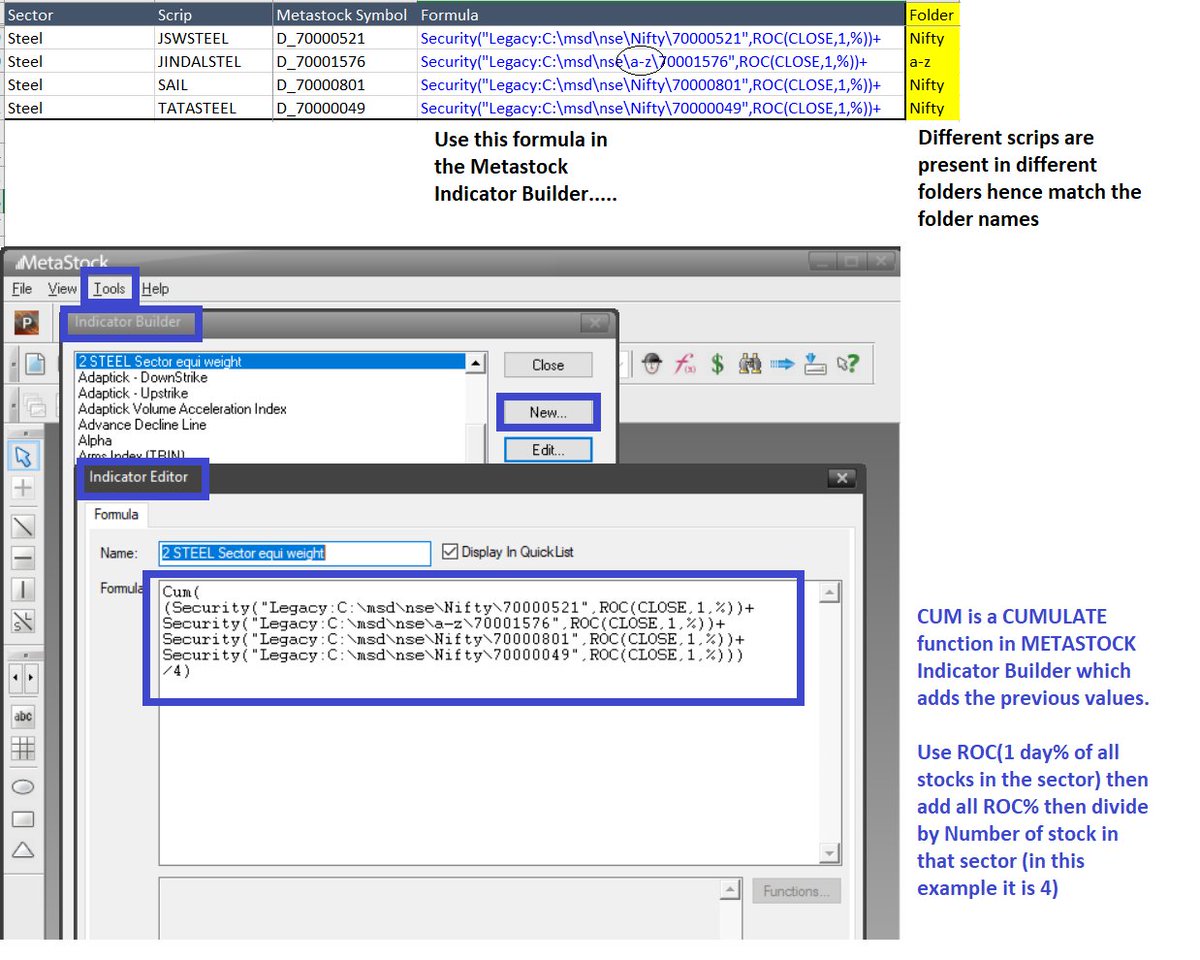
Topic 1: How to create Equi Weighted Charts in METASTOCK?
in F&O there r many stocks with different sectors, to create a sector chart of our own we need Symbols (example here is STEEL sector stocks) then form the formula given in the screenshot. Self explanatory.
#LetsLearn

in F&O there r many stocks with different sectors, to create a sector chart of our own we need Symbols (example here is STEEL sector stocks) then form the formula given in the screenshot. Self explanatory.
#LetsLearn
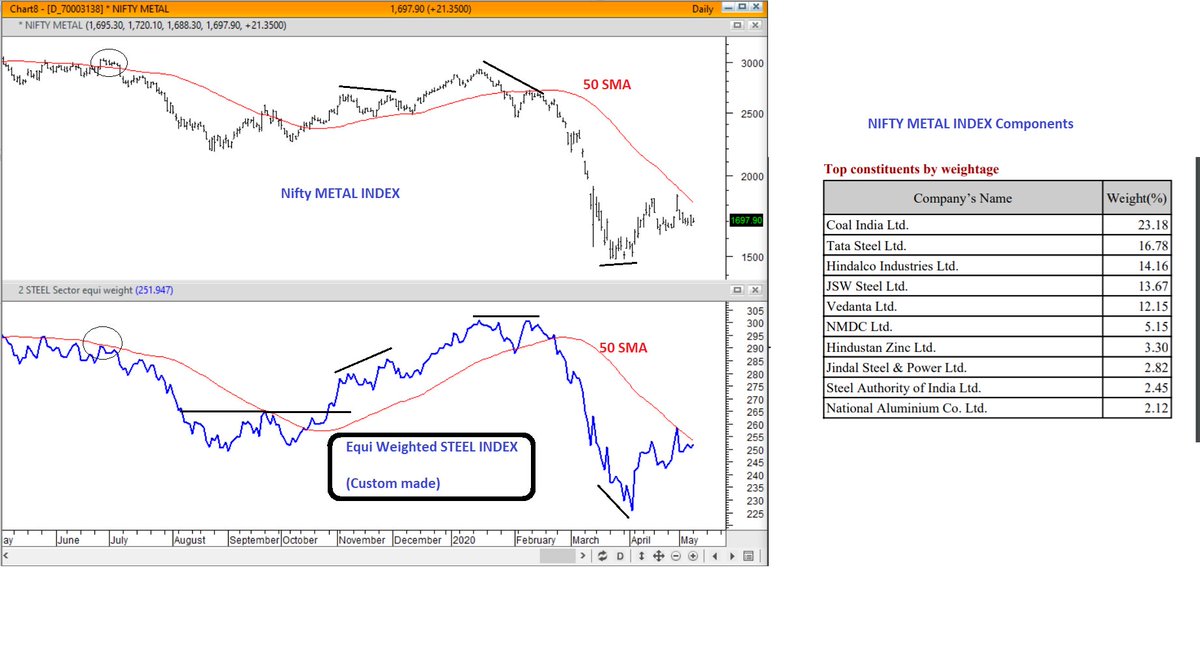
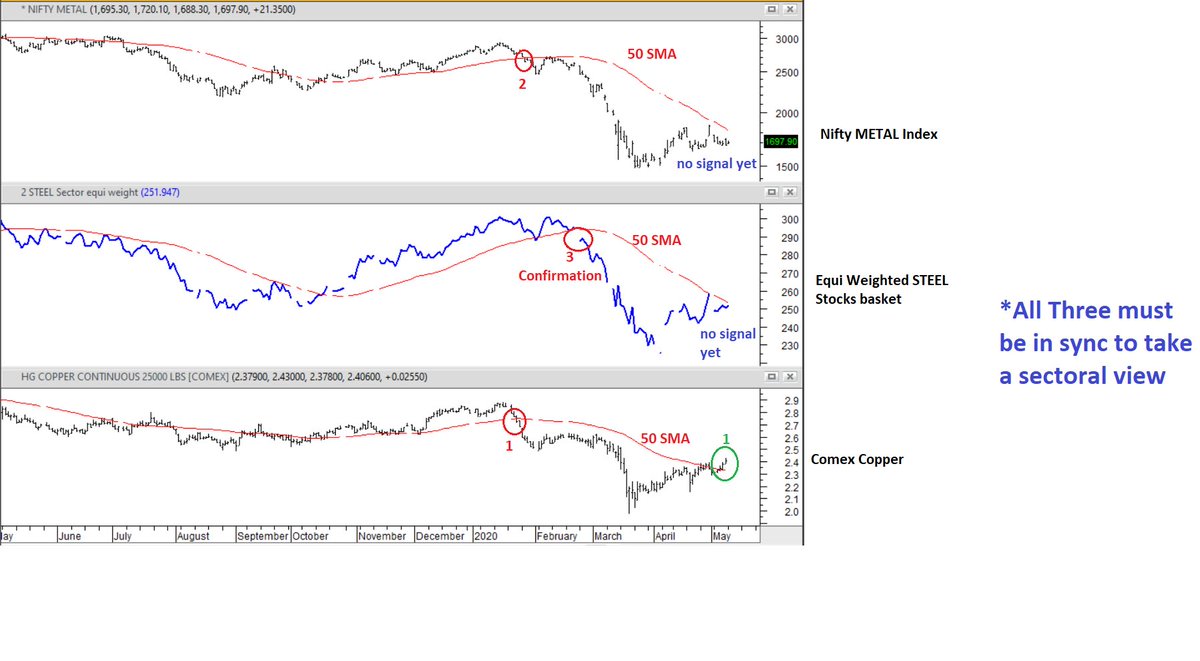
now how to use this chart to form a view?
Based on intermarket analysis, this can be helpful when looked upon for a trending move in sync with direction of COPPER (international) and Nifty Metal Index (if possible with Global Metal stock Indices too)..
#LetsLearn
Based on intermarket analysis, this can be helpful when looked upon for a trending move in sync with direction of COPPER (international) and Nifty Metal Index (if possible with Global Metal stock Indices too)..
#LetsLearn
