Discover and read the best of Twitter Threads about #FireCharts
Most recents (7)
1/6 #OrderBookAnalysis 🧵
TLDR: Liquidity=Sentiment
Liquidity placement in the order book reveals #Sentiment for a price range! 📊📈
💧 When more liquidity is concentrated around a particular price level, it indicates increased confidence or interest from #traders...
TLDR: Liquidity=Sentiment
Liquidity placement in the order book reveals #Sentiment for a price range! 📊📈
💧 When more liquidity is concentrated around a particular price level, it indicates increased confidence or interest from #traders...

2/6 Analyzing the order book with a #DataViz tool like #FireCharts helps you mitigate risk by replacing speculative decisions with data based decisions.
No reason to speculate when you can literally see where higher concentrations of liquidity mark resistance and support.
No reason to speculate when you can literally see where higher concentrations of liquidity mark resistance and support.

3/6 Knowing where liquidity ISN'T, is as important as knowing where it is. Thin liquidity indicates zones with greater potential for volatility since price moves through them with less friction.
But there is one more aspect of #OrderBookAnalysis I personally value the most...
But there is one more aspect of #OrderBookAnalysis I personally value the most...

$BTC & $ETH
Here are the most important levels to watch!
🔻
Here are the most important levels to watch!
🔻
Yesterday I tweeted about mid-term holders sending $BTC to exchanges.
$BTC got rejected at $17k and didn't manage to push into the sell liquidity zone.
This strongly indicates that the market still has a strong bearish sentiment.
$BTC got rejected at $17k and didn't manage to push into the sell liquidity zone.
This strongly indicates that the market still has a strong bearish sentiment.
There is a high likelihood that $BTC will drop in the next 12 hours
Find out why👇
Find out why👇
1. Two alerts were triggered today about high BTC inflow mean into exchanges.
This can cause a short-term $BTC price drop.
more info about this in the thread below.
This can cause a short-term $BTC price drop.
more info about this in the thread below.
1 // #Bitcoin Bottom Signals 🚀🔥
In just a few months, #Bitcoin traded $70000 all the way down to $20000. A historical drawdawn, the right time to look at potential bottom signals
I'll move over several datapoints. The more you'll see, the more bottom-ish. Let's go 👇
In just a few months, #Bitcoin traded $70000 all the way down to $20000. A historical drawdawn, the right time to look at potential bottom signals
I'll move over several datapoints. The more you'll see, the more bottom-ish. Let's go 👇
1 // Exchange Reserve. Reserves are trending down 🟢
Less #Bitcoin on exchanges = Less potential selling pressure
Chart:
cryptoquant.com/asset/btc/char…

Less #Bitcoin on exchanges = Less potential selling pressure
Chart:
cryptoquant.com/asset/btc/char…


2 // Drawndown from ATH 🟠
Previous Bear Markets: at least 80%
Current Bear Market: 70%
Chart:
studio.glassnode.com/metrics?a=BTC&…
Previous Bear Markets: at least 80%
Current Bear Market: 70%
Chart:
studio.glassnode.com/metrics?a=BTC&…

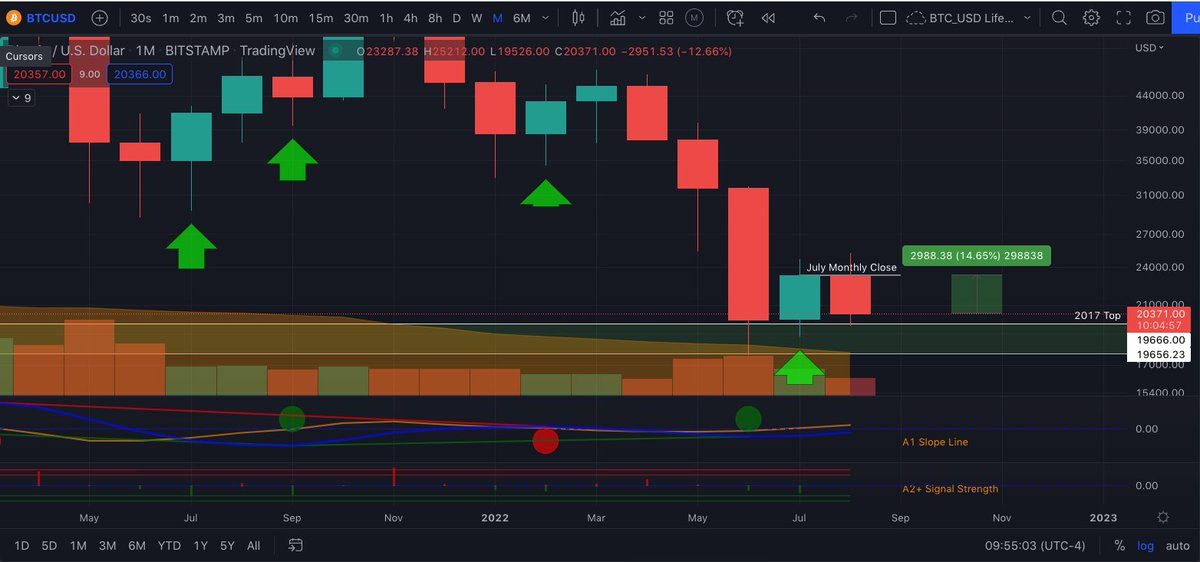
If you are questioning how or why anybody would even consider the possibility of a green Monthly close today for #Bitcoin, congrats on not being a blind sheep follower. You should question every trade setup before you push any buttons. Let's analyze 🧵... 

Depending on what exchange you're on, #Bitcoin had a July low of ~$18,763 and closed ~$23,322. A rally to that level would require a 15% move from here. Is that a high probability outcome? Absolutely not. More on that in a bit... 

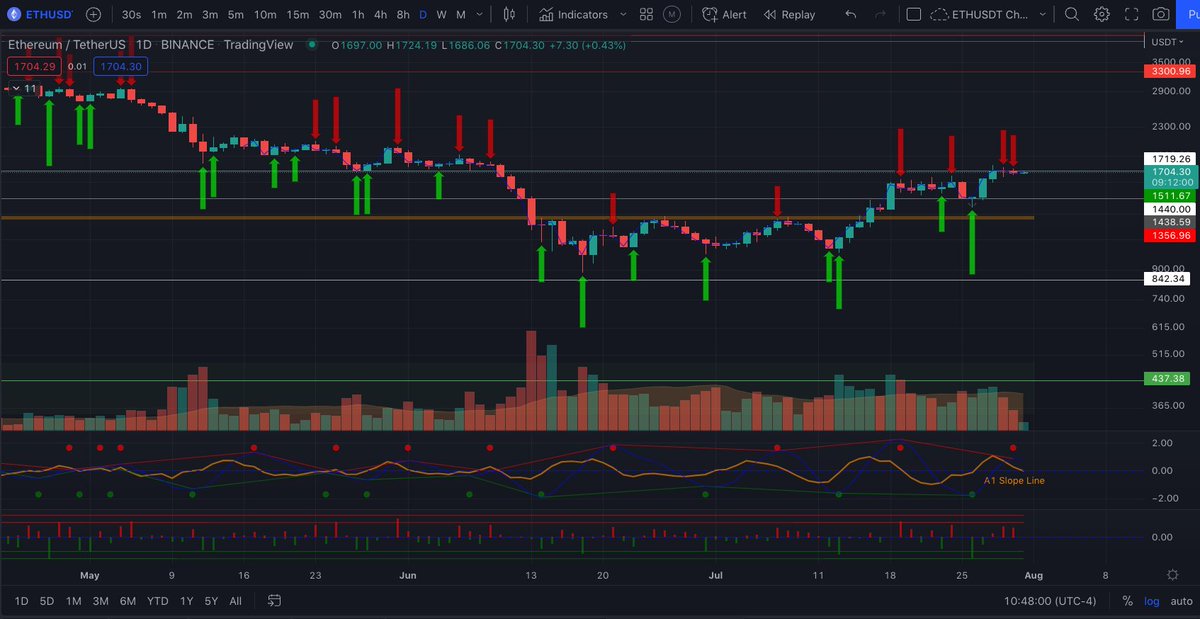
1/11 We've been trading sideways most of the weekend, but today is a Daily, Weekly and Monthly candle close. Expecting some volatility.
This 🧵 will analyze #Ethereum charts and Trend Precognition signals to see how things are developing as we near the close. #NFA
This 🧵 will analyze #Ethereum charts and Trend Precognition signals to see how things are developing as we near the close. #NFA

2/11 Yesterday I shared an #ETHUSDT chart showing a tentative short signal from the Trend Precognition A2+ algo. At last night's D close the signal printed and new short signals appeared on both the A2+ algo (arrows) and A1 algo (dots). 

3/11 Trend Precognition signals won't print until the D close, but confluence between the A1 and A2+ algos increases the probability of accuracy. The fact that the short signals also have confluence with technical resistance at the 100 DMA increases probability that #ETH is toppy 

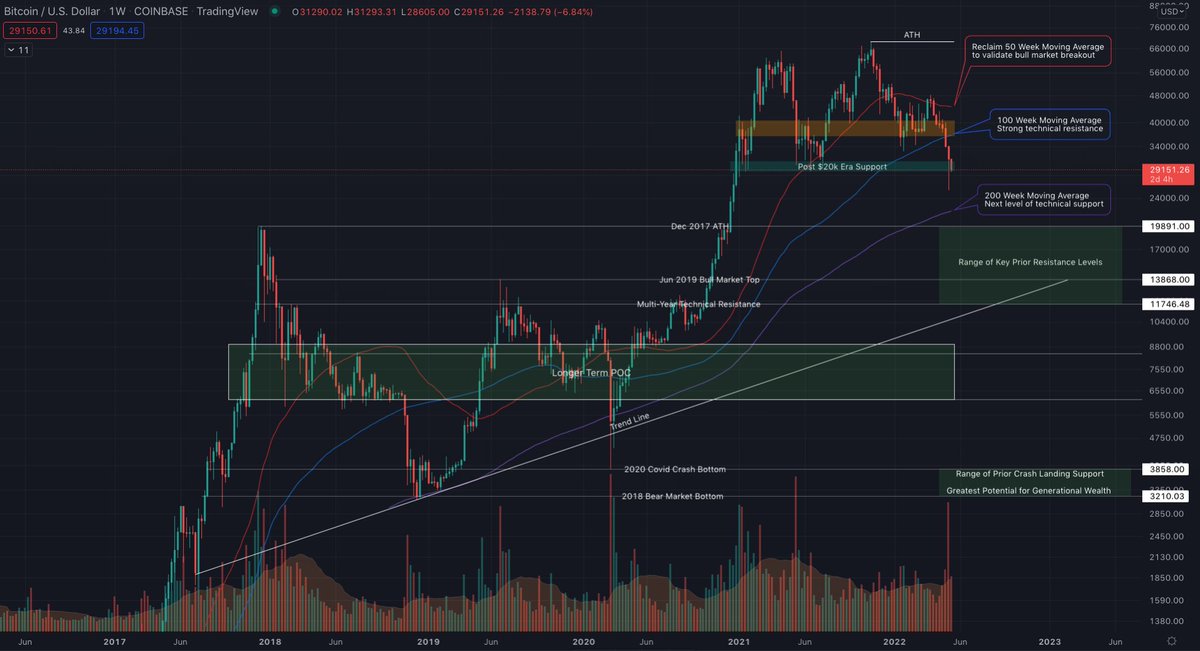
1/ Bear markets are notorious for brutal fakeouts, which is why it's critical to identify targets and invalidations.
Here are key levels to watch in both directions.📉📈
#BTC analysis 🧵
#NFA
More from Material Indicators here... mi1.pw/mitwmay
Here are key levels to watch in both directions.📉📈
#BTC analysis 🧵
#NFA
More from Material Indicators here... mi1.pw/mitwmay

2/In bear markets everyone is looking for a relief rally to exit or add short. Those are good strategies if you can tell the difference between a fakeout and a breakout. #FOMO + failure to identify invalidation levels are why so many people get rekt. #BullTrap #ShortSqueeze
3/ Identifying targets is easy. Determining breakout or fakeout is more challenging, and while there are no sure things, there are some things we can look at to help mitigate risk of getting trapped. To get some perspective, let's start with an ultra wide macro view of #BTC 


