Discover and read the best of Twitter Threads about #EnergyPriceguarantee
Most recents (3)
Today, in England, millions of voters make a choice in their #LocalElections2023. It’s a good time to share some new research that is related to two policy issues that will have touched many people over the last year: the #energycrisis & #crime.
📰 buff.ly/3Vys0w7
🧵⬇️
📰 buff.ly/3Vys0w7
🧵⬇️

In a nutshell, the paper shows that much of the widely reported surge in burglaries & anti-social behaviour could have been avoided, had the government provided more targeted energy price subsidies or had UK invested more in making homes more energy efficient. Last summer, ... 


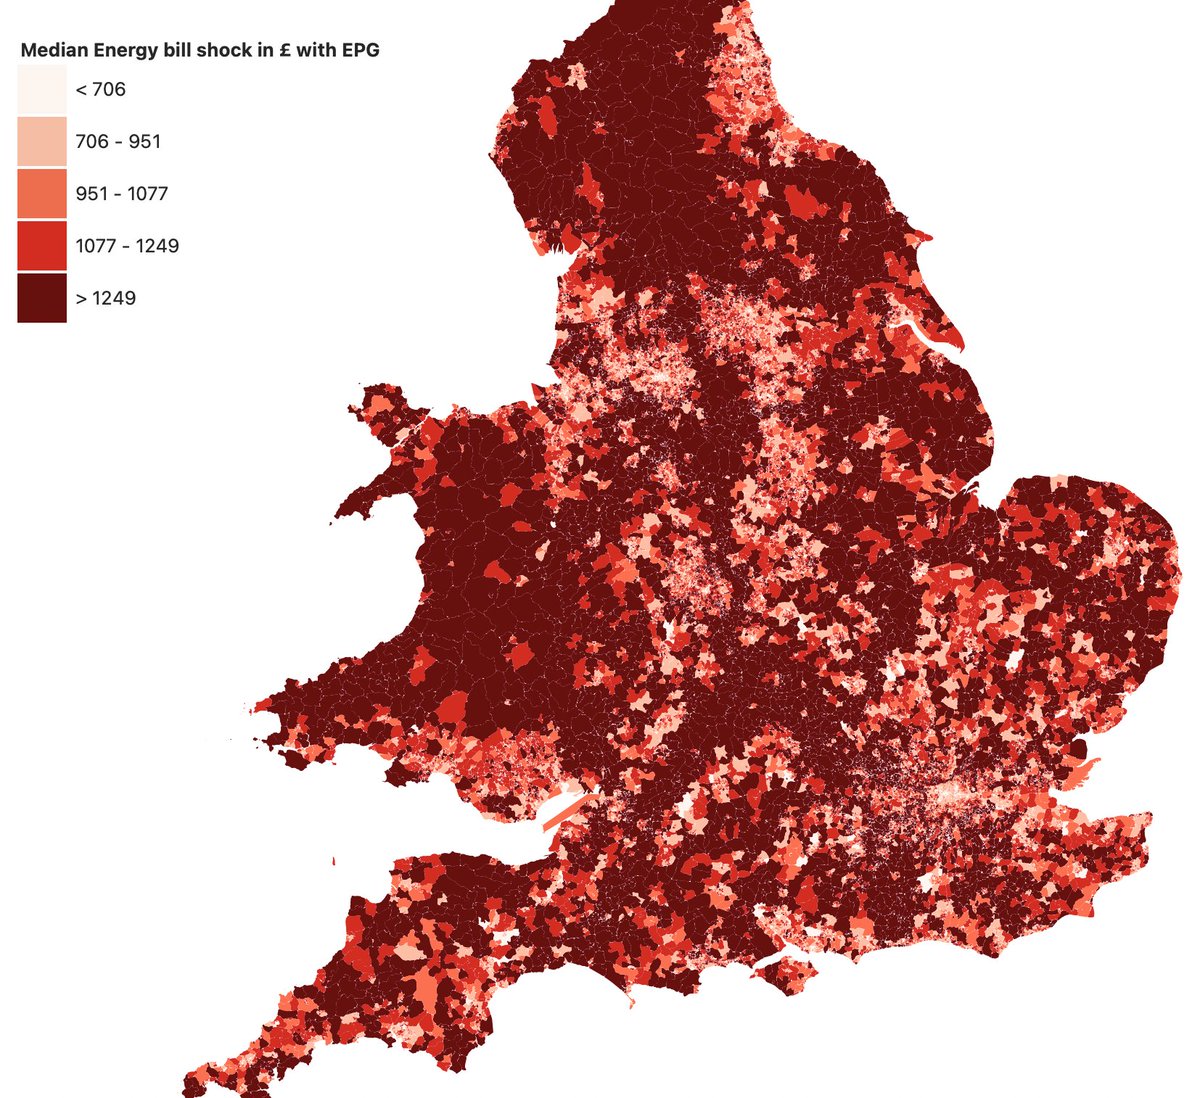
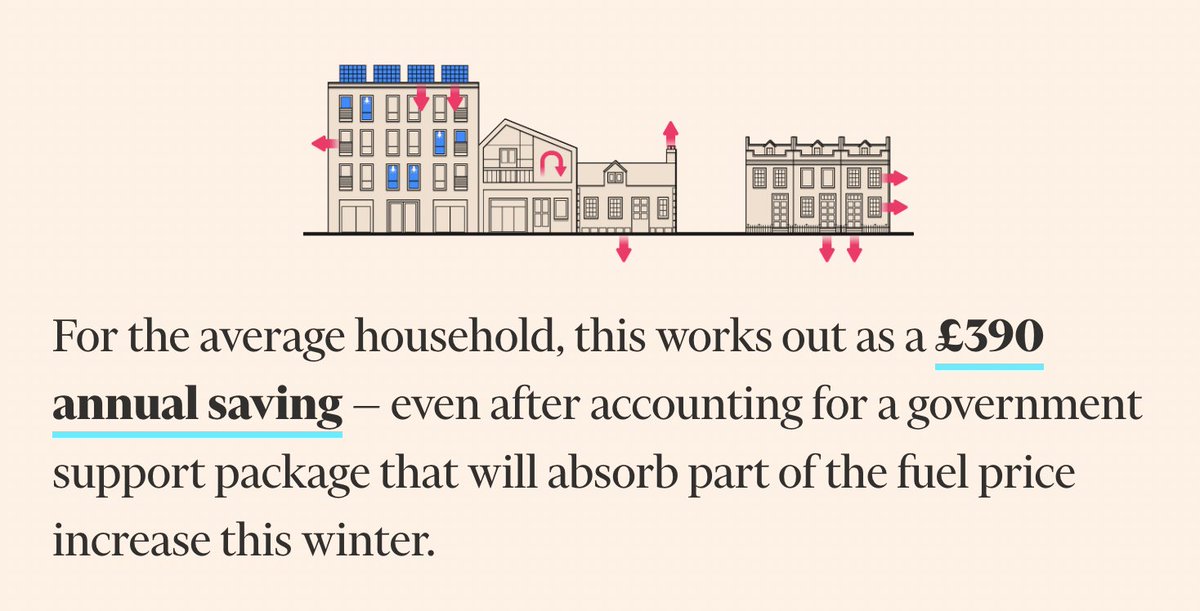
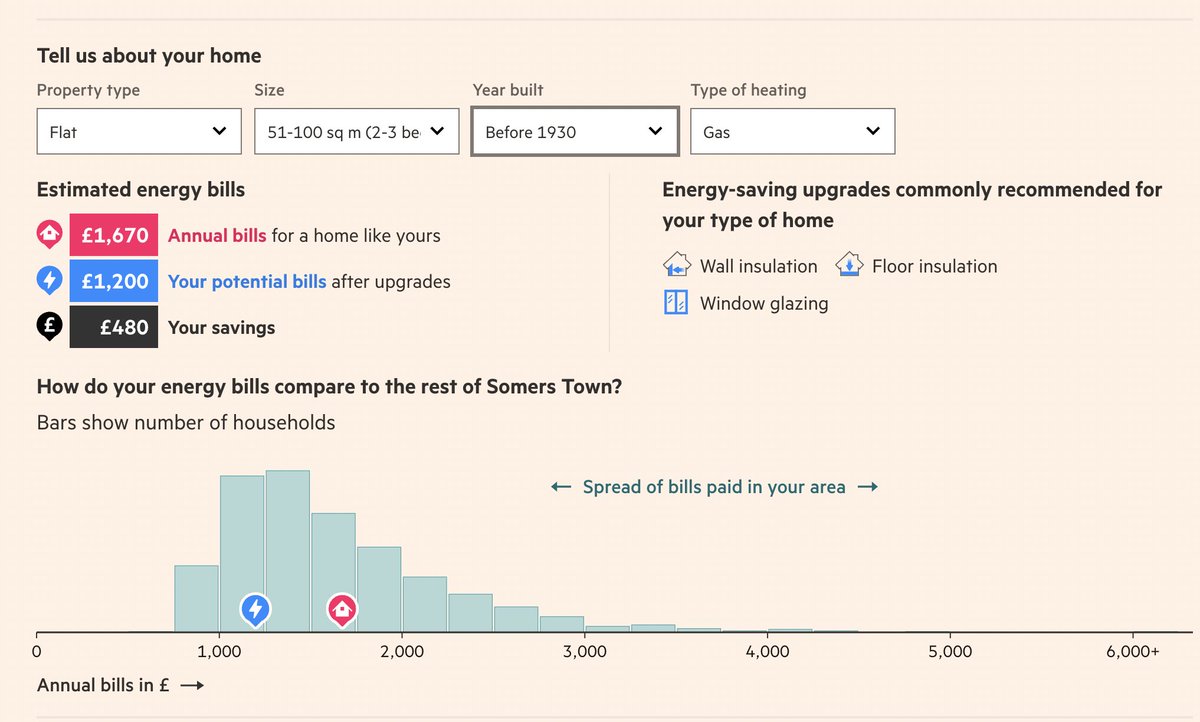
I modelled the impact of the energy price shock down to the property level for millions of homes. More #energyinefficient homes would see a bigger increase. Part of this work was reported in @FT as an interactive story ig.ft.com/uk-energy-effi…. This set up a framework to study... 

After 5 months of intense work the @FT published this piece that involved a ton of hands-on work. Check it out ➡️ ig.ft.com/uk-energy-effi…. It looks sleek but I do want to raise a few further points that I think could be discussed differently
#EnergyCrisis #EnergyBills #energy


#EnergyCrisis #EnergyBills #energy


Point 1: We provided bill estimates under multiple price scenarios. Treating the #EnergyPriceGuarantee as the "price" I find problematic. The EPG implies a #EnergySubsidy benefitting mostly the well off that we all need to fund through #austerity and/or higher #taxation. So this
does not represent the full economic cost. It also ignores carbon prices which we all need should be MUCH higher. Using estimates based on the Oct 2022 Ofgem price cap ~ £3500 per year which is inline with predictions for most of 2023 (see forecasts from @CornwallInsight). 

So, @Jeremy_Hunt now did a full and welcome u-turn on the #minibudget2022. And they are starting to tackle another policy that needs fixing, the #EnergyPriceguarantee #EPG. Why should this happen? This is a story that can ultimately be summarised in these two pictures.... 1/.. 


