Discover and read the best of Twitter Threads about #DiveIn
Most recents (5)
#DiveIn: Collapse in Term Premium TP
▪️ TP negative again after being positive for most of 2021
▪️ Excess yield investors require/receive to commit to holding L/T bond instead of series of S/T bonds has turned negative
▪️ Investors now willing to pay extra to hold L/T bonds
1/10
▪️ TP negative again after being positive for most of 2021
▪️ Excess yield investors require/receive to commit to holding L/T bond instead of series of S/T bonds has turned negative
▪️ Investors now willing to pay extra to hold L/T bonds
1/10

#China Credit Tightening?
▪️ Aggregate Financing AFRE or Total Social Financing TSF growth slowed to 11% yoy May v/s 11.7% Apr
▪️ Renminbi RMB Loan growth inched down to 12.2% yoy May v/s 12.3% Apr
▪️ Optically Broad Credit YoY charts look scarier than they actually are
1/9

▪️ Aggregate Financing AFRE or Total Social Financing TSF growth slowed to 11% yoy May v/s 11.7% Apr
▪️ Renminbi RMB Loan growth inched down to 12.2% yoy May v/s 12.3% Apr
▪️ Optically Broad Credit YoY charts look scarier than they actually are
1/9


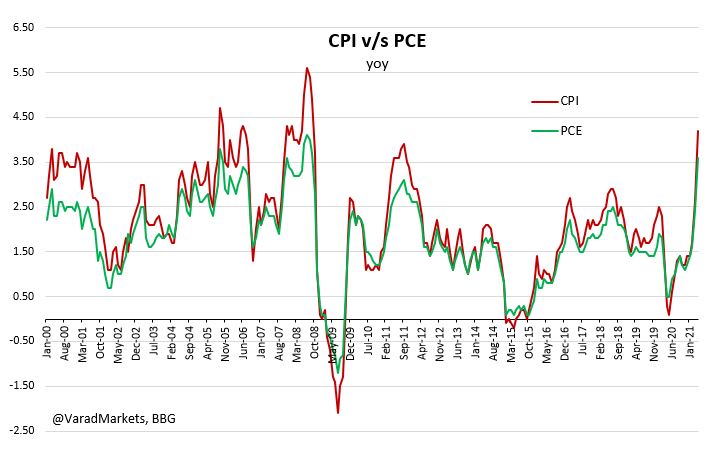
US #Inflation #DiveIn: CPI v/s PCE
Also why FED follows PCE?
▪️ Attached Summary of differences
▪️ Since 2000, overall CPI ~11% higher than PCE
▪️ Definition:
🔹 CPI: Out-of-pocket spending by non-institutional Urban Consumers
🔹 PCE: Includes Rural & all personal sector
1/12

Also why FED follows PCE?
▪️ Attached Summary of differences
▪️ Since 2000, overall CPI ~11% higher than PCE
▪️ Definition:
🔹 CPI: Out-of-pocket spending by non-institutional Urban Consumers
🔹 PCE: Includes Rural & all personal sector
1/12


Four Sources of differences: Scope, Formula, Weight, Others Effects
1⃣ Scope Effect:
🔹 CPI: Consumer Price Index => Survey of Households
🔹 PCE: Personal Consumption Expenditure => Survey of Businesses
▪️ 25% of PCE spending not captured by CPI
2/12
1⃣ Scope Effect:
🔹 CPI: Consumer Price Index => Survey of Households
🔹 PCE: Personal Consumption Expenditure => Survey of Businesses
▪️ 25% of PCE spending not captured by CPI
2/12

▪️ PCE includes spending by Govt, Firms, Non-Profits on behalf of Households
- E.G: Medical spending = Direct purchases by Consumers + Spending on medical goods & services by Medicare OR Employer's Health Insurance
- E.G: Public school education not an out-of-pocket spending
3/12
- E.G: Medical spending = Direct purchases by Consumers + Spending on medical goods & services by Medicare OR Employer's Health Insurance
- E.G: Public school education not an out-of-pocket spending
3/12
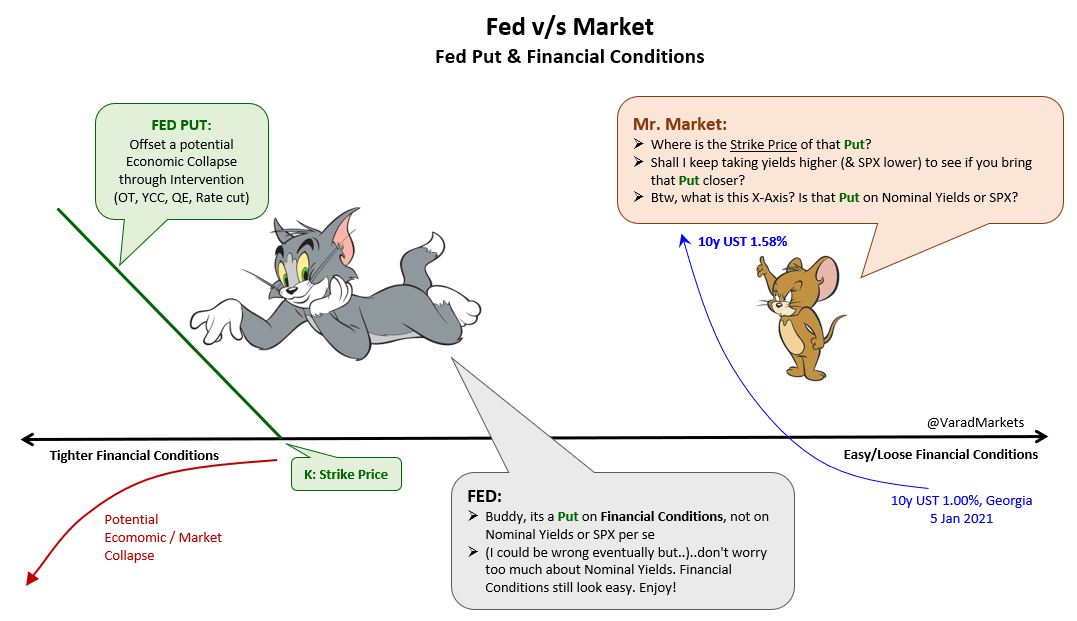
#Fed Put & Financial Conditions Index (#FCI):
#Powell: “…would be concerned by…persistent tightening in financial conditions…”
🚩Just-for-fun graphic: Fed Put - Market’s search for Put’s Strike Price = Fed’s intervention threshold
🚩#DiveIn: FCI & Macro
1/12
#Powell: “…would be concerned by…persistent tightening in financial conditions…”
🚩Just-for-fun graphic: Fed Put - Market’s search for Put’s Strike Price = Fed’s intervention threshold
🚩#DiveIn: FCI & Macro
1/12

#DiveIn: #Inflation Breakevens (BE)
Given immense focus on fiscal, monetary & inflation dynamics, quick brush up on Inflation BE:
BE = Nominal Rate, N (US Treasury Yield) – Real Rate, R (US Treasury Inflation Protected Securities, #TIPS Yields, T)
1/8

Given immense focus on fiscal, monetary & inflation dynamics, quick brush up on Inflation BE:
BE = Nominal Rate, N (US Treasury Yield) – Real Rate, R (US Treasury Inflation Protected Securities, #TIPS Yields, T)
1/8

BE = inflation level that makes investor indifferent b/w buying UST or TIPS
= (approx) market-based measure of risk neutral inflation expectations
= TIPS indexed to non-seasonally adjusted #CPI
10y BE = (10y Nominal Treasury yld) - (10y TIPS yld) = 1.16% - (-1.04%) = +2.20%
2/8
= (approx) market-based measure of risk neutral inflation expectations
= TIPS indexed to non-seasonally adjusted #CPI
10y BE = (10y Nominal Treasury yld) - (10y TIPS yld) = 1.16% - (-1.04%) = +2.20%
2/8


