Discover and read the best of Twitter Threads about #Covid19uk
Most recents (24)
travellingtabby.com/uk-coronavirus…
This week, the UK has reported:
🔵 8,858 new cases (down 20%)
🔴 367 new deaths (down 31%)
🟡 4,201 hospital inpatients (down 14%)
🟠 95 ICU/Ventilation inpatients (down 10%)
#Covid19UK #coronavirusuk


This week, the UK has reported:
🔵 8,858 new cases (down 20%)
🔴 367 new deaths (down 31%)
🟡 4,201 hospital inpatients (down 14%)
🟠 95 ICU/Ventilation inpatients (down 10%)
#Covid19UK #coronavirusuk


WATCH THIS NOW!
@stefsimanowitz
@StillDelvingH
@2019_winston
@eyes_lilly
@DoubleDownNews
@RussellEngland
@WriterJackWhite
@Aw_what
@mattprescott
@Tentoads4truth
@fascinatorfun
@HenryKangaroo
@RaveCozensHardy
@NarcAware
@PhilShields66
@stefsimanowitz
@StillDelvingH
@2019_winston
@eyes_lilly
@DoubleDownNews
@RussellEngland
@WriterJackWhite
@Aw_what
@mattprescott
@Tentoads4truth
@fascinatorfun
@HenryKangaroo
@RaveCozensHardy
@NarcAware
@PhilShields66
@dgurdasani1 @fascinatorfun @chrischirp @DrEricDing @DmodosCutter @sallyrussell124 @Sandyboots2020 @OrganCadenza @gailyloulabell @LeahBra_numbers @AprilMay001 @LongCovidKids @SafeEdForAll_UK @amrit_lohia @TigressEllie @ShieldUs1 @hivetosurvive #COVID #Covid19UK #Covid_19
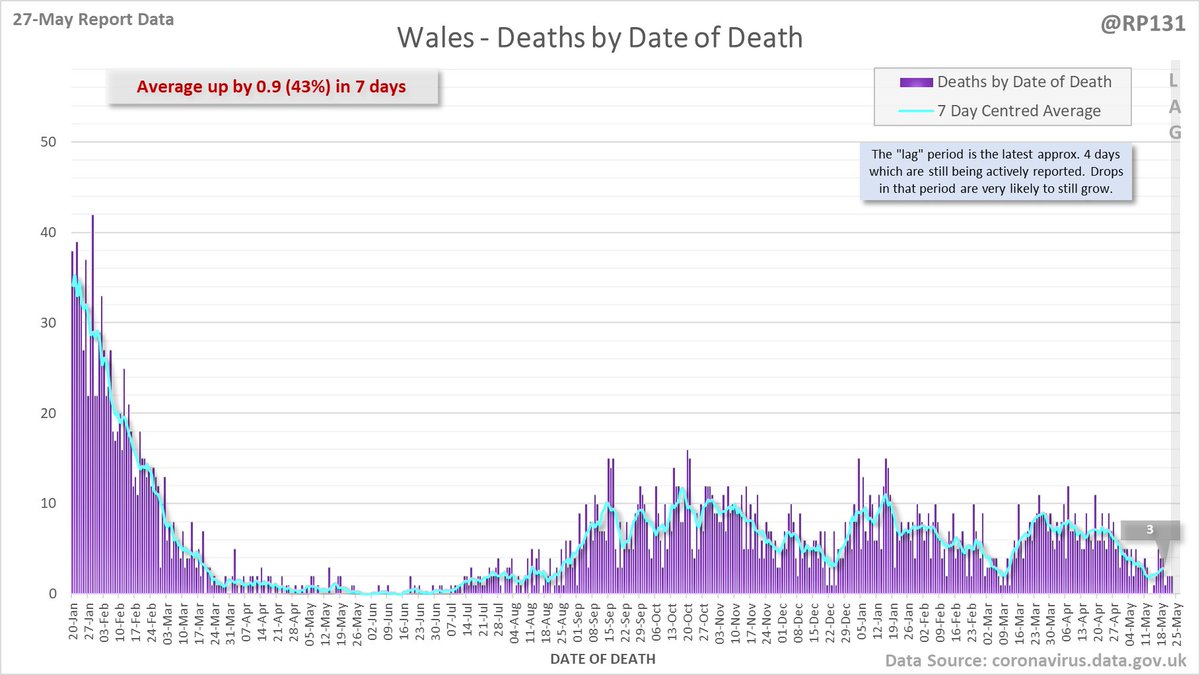
61 new #covid19uk deaths reported today (27-May). This brings the rolling average by date of death (allowing 4 days for lag) to 70, equivalent to around 21-Jul (i.e. 303 days ago), a reduction of 34 (33%) in the last week. 

4,661 new #covid19uk positive tests reported today (27-May).
Overall England is DOWN 22% on previous Friday and day-1 lateral flow positives are also down by 19%.
England's rolling average by specimen date has now been dropping since the 21st of March (67 days ago).
Overall England is DOWN 22% on previous Friday and day-1 lateral flow positives are also down by 19%.
England's rolling average by specimen date has now been dropping since the 21st of March (67 days ago).

Chart to show England positive tests (as of 27-May) by breakdown of first infection events and possible reinfection events.
Possible reinfections were added to the data from 31-Jan and the rolling average vs. total tests is currently about 17%.
Possible reinfections were added to the data from 31-Jan and the rolling average vs. total tests is currently about 17%.

Longer term view. 4,661 new #covid19uk positive tests reported today (27-May). This brings the rolling average by specimen date (allowing 4 days for lag) to 6,958, equivalent to around 08-Jun (i.e. 346 days ago), a reduction of 1268 (15%) in the last week. 

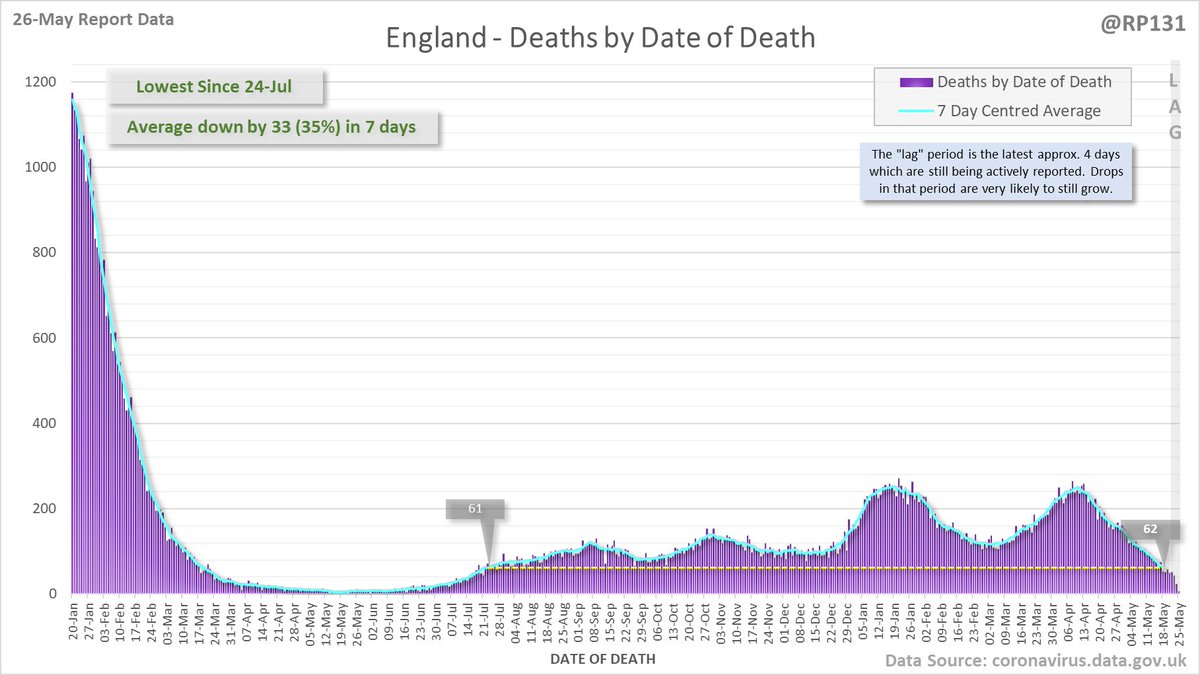
91 new #covid19uk deaths reported today (26-May). This brings the rolling average by date of death (allowing 4 days for lag) to 71, equivalent to around 24-Jul (i.e. 299 days ago), a reduction of 35 (33%) in the last week. 

8,369 new #covid19uk positive tests reported today (26-May).
Overall England is DOWN 21% on previous Thursday and day-1 lateral flow positives are also down by 16%.
England's rolling average by specimen date has now been dropping since the 21st of March (66 days ago).
Overall England is DOWN 21% on previous Thursday and day-1 lateral flow positives are also down by 16%.
England's rolling average by specimen date has now been dropping since the 21st of March (66 days ago).

Chart to show England positive tests (as of 26-May) by breakdown of first infection events and possible reinfection events.
Possible reinfections were added to the data from 31-Jan and the rolling average vs. total tests is currently about 17%.
Possible reinfections were added to the data from 31-Jan and the rolling average vs. total tests is currently about 17%.
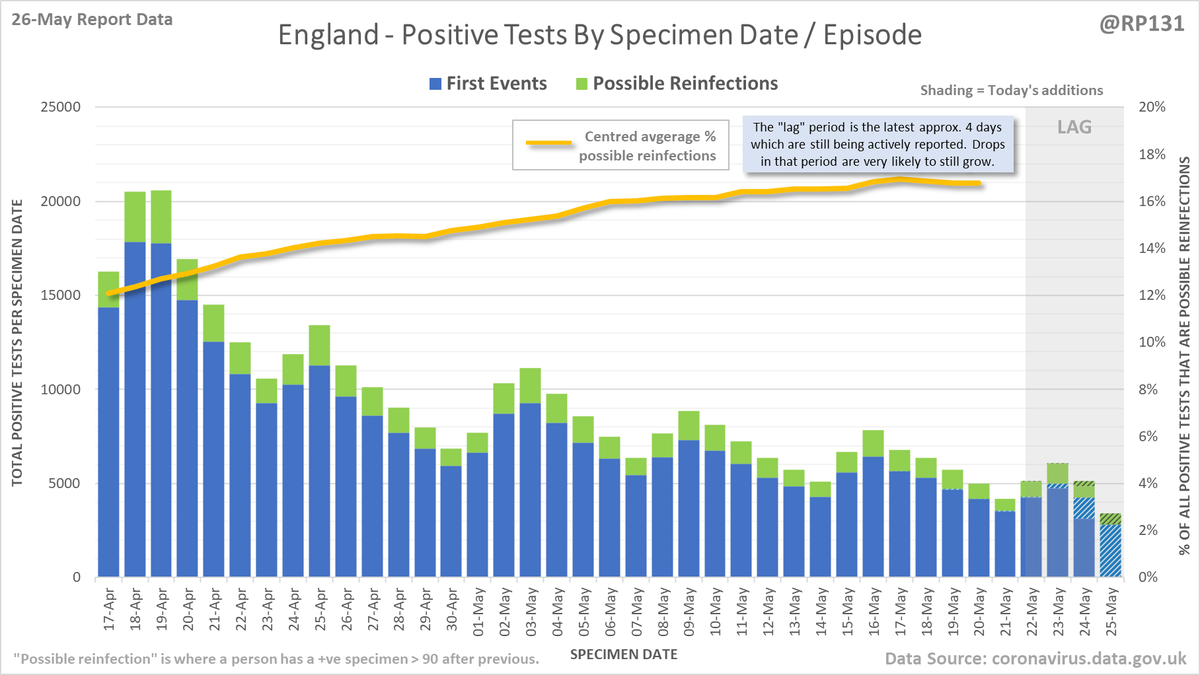
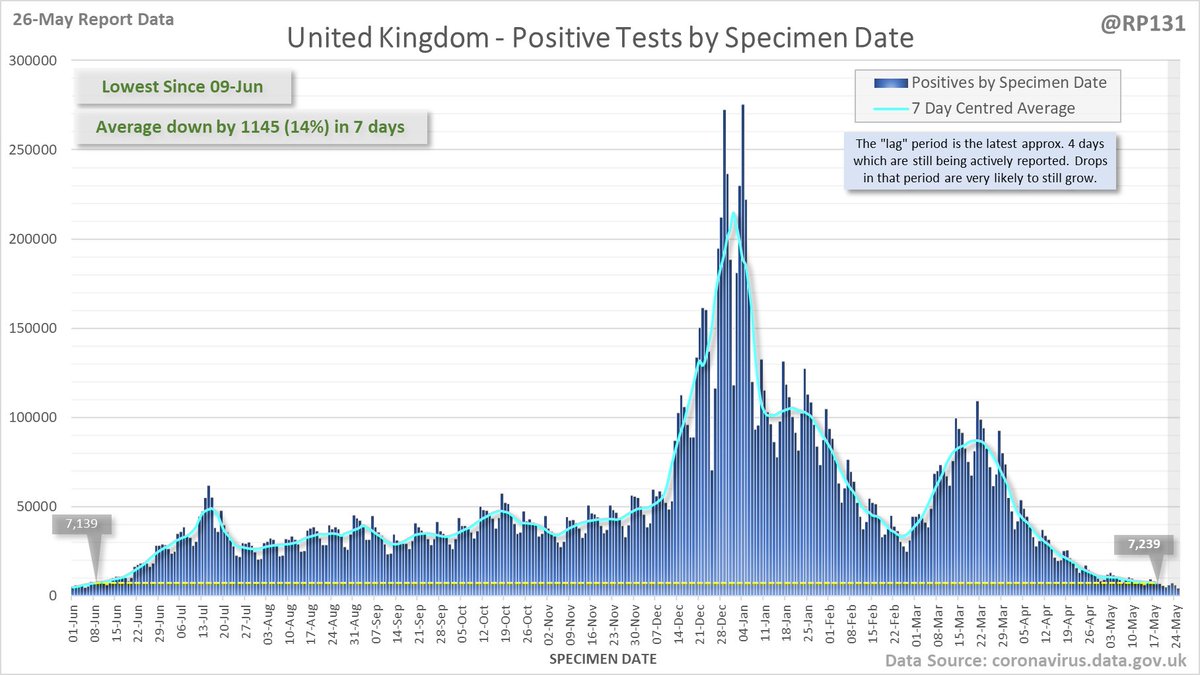
Longer term view. 8,369 new #covid19uk positive tests reported today (26-May). This brings the rolling average by specimen date (allowing 4 days for lag) to 7,239, equivalent to around 09-Jun (i.e. 344 days ago), a reduction of 1145 (14%) in the last week. 
travellingtabby.com/uk-coronavirus…
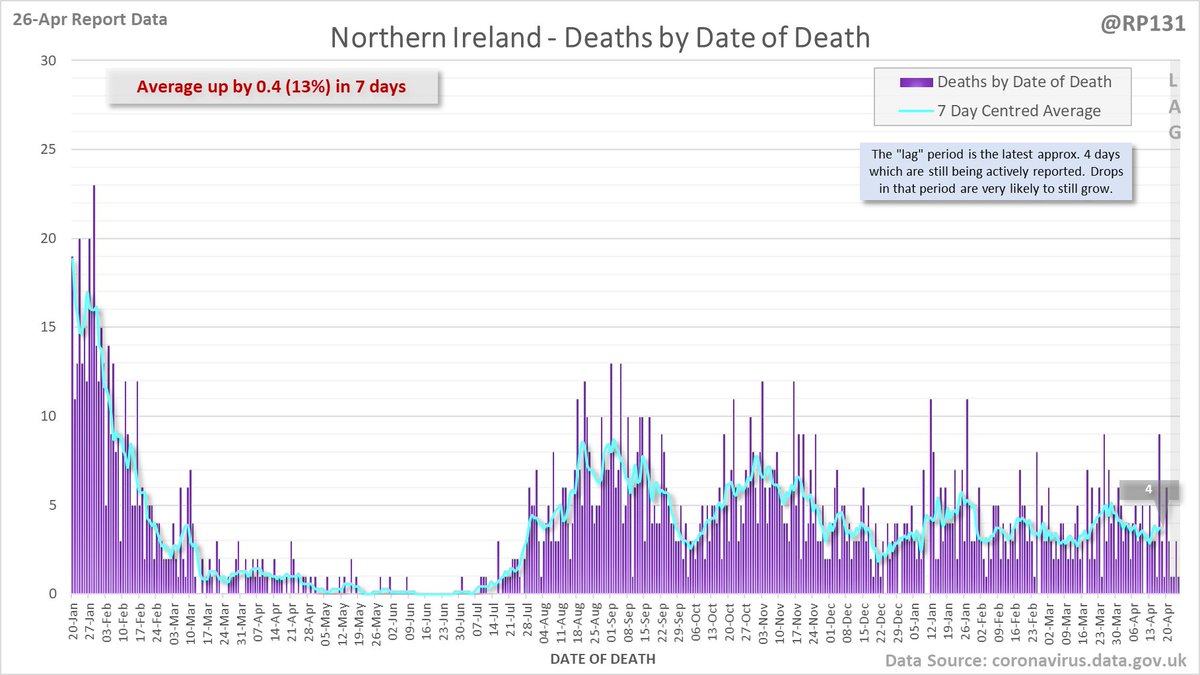
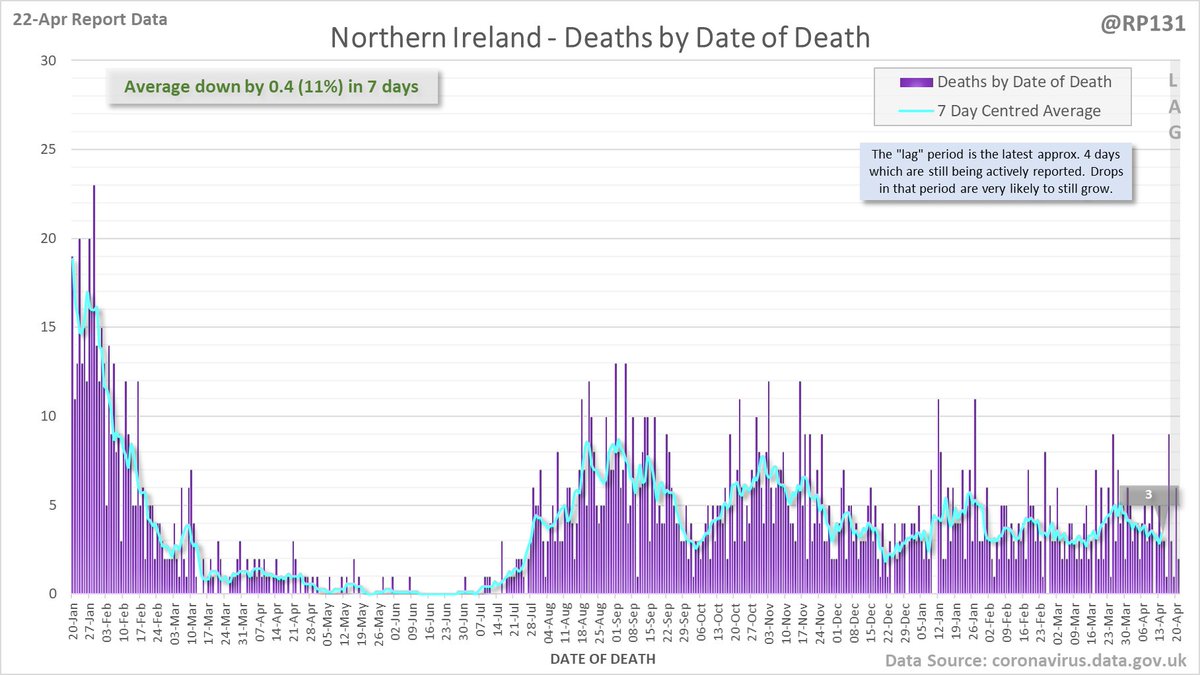
As of today, Northern Ireland will no longer be releasing any case or death data, so going forward those figures on the page will just be for England / Scotland / Wales.
#Covid19UK #coronavirusuk #DailyCovidUpdate


As of today, Northern Ireland will no longer be releasing any case or death data, so going forward those figures on the page will just be for England / Scotland / Wales.
#Covid19UK #coronavirusuk #DailyCovidUpdate

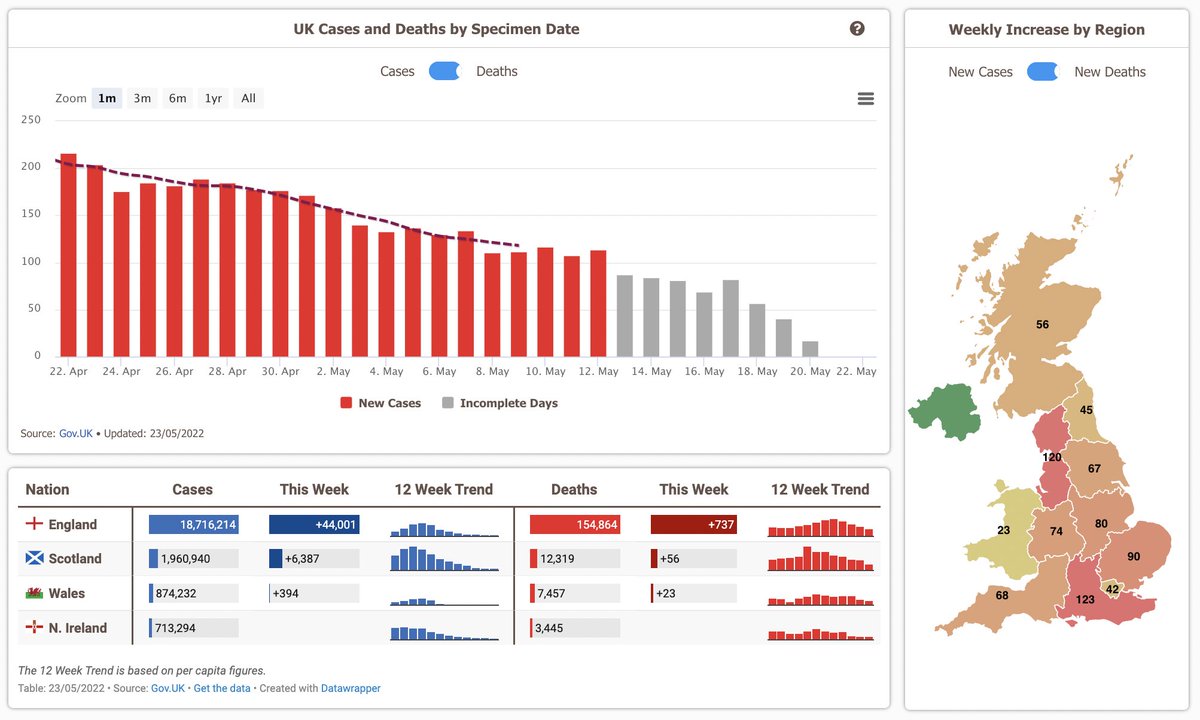
I believe the hospital data will still be getting released, but only once a week rather than daily.
And weekly death data should still be getting released by NISRA here: nisra.gov.uk/news/weekly-de…
And weekly death data should still be getting released by NISRA here: nisra.gov.uk/news/weekly-de…
And of course, the ONS Infection survey will still be running, giving an alternative for case figures in Northern Ireland.
The figures there will be more accurate, although not as timely, and not as useful at a local level
The figures there will be more accurate, although not as timely, and not as useful at a local level
travellingtabby.com/uk-coronavirus…
The estimated number of people in each nation who currently have Covid-19 is:
🏴 England: 1 in 35
🏴 Scotland: 1 in 30
🏴 Wales: 1 in 25
🍀 Northern Ireland: 1 in 40
#Covid19UK #coronavirusuk #DailyCovidUpdate


The estimated number of people in each nation who currently have Covid-19 is:
🏴 England: 1 in 35
🏴 Scotland: 1 in 30
🏴 Wales: 1 in 25
🍀 Northern Ireland: 1 in 40
#Covid19UK #coronavirusuk #DailyCovidUpdate


Also, all of the changes I mentioned for the Scotland page in my earlier update are also happening on the UK page, with the same timescales being used for the weekly figures
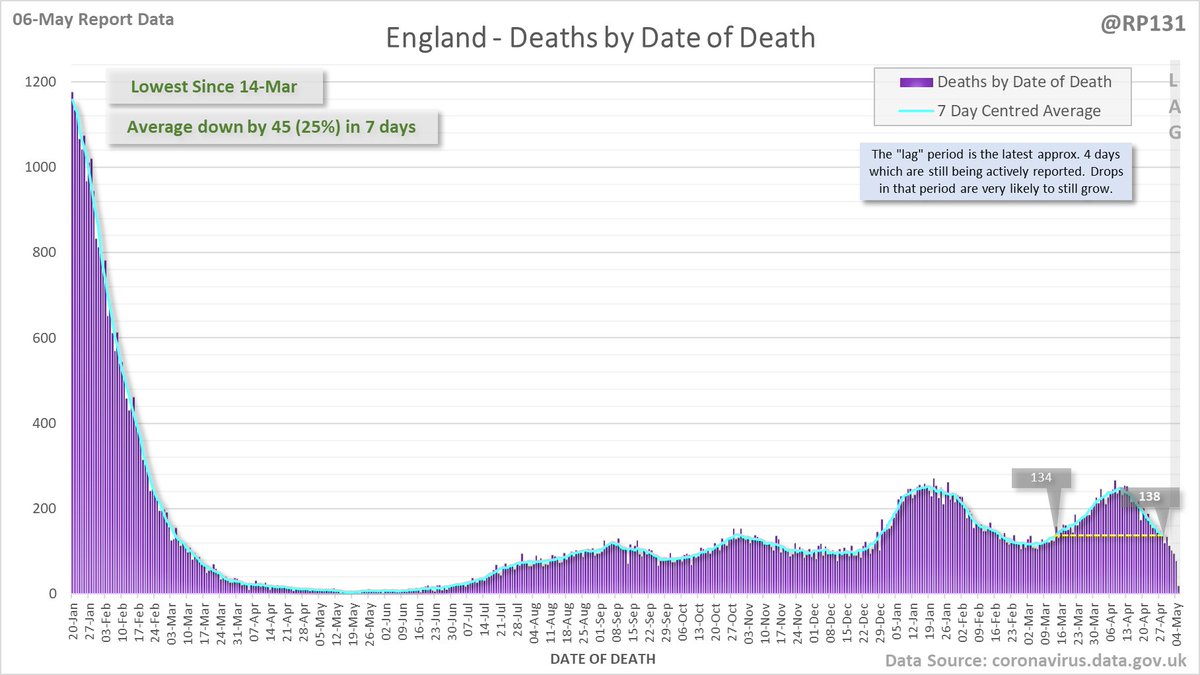
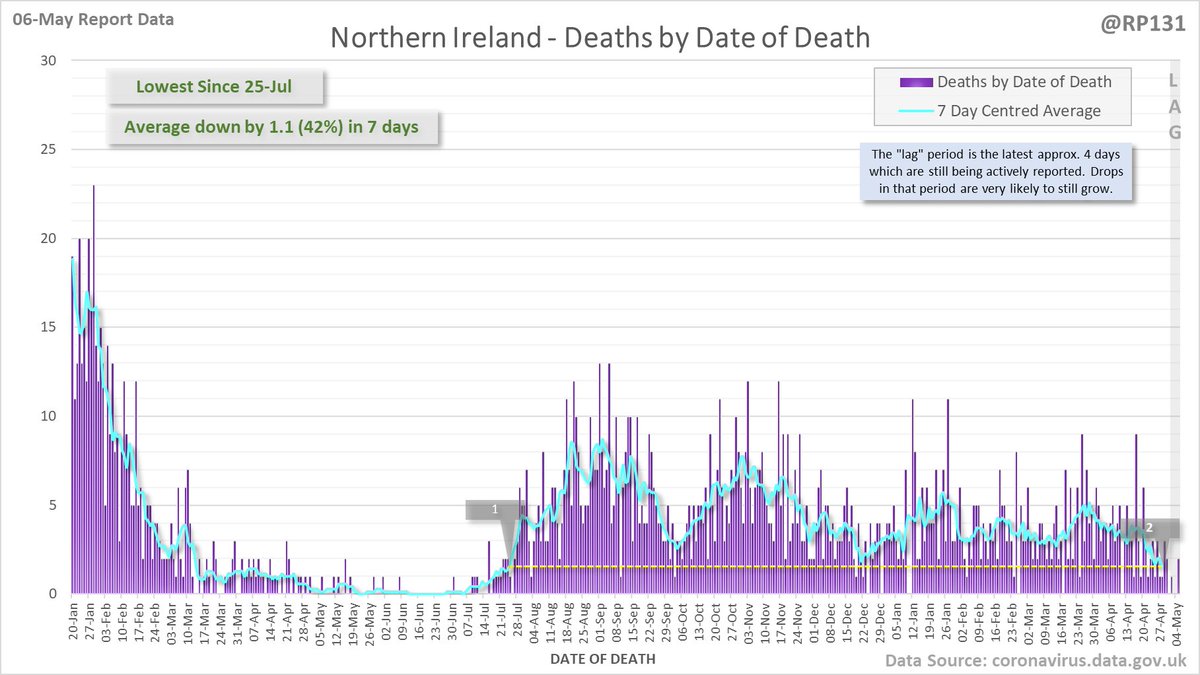
228 new #covid19uk deaths reported today (06-May). This brings the rolling average by date of death (allowing 4 days for lag) to 156, equivalent to around 13-Mar (i.e. 47 days ago), a reduction of 52 (25%) in the last week. 

11,076 new #covid19uk positive tests reported today (06-May).
Overall England is DOWN 3% on previous Friday although day-1 lateral flow positives are only down by 1%.
England's rolling average by specimen date has now been dropping since the 21st of March (46 days ago).
Overall England is DOWN 3% on previous Friday although day-1 lateral flow positives are only down by 1%.
England's rolling average by specimen date has now been dropping since the 21st of March (46 days ago).

Chart to show England positive tests (as of 06-May) by breakdown of first infection events and possible reinfection events.
Possible reinfections were added to the data from 31-Jan and the rolling average vs. total tests is currently about 15%.
Possible reinfections were added to the data from 31-Jan and the rolling average vs. total tests is currently about 15%.

Longer term view. 11,076 new #covid19uk positive tests reported today (06-May). This brings the rolling average by specimen date (allowing 4 days for lag) to 11,920, equivalent to around 19-Jun (i.e. 314 days ago), a reduction of 7274 (38%) in the last week. 

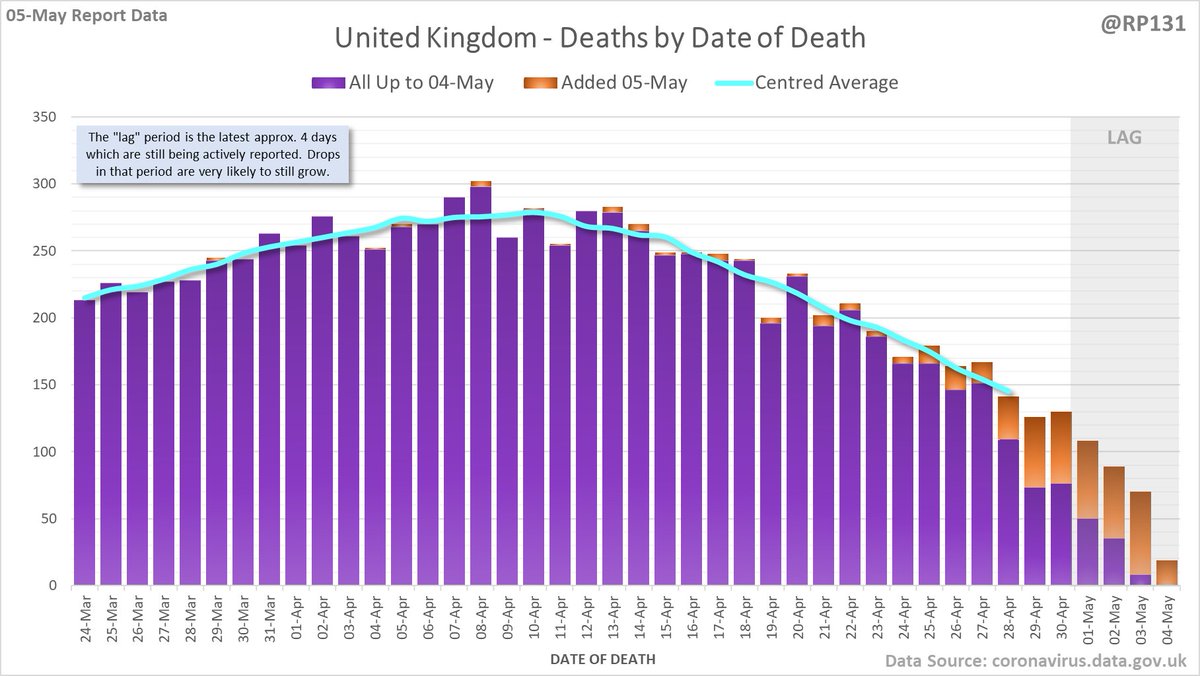
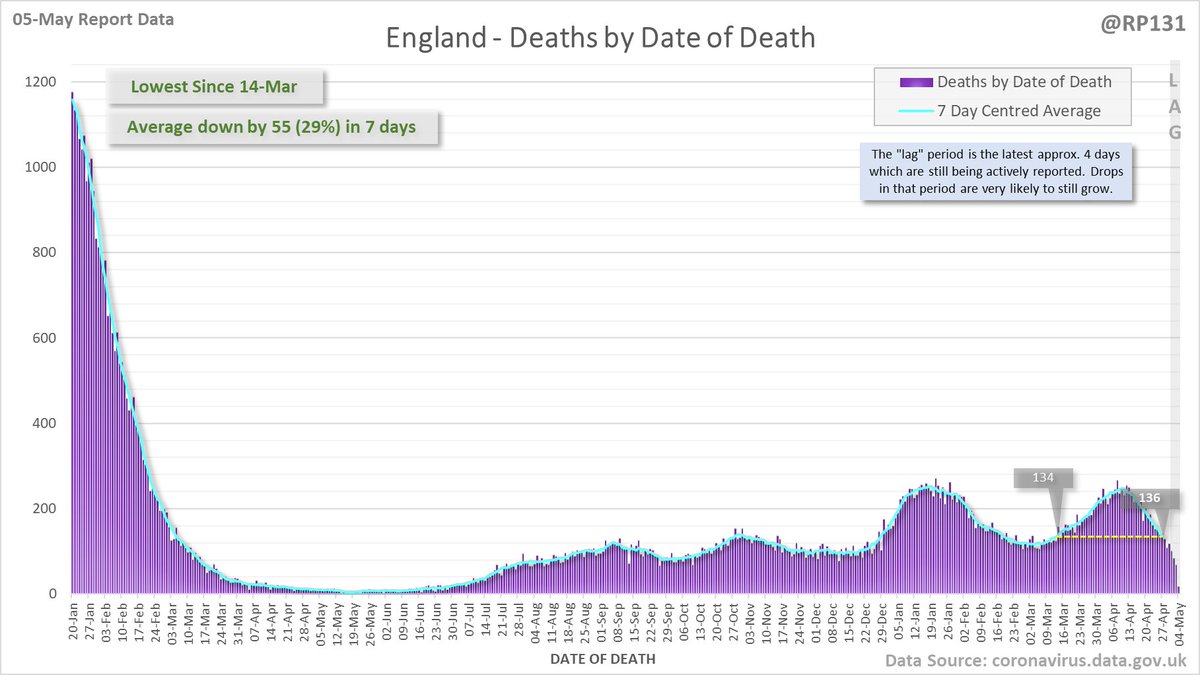
438 new #covid19uk deaths reported today (05-May). This brings the rolling average by date of death (allowing 4 days for lag) to 154, equivalent to around 12-Mar (i.e. 47 days ago), a reduction of 64 (29%) in the last week. 

12,487 new #covid19uk positive tests reported today (05-May).
Overall England is DOWN 6% on previous Thursday although day-1 lateral flow positives are only down by 2%.
England's rolling average by specimen date has now been dropping since the 21st of March (45 days ago).
Overall England is DOWN 6% on previous Thursday although day-1 lateral flow positives are only down by 2%.
England's rolling average by specimen date has now been dropping since the 21st of March (45 days ago).

Chart to show England positive tests (as of 05-May) by breakdown of first infection events and possible reinfection events.
Possible reinfections were added to the data from 31-Jan and the rolling average vs. total tests is currently about 15%.
Possible reinfections were added to the data from 31-Jan and the rolling average vs. total tests is currently about 15%.

Longer term view. 12,487 new #covid19uk positive tests reported today (05-May). This brings the rolling average by specimen date (allowing 4 days for lag) to 12,724, equivalent to around 20-Jun (i.e. 312 days ago), a reduction of 7240 (36%) in the last week. 

248 new #covid19uk deaths reported today (28-Apr). This brings the rolling average by date of death (allowing 4 days for lag) to 201, equivalent to around 20-Mar (i.e. 32 days ago), a reduction of 60 (23%) in the last week. 

14,030 new #covid19uk positive tests reported today (28-Apr).
Overall England is DOWN 41% on previous Wednesday and day-1 lateral flow positives are also down by 41%.
England has now been showing consistent week-on-week drops since the 25th of March (34 days ago).
Overall England is DOWN 41% on previous Wednesday and day-1 lateral flow positives are also down by 41%.
England has now been showing consistent week-on-week drops since the 25th of March (34 days ago).

Chart to show England positive tests (as of 28-Apr) by breakdown of first infection events and possible reinfection events.
Possible reinfections were added to the data from 31-Jan and the rolling average vs. total tests is currently about 14%.
Possible reinfections were added to the data from 31-Jan and the rolling average vs. total tests is currently about 14%.

Longer term view. 14,030 new #covid19uk positive tests reported today (28-Apr). This brings the rolling average by specimen date (allowing 4 days for lag) to 19,922, equivalent to around 26-Jun (i.e. 299 days ago), a reduction of 8860 (31%) in the last week. 

304 new #covid19uk deaths reported today (27-Apr). This brings the rolling average by date of death (allowing 4 days for lag) to 205, equivalent to around 21-Mar (i.e. 30 days ago), a reduction of 56 (21%) in the last week. 

17,224 new #covid19uk positive tests reported today (27-Apr).
Overall England is DOWN 35% on previous Wednesday and day-1 lateral flow positives are also down by 47%.
England has now been showing consistent week-on-week drops since the 25th of March (33 days ago).
Overall England is DOWN 35% on previous Wednesday and day-1 lateral flow positives are also down by 47%.
England has now been showing consistent week-on-week drops since the 25th of March (33 days ago).

Chart to show England positive tests (as of 27-Apr) by breakdown of first infection events and possible reinfection events.
Possible reinfections were added to the data from 31-Jan and the rolling average vs. total tests is currently about 13%.
Possible reinfections were added to the data from 31-Jan and the rolling average vs. total tests is currently about 13%.

Longer term view. 17,224 new #covid19uk positive tests reported today (27-Apr). This brings the rolling average by specimen date (allowing 4 days for lag) to 20,872, equivalent to around 26-Jun (i.e. 298 days ago), a reduction of 9043 (30%) in the last week. 

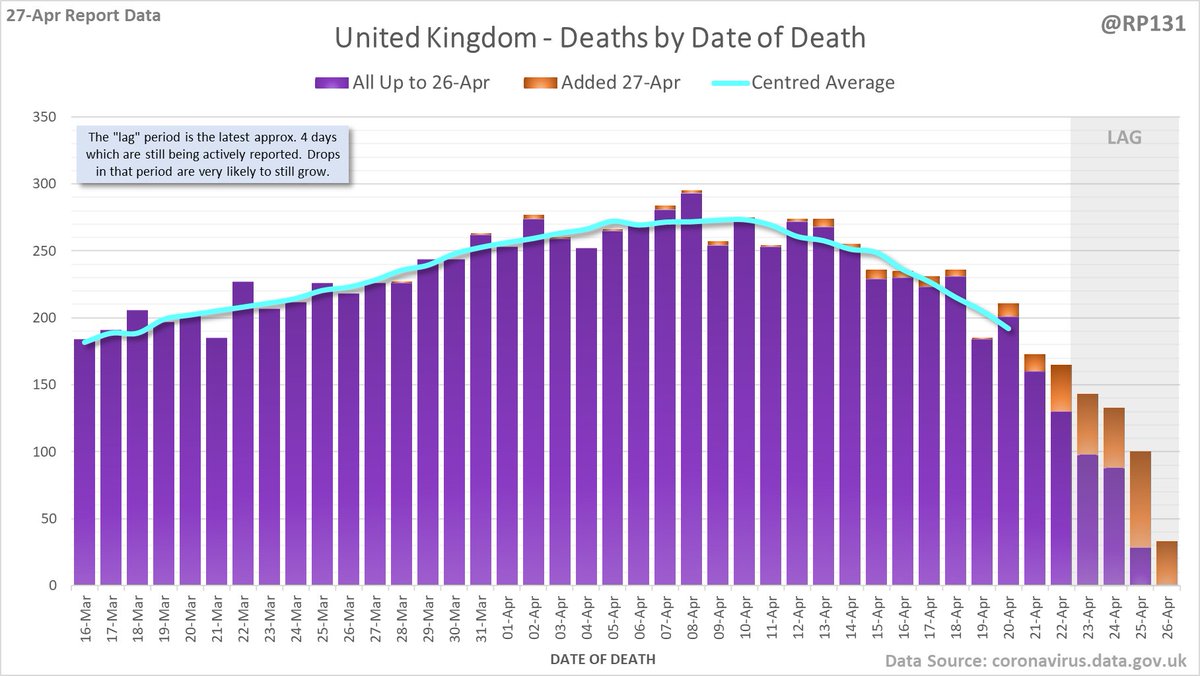
451 new #covid19uk deaths reported today (26-Apr). This brings the rolling average by date of death (allowing 4 days for lag) to 208, equivalent to around 23-Mar (i.e. 27 days ago), a reduction of 58 (22%) in the last week. 

16,579 new #covid19uk positive tests reported today (26-Apr).
UKHSA "case" data is broken today and only nation level data is available. Posts will be quite limited today!
UKHSA "case" data is broken today and only nation level data is available. Posts will be quite limited today!

284 new #covid19uk deaths reported today (22-Apr). This brings the rolling average by date of death (allowing 4 days for lag) to 228, equivalent to around 28-Mar (i.e. 18 days ago), a reduction of 39 (15%) in the last week. 

19,795 new #covid19uk positive tests reported today (22-Apr).
Week-on-week comparisons won't work again until Tuesday now due to bank holiday weekend. Rolling average continues to drop.
Week-on-week comparisons won't work again until Tuesday now due to bank holiday weekend. Rolling average continues to drop.

Chart to show England positive tests (as of 22-Apr) by breakdown of first infection events and possible reinfection events.
Possible reinfections were added to the data from 31-Jan and the rolling average vs. total tests is currently about 12%.
Possible reinfections were added to the data from 31-Jan and the rolling average vs. total tests is currently about 12%.

Longer term view. 19,795 new #covid19uk positive tests reported today (22-Apr). This brings the rolling average by specimen date (allowing 4 days for lag) to 27,201, equivalent to around 02-Aug (i.e. 256 days ago), a reduction of 12439 (31%) in the last week. 

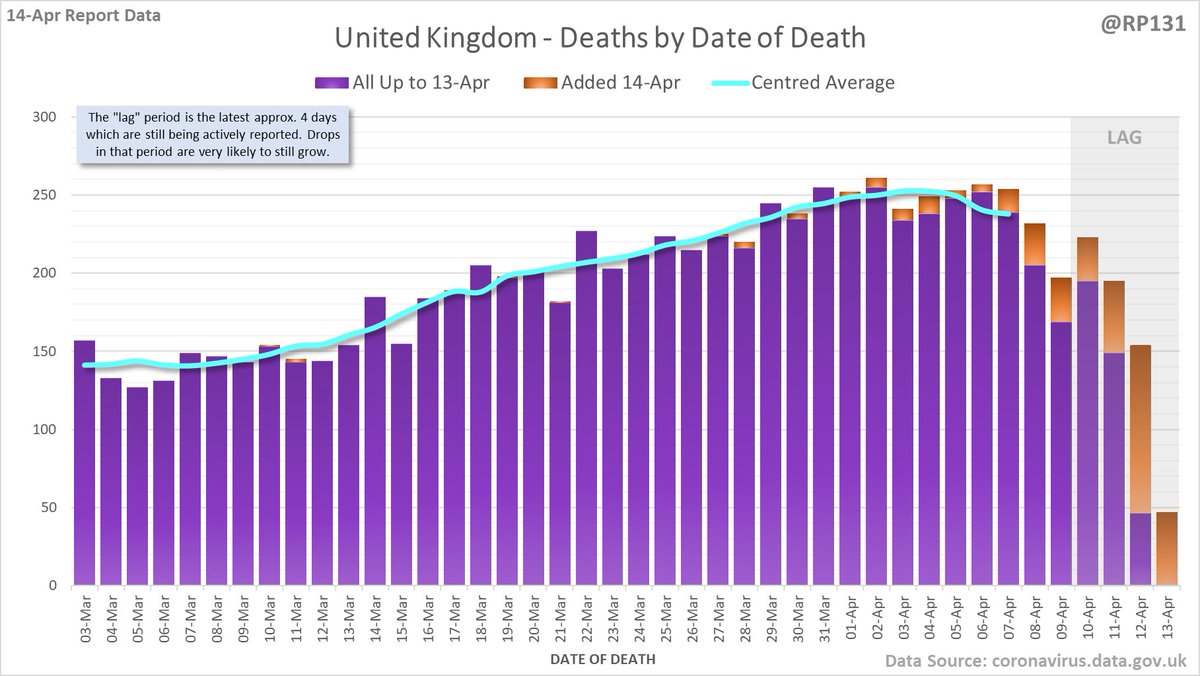
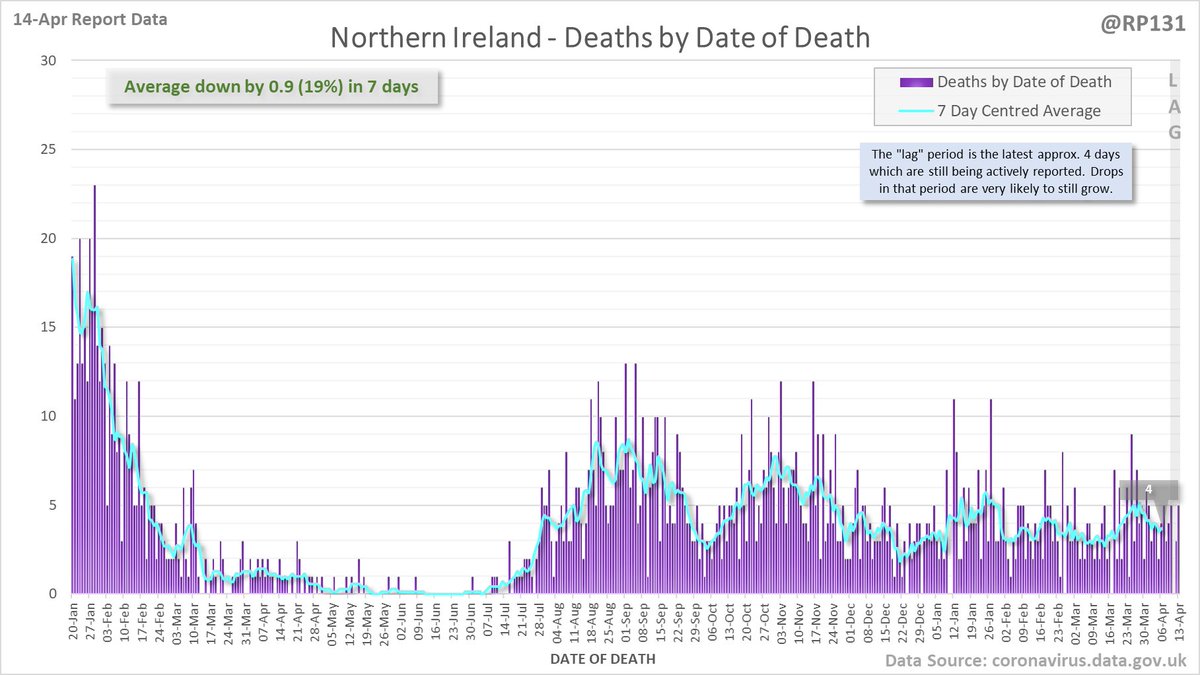
350 new #covid19uk deaths reported today (14-Apr). This brings the rolling average by date of death (allowing 4 days for lag) to 240, equivalent to around 30-Mar (i.e. 8 days ago). 

350 new #covid19uk deaths reported today (14-Apr). This brings the rolling average by date of death (allowing 4 days for lag) to 240, equivalent to around 30-Mar (i.e. 8 days ago). 

32,608 new #covid19uk positive tests reported today (14-Apr).
Overall England is DOWN 29% on previous Thursday and day-1 lateral flow positives are also down by 31%.
This is now the 15th consecutive reporting day of week-on-week drops.
Overall England is DOWN 29% on previous Thursday and day-1 lateral flow positives are also down by 31%.
This is now the 15th consecutive reporting day of week-on-week drops.

Chart to show England positive tests (as of 14-Apr) by breakdown of first infection events and possible reinfection events.
Possible reinfections were added to the data from 31-Jan and the rolling average vs. total tests is currently about 11%.
Possible reinfections were added to the data from 31-Jan and the rolling average vs. total tests is currently about 11%.

Longer term view. 32,608 new #covid19uk positive tests reported today (14-Apr). This brings the rolling average by specimen date (allowing 4 days for lag) to 41,084, equivalent to around 02-Mar (i.e. 36 days ago), a reduction of 23775 (37%) in the last week. 


