Discover and read the best of Twitter Threads about #Covid19NSW
Most recents (24)
1/18 #CovidIsNotOver #COVID19nsw
So @AlboMP and @AustralianLabor want to keep kids in school because "it's better for them."
Let me tell you about about my kids current schooling, followed by a new local discovery about testing.
So @AlboMP and @AustralianLabor want to keep kids in school because "it's better for them."
Let me tell you about about my kids current schooling, followed by a new local discovery about testing.
2/ Most days my kids have a *minimum* of 1 "Quad".
A quad is a period of no learning where anywhere between 20-120 students (out of 450) sit outside in the quadrangle doing nothing. Some read, or play sport, most talk.
The reason for quads is so many teachers are out with Covid
A quad is a period of no learning where anywhere between 20-120 students (out of 450) sit outside in the quadrangle doing nothing. Some read, or play sport, most talk.
The reason for quads is so many teachers are out with Covid
(1/5) NSW COVID Weekly Data Overview - Week ending 22 April 2023
🔹31 (+3) COVID deaths
🔹12 deaths were aged care residents
🔹3 deaths occurred at home
🔹2 children under 9 years in ICU
🔹28 children under 9 years in hospital with COVID
Source: health.nsw.gov.au/Infectious/cov…


🔹31 (+3) COVID deaths
🔹12 deaths were aged care residents
🔹3 deaths occurred at home
🔹2 children under 9 years in ICU
🔹28 children under 9 years in hospital with COVID
Source: health.nsw.gov.au/Infectious/cov…


(2/5) Sadly, Of the 31 COVID deaths being reported today:
1 person in their 50s
4 people in their 60s
7 people in their 70s
11 people in their 80s
8 people were aged over 90
15 were women and 16 were men
#COVID19nsw
1 person in their 50s
4 people in their 60s
7 people in their 70s
11 people in their 80s
8 people were aged over 90
15 were women and 16 were men
#COVID19nsw
(3/5) NSW COVID-19 Whole Genome Sequencing - Week ending 22 April 2023
🔸XBB : 51.4%
🔸XBB.1.5 : 31.2%
🔸CH.1.1 : 7.2%
🔸Recombinant: 2.2%
🔸XBC: 2.2%
🔸XBF: 1.4%
🔸BQ.1: 1.4%
🔸BR.2: 1.4%
#COVID19nsw

🔸XBB : 51.4%
🔸XBB.1.5 : 31.2%
🔸CH.1.1 : 7.2%
🔸Recombinant: 2.2%
🔸XBC: 2.2%
🔸XBF: 1.4%
🔸BQ.1: 1.4%
🔸BR.2: 1.4%
#COVID19nsw


NSW Health has released their epi report for the week ending 14 Jan. As I've been away for a while, this thread covers the last six weeks or so.
#Covid19Aus #Covid19NSW
You can find the full report here...
health.nsw.gov.au/Infectious/cov…
#Covid19Aus #Covid19NSW
You can find the full report here...
health.nsw.gov.au/Infectious/cov…
Note that for the two weeks ending 31 Dec, NSW Health reported a lot of metrics for these two weeks combined. So I have needed to estimate the split between the two weeks in some places.
The NSW Health epi report for the week ending 3 December is now out.
A thread/
#Covid19Aus #Covid19NSW
You can find the full report here...
health.nsw.gov.au/Infectious/cov…
A thread/
#Covid19Aus #Covid19NSW
You can find the full report here...
health.nsw.gov.au/Infectious/cov…
The NSW Health epi report for the week ending 26 Nov is now out.
A thread, where I get cranky (again)/
#Covid19Aus #Covid19NSW
You can find the full report here...
health.nsw.gov.au/Infectious/cov…
A thread, where I get cranky (again)/
#Covid19Aus #Covid19NSW
You can find the full report here...
health.nsw.gov.au/Infectious/cov…
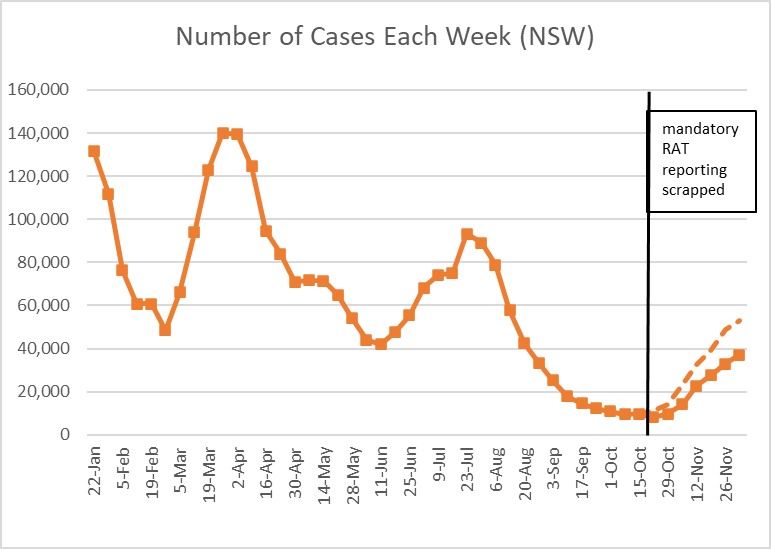
Cases up 19% in the week. As mandatory reporting of RATs was discontinued on 14 Oct, cases since then are not comparable to the earlier timeseries 

Here are cases split between PCR and RATs. A rough estimate is that if RATs were still mandatory, we'd be pushing around 50,000 cases this week (rather than 33,000). (@dbRaevn usually does a more accurate estimate, utilising the info by age band.) 

NSW Health have released their epi report for the week ending 12 November.
A thread/
#Covid19Aus #Covid19NSW
You can find the full report here...
health.nsw.gov.au/Infectious/cov…
A thread/
#Covid19Aus #Covid19NSW
You can find the full report here...
health.nsw.gov.au/Infectious/cov…
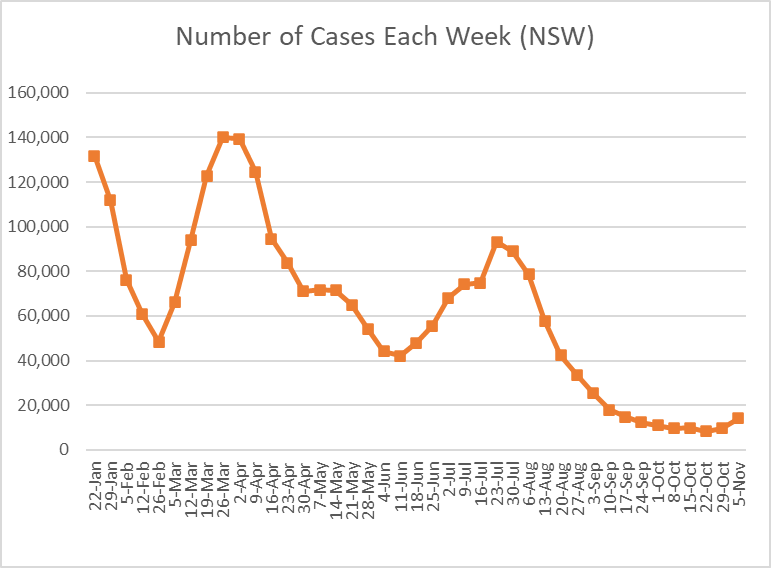
The NSW Health epi report for the week ending 5 November was released today.
I feel like I follow NSW reasonably closely, but there were a few surprises in here for me.
#Covid19Aus #Covid19NSW
You can find the full report here...
health.nsw.gov.au/Infectious/cov…
I feel like I follow NSW reasonably closely, but there were a few surprises in here for me.
#Covid19Aus #Covid19NSW
You can find the full report here...
health.nsw.gov.au/Infectious/cov…
The NSW Health epi report for the week ending 15 October is now out.
#COVID19Aus #COVID19NSW
You can find the full report here...
health.nsw.gov.au/Infectious/cov…
#COVID19Aus #COVID19NSW
You can find the full report here...
health.nsw.gov.au/Infectious/cov…
The NSW epi report for the week ending 10 Sept is now out. Note that this is the week ending just before they switched from daily to weekly reporting, so nothing new on that front.
#Covid19Aus #Covid19NSW
You can find the full report here...
health.nsw.gov.au/Infectious/cov…
#Covid19Aus #Covid19NSW
You can find the full report here...
health.nsw.gov.au/Infectious/cov…
The NSW Health weekly epi report for the week ending 27 August came out today.
Short thread this week/
#covid19Aus #covid19NSW
You can find the full report here...
health.nsw.gov.au/Infectious/cov…
Short thread this week/
#covid19Aus #covid19NSW
You can find the full report here...
health.nsw.gov.au/Infectious/cov…
Only a few highlights this week as trajectories haven't changed, and I'm a bit fried after the excess deaths stuff this week:
- cases are down 21% and all age groups moving similarly; good
- PCR testing is down, but positivity rate is also down; good
- cases are down 21% and all age groups moving similarly; good
- PCR testing is down, but positivity rate is also down; good
- hospital admissions down 15%; excellent. The biggest % fall we've seen in a long time
- people in hospital down 6%; good. Hopefully this % will be even bigger next week as the lower admissions flow through
- 126 deaths; never good. But the lowest number in the seven weeks
- people in hospital down 6%; good. Hopefully this % will be even bigger next week as the lower admissions flow through
- 126 deaths; never good. But the lowest number in the seven weeks
The NSW Health epi report for the week ending 20 Aug came out today, and it looks pretty similar to last week.
A thread/
#Covid19Aus #Covid19NSW
You can find the full report here...
health.nsw.gov.au/Infectious/cov…
A thread/
#Covid19Aus #Covid19NSW
You can find the full report here...
health.nsw.gov.au/Infectious/cov…
NSW Opposition Leader, Chris Minns is live now.
I'll live tweet below
fb.watch/aFRaLxjsw6/
#covid19nsw #nswpol #auspol
I'll live tweet below
fb.watch/aFRaLxjsw6/
#covid19nsw #nswpol #auspol
Minns: "Dominic Perrottet says this will be 'the last wave' but expert after expert has said there will be more variants..."
#covid19nsw #nswpol #auspol
#covid19nsw #nswpol #auspol
Ryan Park: "This is a Premier that doesn't seem to be listening and doesn't seem to be learning."
#covid19nsw #nswpol #auspol
#covid19nsw #nswpol #auspol
NSW, Australia & Covid. A🧵
To hold Perrottet/Morrison to account we must:
1) Compare where we are with where wise countries (NZ, Sing, Korea) are today.
2) Compare what #letitrip has done vs where we'd be with sensible public health measures.
1/7
#covid19nsw #nswpol #auspol
To hold Perrottet/Morrison to account we must:
1) Compare where we are with where wise countries (NZ, Sing, Korea) are today.
2) Compare what #letitrip has done vs where we'd be with sensible public health measures.
1/7
#covid19nsw #nswpol #auspol
Perrottet's spin. He:
-Compares where we are against scenarios published recently by his govt. They're a distraction.
-Compares where we are today with the pain of lockdowns. The alternative to #letitrip was caution, not locking down. Don't buy it.
2/7
#covid19nsw #nswpol #auspol
-Compares where we are against scenarios published recently by his govt. They're a distraction.
-Compares where we are today with the pain of lockdowns. The alternative to #letitrip was caution, not locking down. Don't buy it.
2/7
#covid19nsw #nswpol #auspol
It's gone from:
"Don't look at the cases - look at the hospitalisations!"
to
"Not hospitalisations, look at the ICU admissions!"
to
"Sure, ICU is high, but look at deaths!"
to
"Yes, deaths are high, but look at the health of some of the dead!"
3/7
#covid19nsw #nswpol #auspol
"Don't look at the cases - look at the hospitalisations!"
to
"Not hospitalisations, look at the ICU admissions!"
to
"Sure, ICU is high, but look at deaths!"
to
"Yes, deaths are high, but look at the health of some of the dead!"
3/7
#covid19nsw #nswpol #auspol
NSW Covid-19 Update this morning at 10am.
Perrottet's careless #letitrip approach in NSW has just recorded its deadliest day.
I think mismanagement like this needs witnesses, so I'll live tweet some of it. Join me if you like.
#covid19nsw #nswpol #auspol
Perrottet's careless #letitrip approach in NSW has just recorded its deadliest day.
I think mismanagement like this needs witnesses, so I'll live tweet some of it. Join me if you like.
#covid19nsw #nswpol #auspol
Before we begin, some context:
NSW Media Conference with Perrottet, Hazzard & Dr Chant 10am today. I'll watch & live tweet below. It's way better with good company, so set an alarm for 9:55am, pop the kettle on & join me, if you like.
#covid19nsw #auspoI
#covid19nsw #auspoI
Okay I'm standing by. ABC's YouTube link for the NSW Media Conference is here. I wonder if they'll delay because the PM is speaking?
NSW R_eff as of January 9th with daily cases and restrictions. Latest estimate: R_eff = 1.41 ± 0.08
Plus SIR model projection.
Cases shown on a linear scale (log scale in next tweet).
More info chrisbillington.net/COVID_NSW.html
#covid19nsw #covidsydney

Plus SIR model projection.
Cases shown on a linear scale (log scale in next tweet).
More info chrisbillington.net/COVID_NSW.html
#covid19nsw #covidsydney


NSW R_eff as of January 9th with daily cases and restrictions. Latest estimate: R_eff = 1.41 ± 0.08
Plus SIR model projection.
(Cases shown on a log scale)
More info chrisbillington.net/COVID_NSW.html
#covid19nsw #covidsydney

Plus SIR model projection.
(Cases shown on a log scale)
More info chrisbillington.net/COVID_NSW.html
#covid19nsw #covidsydney


R_eff in Greater Sydney vs rest of New South Wales:
Greater Sydney: R_eff = 1.85 ± 0.09
NSW excluding Greater Sydney: R_eff = 2.32 ± 0.16
(Cases shown on a log scale)
(note region-specific data is several days old, does not include today's cases)
#covid19nsw #covidsydney

Greater Sydney: R_eff = 1.85 ± 0.09
NSW excluding Greater Sydney: R_eff = 2.32 ± 0.16
(Cases shown on a log scale)
(note region-specific data is several days old, does not include today's cases)
#covid19nsw #covidsydney


NSW R_eff as of January 8th with daily cases and restrictions. Latest estimate: R_eff = 1.69 ± 0.07
Plus SIR model projection.
Cases shown on a linear scale (log scale in next tweet).
More info chrisbillington.net/COVID_NSW.html
#covid19nsw #covidsydney

Plus SIR model projection.
Cases shown on a linear scale (log scale in next tweet).
More info chrisbillington.net/COVID_NSW.html
#covid19nsw #covidsydney


NSW R_eff as of January 8th with daily cases and restrictions. Latest estimate: R_eff = 1.69 ± 0.07
Plus SIR model projection.
(Cases shown on a log scale)
More info chrisbillington.net/COVID_NSW.html
#covid19nsw #covidsydney

Plus SIR model projection.
(Cases shown on a log scale)
More info chrisbillington.net/COVID_NSW.html
#covid19nsw #covidsydney


R_eff in Greater Sydney vs rest of New South Wales:
Greater Sydney: R_eff = 1.85 ± 0.09
NSW excluding Greater Sydney: R_eff = 2.32 ± 0.16
(Cases shown on a log scale)
(note region-specific data is several days old, does not include today's cases)
#covid19nsw #covidsydney

Greater Sydney: R_eff = 1.85 ± 0.09
NSW excluding Greater Sydney: R_eff = 2.32 ± 0.16
(Cases shown on a log scale)
(note region-specific data is several days old, does not include today's cases)
#covid19nsw #covidsydney


NSW R_eff as of January 7th with daily cases and restrictions. Latest estimate: R_eff = 1.76 ± 0.08
Plus SIR model projection.
Cases shown on a linear scale (log scale in next tweet).
More info chrisbillington.net/COVID_NSW.html
#covid19nsw #covidsydney

Plus SIR model projection.
Cases shown on a linear scale (log scale in next tweet).
More info chrisbillington.net/COVID_NSW.html
#covid19nsw #covidsydney


NSW R_eff as of January 7th with daily cases and restrictions. Latest estimate: R_eff = 1.76 ± 0.08
Plus SIR model projection.
(Cases shown on a log scale)
More info chrisbillington.net/COVID_NSW.html
#covid19nsw #covidsydney

Plus SIR model projection.
(Cases shown on a log scale)
More info chrisbillington.net/COVID_NSW.html
#covid19nsw #covidsydney


R_eff in Greater Sydney vs rest of New South Wales:
Greater Sydney: R_eff = 1.80 ± 0.09
NSW excluding Greater Sydney: R_eff = 2.02 ± 0.13
(Cases shown on a log scale)
(note region-specific data is several days old, does not include today's cases)
#covid19nsw #covidsydney

Greater Sydney: R_eff = 1.80 ± 0.09
NSW excluding Greater Sydney: R_eff = 2.02 ± 0.13
(Cases shown on a log scale)
(note region-specific data is several days old, does not include today's cases)
#covid19nsw #covidsydney


How many people are in NSW hospitals *with* Covid but not *for* Covid?
The Daily Telegraph says it's 40-50% of patients
I have data from 2 major hospitals that tell a different story
🧵 1/9
#covid19aus #covid19nsw #COVID19
The Daily Telegraph says it's 40-50% of patients
I have data from 2 major hospitals that tell a different story
🧵 1/9
#covid19aus #covid19nsw #COVID19
I asked clinicians from 4 big hospitals for an analysis of a random sample of currently admitted Covid patients
2 could help🙏
Both had very similar breakdowns:
~76-80% of Covid patients admitted *for* Covid illness
~20-24% admitted *with* Covid but for something else
2/9
2 could help🙏
Both had very similar breakdowns:
~76-80% of Covid patients admitted *for* Covid illness
~20-24% admitted *with* Covid but for something else
2/9
Some more detail on the samples ...
Hospital A: n=21
Hospital B: n=101
Both samples were randomly selected and statistically significant given total Covid patients at each facility
3/9
Hospital A: n=21
Hospital B: n=101
Both samples were randomly selected and statistically significant given total Covid patients at each facility
3/9
🚨 Those NSW hospitalisation numbers are >24 hrs behind and the situation is changing fast
ICU / ventilation increases this morning:
63 / 19 - NSW Health tweet 1
69 / 19 - NSW Health tweet 2
78 / 24 - Patient Flow Portal early AM
80 / 28 - PFP 10.20AM
#covid19aus #COVID19nsw
ICU / ventilation increases this morning:
63 / 19 - NSW Health tweet 1
69 / 19 - NSW Health tweet 2
78 / 24 - Patient Flow Portal early AM
80 / 28 - PFP 10.20AM
#covid19aus #COVID19nsw
So from 8PM last night to mid-morning today ...
ICU patients have increased 16%
Ventilated patients have increased 47%
It is a huge jump
Both Omicron and Delta are circulating widely and feeding these numbers
*There are people with both variants in ICU*
ICU patients have increased 16%
Ventilated patients have increased 47%
It is a huge jump
Both Omicron and Delta are circulating widely and feeding these numbers
*There are people with both variants in ICU*
We have little idea how much Covid there is in NSW, let alone the Delta v Omicron split
We do not know what hospitalisation / ICU / ventilation rates to expect
The best we can do is report on what is happening *right now*. Not what happened more than 24 hours ago
We do not know what hospitalisation / ICU / ventilation rates to expect
The best we can do is report on what is happening *right now*. Not what happened more than 24 hours ago
NSW has deflected responsibility for the massive pressures on the pathology system by focusing public attention on QLD's tourism testing
But in fact sheer case load is also a major factor affecting the testing system's capacity
Quick🧵1/6
#covid19aus #covid19nsw #CovidTesting
But in fact sheer case load is also a major factor affecting the testing system's capacity
Quick🧵1/6
#covid19aus #covid19nsw #CovidTesting
Prof Dwyer has confirmed NSW pathology labs use the 'pooling' process outlined by the Reddit thread
Pooling is supposed to help the system process large numbers of samples
Eg. Test 4 samples as a group
Negative? Move on
Positive? Go back and test each sample individually
2/6
Pooling is supposed to help the system process large numbers of samples
Eg. Test 4 samples as a group
Negative? Move on
Positive? Go back and test each sample individually
2/6
Prof Dwyer said today:
'The process of having to go back and retest positive pools takes a lot of time'
and
'The ability to pool is limited by how common the disease is in the community'
So the pooling process is directly affected by more cases / higher positivity rate
3/6
'The process of having to go back and retest positive pools takes a lot of time'
and
'The ability to pool is limited by how common the disease is in the community'
So the pooling process is directly affected by more cases / higher positivity rate
3/6
NSW R_eff as of December 18th with daily cases and restrictions. Latest estimate: R_eff = 3.35 ± 0.25
Cases shown on both a linear scale (first image) and log scale (second image).
More info chrisbillington.net/COVID_NSW.html
#covid19nsw #covidsydney

Cases shown on both a linear scale (first image) and log scale (second image).
More info chrisbillington.net/COVID_NSW.html
#covid19nsw #covidsydney


R_eff in Greater Sydney vs rest of New South Wales:
Greater Sydney: R_eff = 2.37 ± 0.27
NSW excluding Greater Sydney: R_eff = 8.55 ± 0.78
(Cases shown on a log scale)
(note region-specific data is several days old, does not include today's cases)
#covid19nsw #covidsydney

Greater Sydney: R_eff = 2.37 ± 0.27
NSW excluding Greater Sydney: R_eff = 8.55 ± 0.78
(Cases shown on a log scale)
(note region-specific data is several days old, does not include today's cases)
#covid19nsw #covidsydney


R_eff in LGAs of concern* vs the rest of NSW (*all of Penrith included):
LGAs of concern: R_eff = 1.92 ± 0.22
Rest of NSW: R_eff = 5.57 ± 0.50
(Cases shown on a log scale)
(note LGA data is several days old, does not include today's cases)
#covid19nsw #covidsydney

LGAs of concern: R_eff = 1.92 ± 0.22
Rest of NSW: R_eff = 5.57 ± 0.50
(Cases shown on a log scale)
(note LGA data is several days old, does not include today's cases)
#covid19nsw #covidsydney


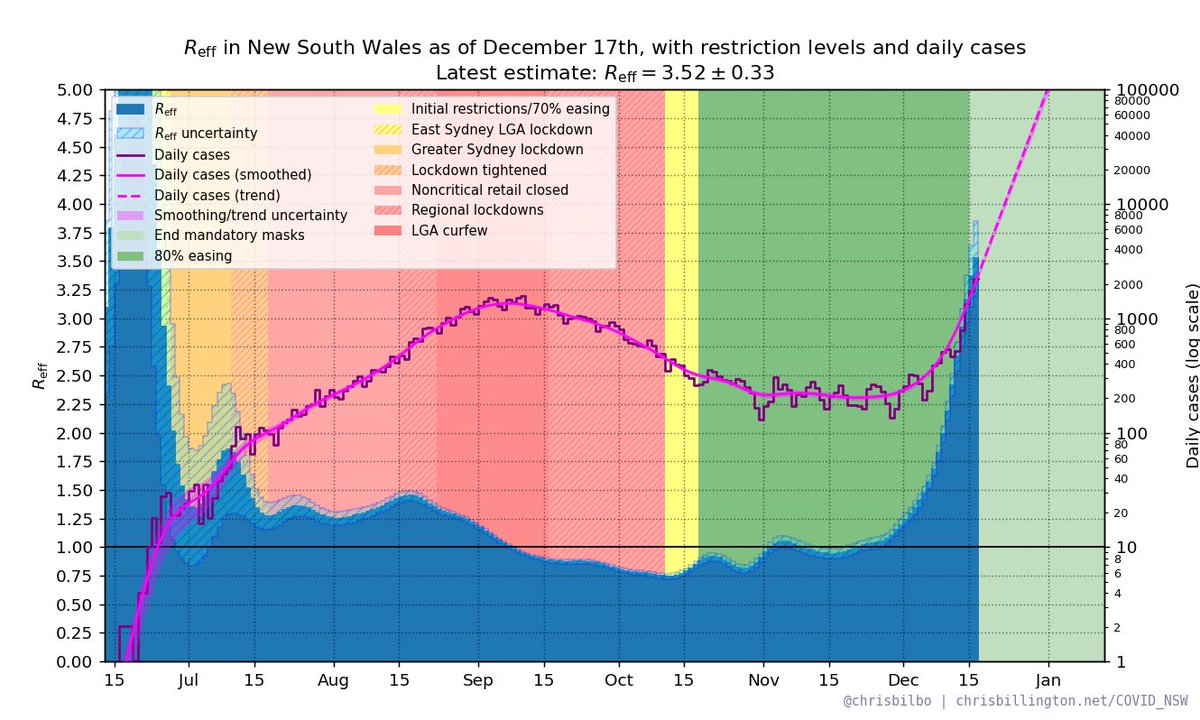
NSW R_eff as of December 17th with daily cases and restrictions. Latest estimate: R_eff = 3.52 ± 0.33
Cases shown on both a linear scale (first image) and log scale (second image).
More info chrisbillington.net/COVID_NSW.html
#covid19nsw #covidsydney

Cases shown on both a linear scale (first image) and log scale (second image).
More info chrisbillington.net/COVID_NSW.html
#covid19nsw #covidsydney


R_eff in Greater Sydney vs rest of New South Wales:
Greater Sydney: R_eff = 1.76 ± 0.17
NSW excluding Greater Sydney: R_eff = 7.22 ± 1.01
(Cases shown on a log scale)
(note region-specific data is several days old, does not include today's cases)
#covid19nsw #covidsydney

Greater Sydney: R_eff = 1.76 ± 0.17
NSW excluding Greater Sydney: R_eff = 7.22 ± 1.01
(Cases shown on a log scale)
(note region-specific data is several days old, does not include today's cases)
#covid19nsw #covidsydney


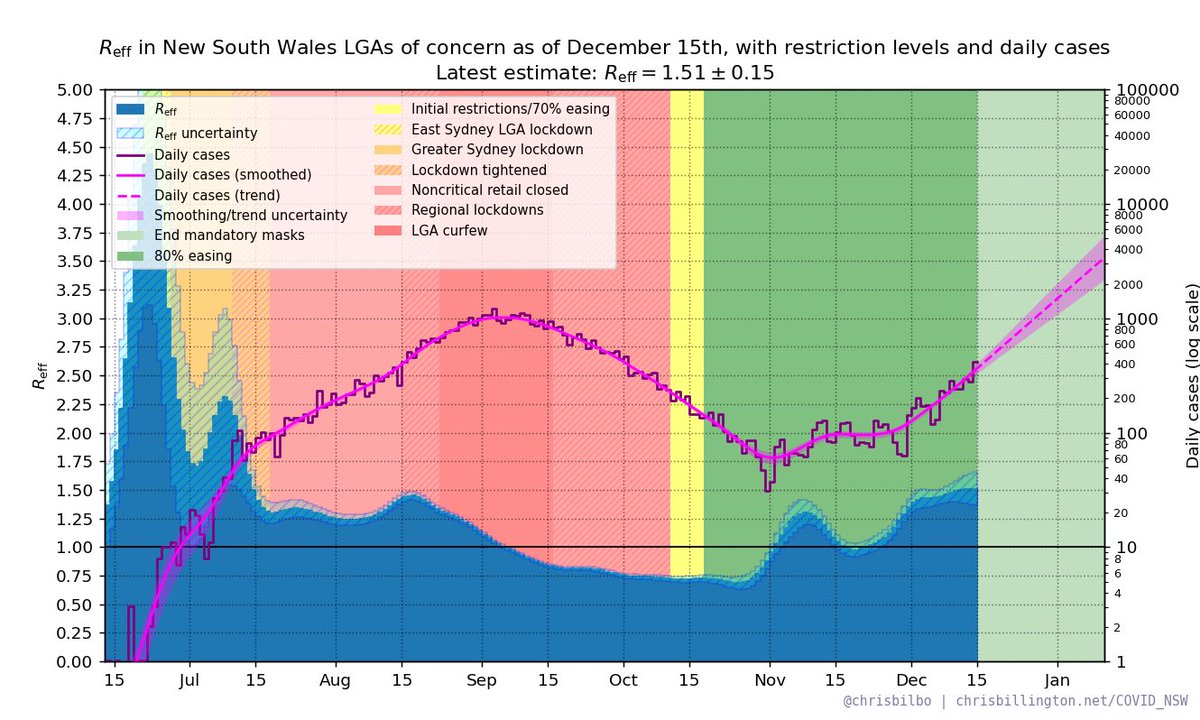
R_eff in LGAs of concern* vs the rest of NSW (*all of Penrith included):
LGAs of concern: R_eff = 1.51 ± 0.15
Rest of NSW: R_eff = 4.16 ± 0.56
(Cases shown on a log scale)
(note LGA data is several days old, does not include today's cases)
#covid19nsw #covidsydney

LGAs of concern: R_eff = 1.51 ± 0.15
Rest of NSW: R_eff = 4.16 ± 0.56
(Cases shown on a log scale)
(note LGA data is several days old, does not include today's cases)
#covid19nsw #covidsydney


NSW R_eff as of December 16th with daily cases and restrictions. Latest estimate: R_eff = 3.24 ± 0.63
Cases shown on both a linear scale (first image) and log scale (second image).
More info chrisbillington.net/COVID_NSW.html
#covid19nsw #covidsydney

Cases shown on both a linear scale (first image) and log scale (second image).
More info chrisbillington.net/COVID_NSW.html
#covid19nsw #covidsydney


R_eff in Greater Sydney vs rest of New South Wales:
Greater Sydney: R_eff = 1.45 ± 0.13
NSW excluding Greater Sydney: R_eff = 1.81 ± 0.32
(Cases shown on a log scale)
(note region-specific data is several days old, does not include today's cases)
#covid19nsw #covidsydney

Greater Sydney: R_eff = 1.45 ± 0.13
NSW excluding Greater Sydney: R_eff = 1.81 ± 0.32
(Cases shown on a log scale)
(note region-specific data is several days old, does not include today's cases)
#covid19nsw #covidsydney


R_eff in LGAs of concern* vs the rest of NSW (*all of Penrith included):
LGAs of concern: R_eff = 1.38 ± 0.14
Rest of NSW: R_eff = 1.65 ± 0.17
(Cases shown on a log scale)
(note LGA data is several days old, does not include today's cases)
#covid19nsw #covidsydney

LGAs of concern: R_eff = 1.38 ± 0.14
Rest of NSW: R_eff = 1.65 ± 0.17
(Cases shown on a log scale)
(note LGA data is several days old, does not include today's cases)
#covid19nsw #covidsydney


