Discover and read the best of Twitter Threads about #Btcusd
Most recents (24)
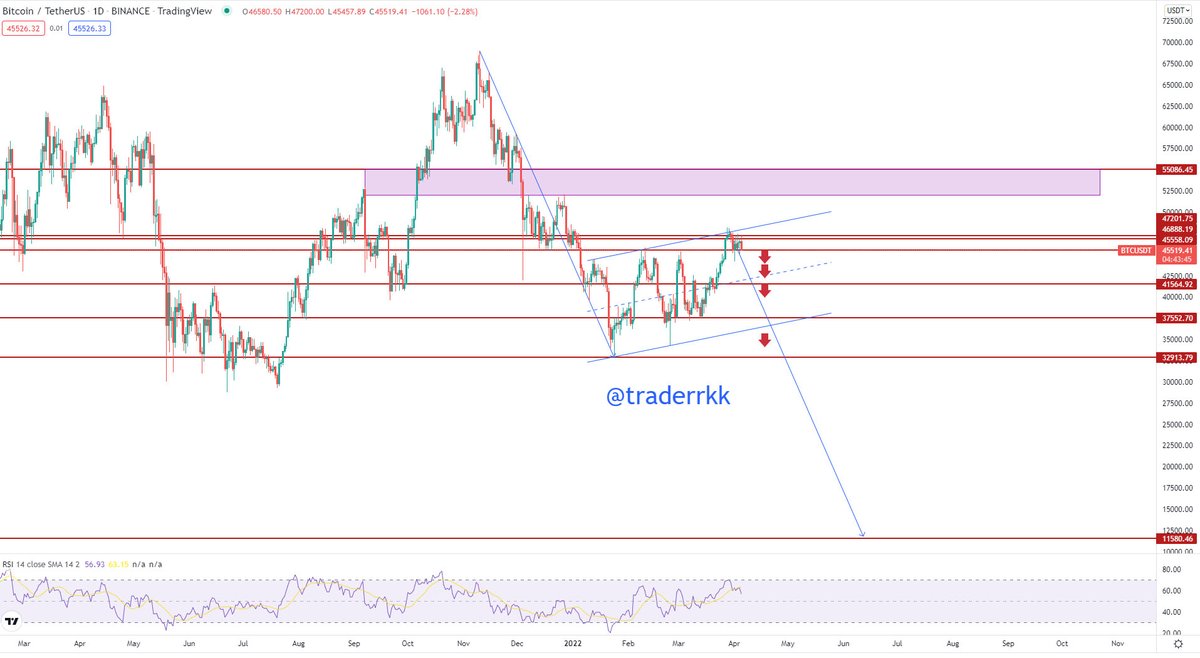
#BTCUSD HAFTALIK
Çok ekstra bir olay durum yaşanmadıkça kanalları bellidir. Bunun artık sohbetini yapmaya gerek yoktur.
Çok ekstra bir olay durum yaşanmadıkça kanalları bellidir. Bunun artık sohbetini yapmaya gerek yoktur.

30 K da dolanırken sinyali de @kerimcalender in sayfasında çaktım. 

#DAX HAFTALIK
50 gündür mum nerede ? Sınıra 50 gün önce getirmişler yatırmışlardır. Adamlar zamansız yukarı verseler satıcılar devreye girecektir, sert mum aşağı gelir. Aşağı getirse alıcı var ama, ALTIN yukarı gidiyor faizler düşüyor bozamıyorlar. Bekletip geçiyorlar.
50 gündür mum nerede ? Sınıra 50 gün önce getirmişler yatırmışlardır. Adamlar zamansız yukarı verseler satıcılar devreye girecektir, sert mum aşağı gelir. Aşağı getirse alıcı var ama, ALTIN yukarı gidiyor faizler düşüyor bozamıyorlar. Bekletip geçiyorlar.

#BTCUSD HAFTALIK 

Uğraşamadım detayla, açıklama yazmadım.
Sadece yatırımcısı ve stratejisi olanlar ve grafik okumayı bilenler için paylaştım.
Detaya girsem aşağıdaki risklerden de bahsetmem lazım yukarıdaki avantajlardan da bahsetmem lazım.
Bunları yapınca elli tane soru geliyor kafam bulanıyor.
Sadece yatırımcısı ve stratejisi olanlar ve grafik okumayı bilenler için paylaştım.
Detaya girsem aşağıdaki risklerden de bahsetmem lazım yukarıdaki avantajlardan da bahsetmem lazım.
Bunları yapınca elli tane soru geliyor kafam bulanıyor.
Kriptoda ciddi kazançlar yapacağını hayal edip hayatını kurtaracağını hayal edenlerin, yüzde 10
düşüşü görünce isyan etmeleri cidden yorucu geliyor.
Ana hatlar bellidir. Daha afaki rakamlar da var aşağı olsun yukarı olsun ama onlar için en kötü ve en iyi senaryo lazım.
düşüşü görünce isyan etmeleri cidden yorucu geliyor.
Ana hatlar bellidir. Daha afaki rakamlar da var aşağı olsun yukarı olsun ama onlar için en kötü ve en iyi senaryo lazım.
Abicim #BTC 2021 de show yaparken ben dedim ki aşağı da 17 K yukarı da 33 K kanalı var bunun.
17 K da koydu piyasa malını yaptı karını..
Fakat sosyal medya öyle değil. Her seviyede ileri de
ne olur diyor. Bu işin bu şekilde ne dibi bulunur ne tepesi. Doğru yerde risk alacaksın
17 K da koydu piyasa malını yaptı karını..
Fakat sosyal medya öyle değil. Her seviyede ileri de
ne olur diyor. Bu işin bu şekilde ne dibi bulunur ne tepesi. Doğru yerde risk alacaksın
Bana birisi şu an BTC alınır mı derse ben cevap vermem ki.. Neden vermem ? Daha yıl başında 17 K idi.
Ben oyuna sonradan dahil olanlar ile ilgilenmem.
Doğru adımı atmadıktan sonra bu işlerin benim gözümde değeri yoktur.
Ben oyuna sonradan dahil olanlar ile ilgilenmem.
Doğru adımı atmadıktan sonra bu işlerin benim gözümde değeri yoktur.
#BTCUSD
Kasım ayında dip görmüş.. Ben bu kasım ayına 2021 de değindim. Tarih yanaşıyor diye bir kaç ay önce twit ile yazdım.
Kasım ayında dip görmüş.. Ben bu kasım ayına 2021 de değindim. Tarih yanaşıyor diye bir kaç ay önce twit ile yazdım.

LOG vs LINEAR Charts - A Primer!🎯
✅ Why use LOG charts?
✅ What's the difference?
✅ When to use what?
All explained for you in just 2 mins...
Ready to learn?
Let's go🧵...
✅ Why use LOG charts?
✅ What's the difference?
✅ When to use what?
All explained for you in just 2 mins...
Ready to learn?
Let's go🧵...

#BTC #bitcoin #btcusd #trading
No es recomendación de compra/venta.
1/10
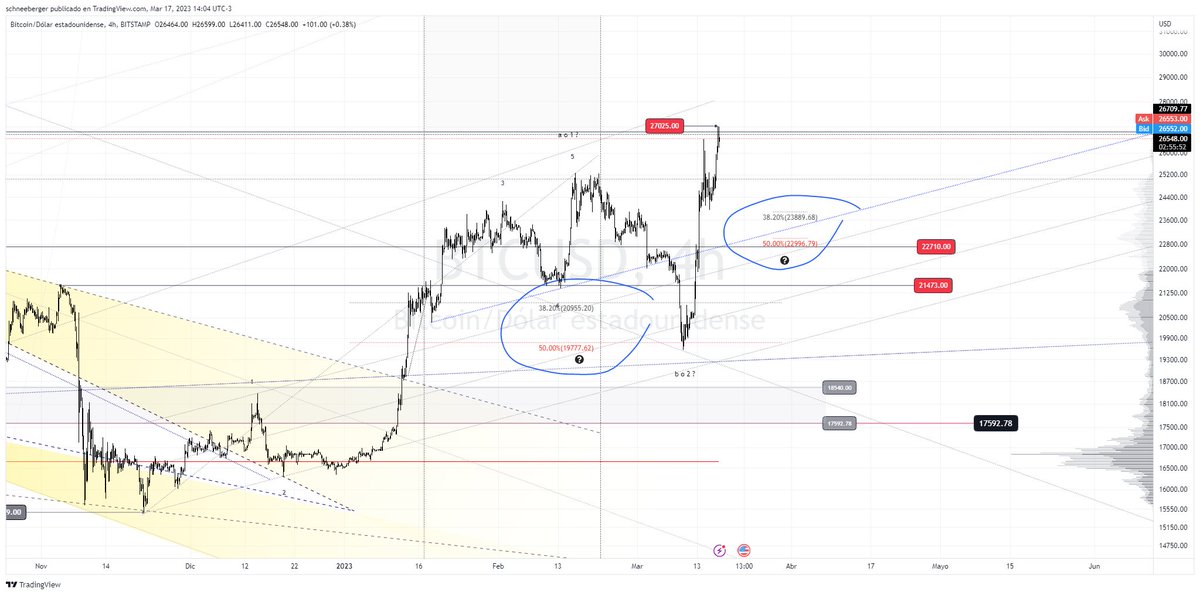
Antes de máximos evaluamos zonas próximas a,⚠️23.700 y 22.100 para evaluar comenzar un nuevo plan, considerando dos ingresos, luego debemos replantear para buscar un swing, o un intra, segun riesgo.
No es recomendación de compra/venta.
1/10
Antes de máximos evaluamos zonas próximas a,⚠️23.700 y 22.100 para evaluar comenzar un nuevo plan, considerando dos ingresos, luego debemos replantear para buscar un swing, o un intra, segun riesgo.
#BTC #bitcoin #btcusd #trading
No es recomendación de compra/venta.
2/10
1º tenemos que especular donde estamos, y que esperamos 12H, onda 3 o C en curso...
tradingview.com/x/ZX5YoNvX/
No es recomendación de compra/venta.
2/10
1º tenemos que especular donde estamos, y que esperamos 12H, onda 3 o C en curso...
tradingview.com/x/ZX5YoNvX/

#BTC #bitcoin #btcusd #trading
No es recomendación de compra/venta.
3/10
2º Bajamos a H4, idendificamos impulsos en 2 fractales, 1 evaluado como abc o 123, movimiento en curso C o 3. Identidicamos zonas de riesgo para cada uno. Definimos canales y tl.
tradingview.com/x/EMq4Hykf/
No es recomendación de compra/venta.
3/10
2º Bajamos a H4, idendificamos impulsos en 2 fractales, 1 evaluado como abc o 123, movimiento en curso C o 3. Identidicamos zonas de riesgo para cada uno. Definimos canales y tl.
tradingview.com/x/EMq4Hykf/
The world of #finance is rapidly changing, and crypto is leading the way. In this thread, we'll explore why advisors must learn about #crypto or risk losing their clients. $QUACK #financialadvisor #Cryptos #BTCUSD #Bitcoin2023 #bitcoinprice
🧵👇
🧵👇

1/7 Why advisors need to learn about crypto: As the demand for crypto assets and services continues to grow, advisors who are not knowledgeable about the space risk losing clients to competitors who are. $QUACK
2/7 The rise of crypto: The crypto market has seen significant growth in recent years, and this trend is expected to continue. Advisors who ignore this growing market risk missing out on significant opportunities. $QUACK
Crypto investing can be exhausting!
1000 opportunities demand your attention every day
Until you get overwhelmed and give up.
What you lack is a habit framework that keeps you going.
🧵👇10 lessons I learned from the book:
"Atomic Habits"
#BTC #NFTdrops #Arbitrum $FET
1000 opportunities demand your attention every day
Until you get overwhelmed and give up.
What you lack is a habit framework that keeps you going.
🧵👇10 lessons I learned from the book:
"Atomic Habits"
#BTC #NFTdrops #Arbitrum $FET

In this thread I'll explain:
💠The power of small habits
💠Focus on systems
💠Make your habits attractive
💠Start with an easy habit
💠The power of temptation bundling
💠Habit visibility
💠The power of habit stacking
💠Cues
💠The power of social accountability
💠 Habit Rewards
💠The power of small habits
💠Focus on systems
💠Make your habits attractive
💠Start with an easy habit
💠The power of temptation bundling
💠Habit visibility
💠The power of habit stacking
💠Cues
💠The power of social accountability
💠 Habit Rewards
1 💠The power of small habits (brushing teeth)
In crypto investing, small habits like:
researching a new project every day
reading a thread
reaching out to 1 person
can lead to big gains over time
Remember, success is built on the small things you do consistently.
#SOLANA
In crypto investing, small habits like:
researching a new project every day
reading a thread
reaching out to 1 person
can lead to big gains over time
Remember, success is built on the small things you do consistently.
#SOLANA

1/10 📣We are delighted to announce that V. George, known by many as @MisterSpread will be joining us as a speaker at the upcoming Conference!
Learn more about him in this 🧵 👇
#blockchain #ParadigmShift #SeedCaptain #MultiversX
Learn more about him in this 🧵 👇
#blockchain #ParadigmShift #SeedCaptain #MultiversX

2/10 With over 12 years of experience in the classic markets and 3 years in the crypto space, he is highly proficient in trading & investing.
📈He has been an active participant in the financial markets & has a deep understanding of the nuances & complexities of the industry.
📈He has been an active participant in the financial markets & has a deep understanding of the nuances & complexities of the industry.
3/10 As a Business Advisor, he provided valuable insights that helped @sense4fit develop its innovative fitness technology.
His business proficiency and strategic thinking have been valuable assets in supporting @BlackHatNetwork to achieve their goals & grow their business #BHAT
His business proficiency and strategic thinking have been valuable assets in supporting @BlackHatNetwork to achieve their goals & grow their business #BHAT
#BTCUSD GÜNLÜK
Benim önceliğim daha çok dünya piyasaları olmuştur.
Beni anlamak demek M.B larını anlamak demektir.
Dünya bir bütündür ve tek elden yönetilir.
Kriptolara çok baskı uyguladılar ama sebeplerini anlattım ve dedim ki; bunlar hacimli enstrümanlar işlerine gelmiyor
Benim önceliğim daha çok dünya piyasaları olmuştur.
Beni anlamak demek M.B larını anlamak demektir.
Dünya bir bütündür ve tek elden yönetilir.
Kriptolara çok baskı uyguladılar ama sebeplerini anlattım ve dedim ki; bunlar hacimli enstrümanlar işlerine gelmiyor

bunların hareketlenmesi.. Sebebini de bugün anlattım.
Faiz tarafında ve parite tarafların da istediklerini almadan hareket etmiyorlar. Çünkü; dünya hızı kaldırmıyor. Bu sebeple bütün psikolojik baskıyı buraya
haber akışları ile uyguluyorlar. Neyse teknik grafik yukarıdadır.
Faiz tarafında ve parite tarafların da istediklerini almadan hareket etmiyorlar. Çünkü; dünya hızı kaldırmıyor. Bu sebeple bütün psikolojik baskıyı buraya
haber akışları ile uyguluyorlar. Neyse teknik grafik yukarıdadır.
Yarın da dahil 31 Aralık gecesine kadar 18.500 18.700
bölgesi önemlidir. Özellikle yıl başına bu rakamın üstünde kalırsanız biraz peşinizi bıraktılar demektir.
bölgesi önemlidir. Özellikle yıl başına bu rakamın üstünde kalırsanız biraz peşinizi bıraktılar demektir.
LOG vs LINEAR Charting!
This is the most important thing especially if you are analysing long term charts!🧐
So, let's get this right today!
Let’s go🧵...
This is the most important thing especially if you are analysing long term charts!🧐
So, let's get this right today!
Let’s go🧵...

Even the biggest handles with 100k+ followers get this simple thing wrong in charting!🤦♂️
This is the most important thing especially if you are analysing long term charts!🧐
So, let's get this right today!
USE LOG CHARTS 📈 FOR ANALYSING LONG TERM CHARTS!
Let’s go🧵...
This is the most important thing especially if you are analysing long term charts!🧐
So, let's get this right today!
USE LOG CHARTS 📈 FOR ANALYSING LONG TERM CHARTS!
Let’s go🧵...
So ,for all those twitter users who are seeing this but are not part of $ocean community
This is a must read for you !!!
Just give me the next 15 mins of your life to explain the future of #dataeconomy by @oceanprotocol
.
.
#BTCUSD #btc #ethereum @elonmusk #Crypto #oceanprotocol
This is a must read for you !!!
Just give me the next 15 mins of your life to explain the future of #dataeconomy by @oceanprotocol
.
.
#BTCUSD #btc #ethereum @elonmusk #Crypto #oceanprotocol
I will start with this direct question
How will the collision of #AI and #Blockchain will look like and what will happen if we unleash AI into a decentralised substrate like #Ethereum ?
I know its confusing but
As we all know that AI needs a lot of data to operate at its best...
How will the collision of #AI and #Blockchain will look like and what will happen if we unleash AI into a decentralised substrate like #Ethereum ?
I know its confusing but
As we all know that AI needs a lot of data to operate at its best...
And blockchain helps sharing datasets for higher accuracy models and more but whether be it blockchains or AI for big data , all roads lead to thing - The problem of quality data !!!
Many enterprises have plenty of data but don't know how to make it available to the world .
Many enterprises have plenty of data but don't know how to make it available to the world .
ALTSEASON 2022 THREAD⛓️
AltSeason is basically cryptos except #BTC stays green for quite some time according to huge buying pressure and continuous decreasing BTC dominance. There is a trend/path always this phenomenal follows.
1/n
AltSeason is basically cryptos except #BTC stays green for quite some time according to huge buying pressure and continuous decreasing BTC dominance. There is a trend/path always this phenomenal follows.
1/n

and, also there is a 4 wave cyclic pattern #BTC following for every past ATHs. This is nicely explained by @BTCfuel in one of their thread. They are demand waves and happen when a lot of money flows into market in a short timeframe. The 4 waves are clearly visible here.
2/n
2/n

First, it's take off because of buying pressure, then first sell-off happens, then a cycle top comes after a fake-top. The 4 waves are clearly visible in the Realize Cap HODL Waves indicator above.
3/n
3/n
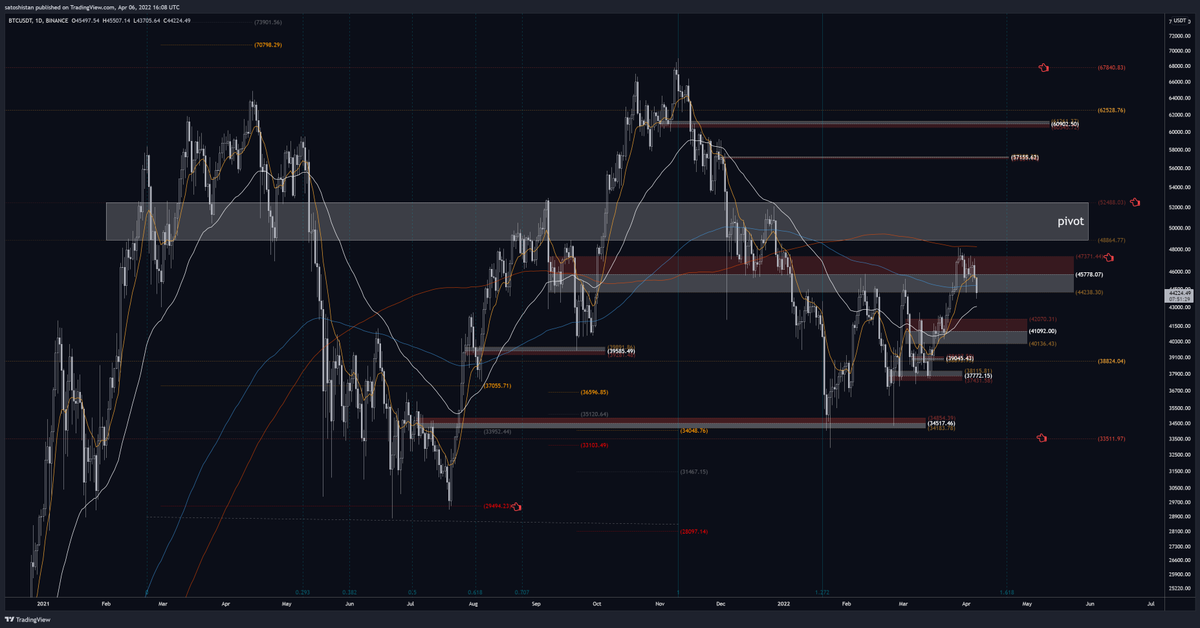
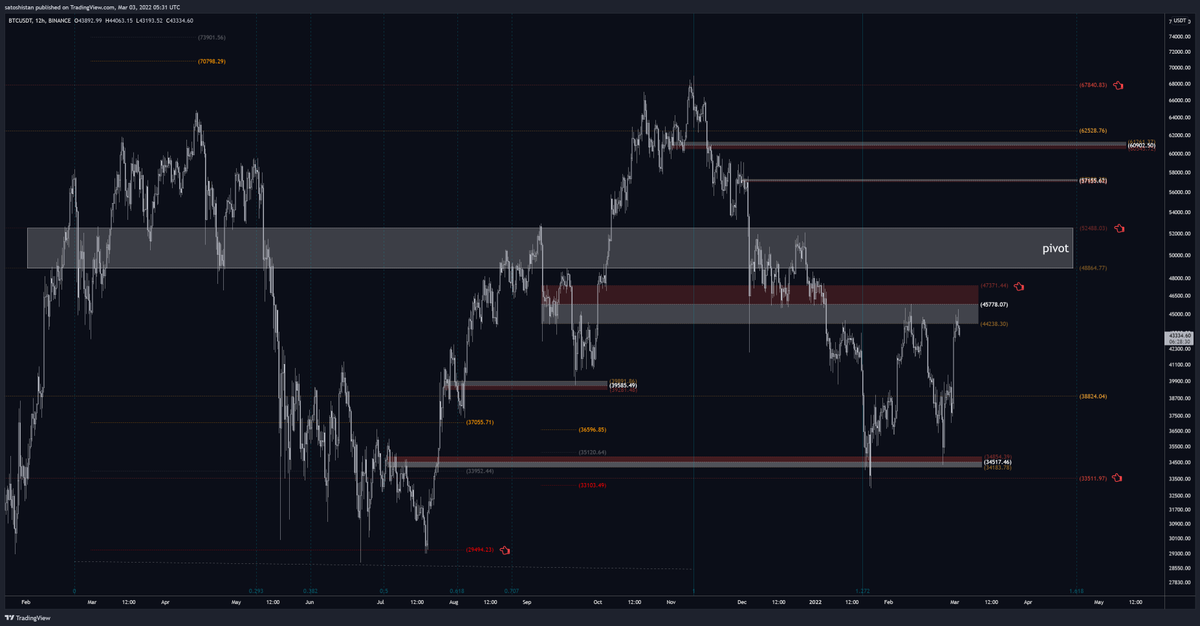
let me explain why i'm still bearish on #Bitcoin
i'm trading my own pivot system
colored boxes are pivots
under box=bearish and over box=bullish
very easy
red line levels = max rejection points which you can see worked almost perfectly
#btcusd #btcusdt #xbtusd $xbt $btc #btc
i'm trading my own pivot system
colored boxes are pivots
under box=bearish and over box=bullish
very easy
red line levels = max rejection points which you can see worked almost perfectly
#btcusd #btcusdt #xbtusd $xbt $btc #btc
Introducing #Bitcoin Diamond Hands Fibonacci Ribbons - > how the mystery of the remarkable number “Phi” reveals itself in key Bitcoin price levels.
These ribbons reveal natural #BTC levels of:
📉price support
📈resistance
🔴cycle tops
🟢cycle bottoms
A 🧵on how it works👇
These ribbons reveal natural #BTC levels of:
📉price support
📈resistance
🔴cycle tops
🟢cycle bottoms
A 🧵on how it works👇

1.618 Phi (AKA the Divine Ratio) , explains many patterns in life:
-the shape of galaxies
-ancient pyramid design
-beautiful faces
-DNA helix spiral
-Leonardo’s Vitruvian Man
-Plant growth patterns
-Art ratios
-Architecture
Phi is everywhere… including Bitcoin
-the shape of galaxies
-ancient pyramid design
-beautiful faces
-DNA helix spiral
-Leonardo’s Vitruvian Man
-Plant growth patterns
-Art ratios
-Architecture
Phi is everywhere… including Bitcoin

Phi And Fibonacci extensions reveal human #tradingpsychology support and resistance levels.
The Fibonacci sequence begins with 0 and 1, with the next number being the sum of the previous two. 0, 1, 1, 2, 3, 5… etc.
Phi is the ratio of two adjacent numbers in the sequence
The Fibonacci sequence begins with 0 and 1, with the next number being the sum of the previous two. 0, 1, 1, 2, 3, 5… etc.
Phi is the ratio of two adjacent numbers in the sequence
🧵 time...
For years, as I have discussed the value prop for seizure-resistant, non-sovereign💲like #BTC with noobies, I have always had to caveat it with "we don't think about it in the Western world too much bc our money, banking system, and law typically work well"
Well...
For years, as I have discussed the value prop for seizure-resistant, non-sovereign💲like #BTC with noobies, I have always had to caveat it with "we don't think about it in the Western world too much bc our money, banking system, and law typically work well"
Well...
2/ #Bitcoin's value in the Western world has NEVER been more obvious thanks to the last ~ 2 years.
Reminder, it has ALWAYS been valuable to those less fortunate living under authoritarianism or double-digit inflation (over half the world)
newsweek.com/half-world-liv…
@gladstein
Reminder, it has ALWAYS been valuable to those less fortunate living under authoritarianism or double-digit inflation (over half the world)
newsweek.com/half-world-liv…
@gladstein
3/ Now, Westerners are getting their taste:
- 10%+ inflation for many (screw the official #CPI numbers)
- Bank accounts being inexplicably closed @haydenzadams @PeterMcCormack
- Govt freezing funds and threatening companies #TruckersForFreedom
- ~25% M2 debasement in ~2 years
- 10%+ inflation for many (screw the official #CPI numbers)
- Bank accounts being inexplicably closed @haydenzadams @PeterMcCormack
- Govt freezing funds and threatening companies #TruckersForFreedom
- ~25% M2 debasement in ~2 years

Will $33,000 remain a bottom?
Will we see a new peak in 2022? 👇++
#Bitcoin $BTC #BTCUSD
#BTCUSDT #BTCUSD #btcgbp
#cryptocurrency #Crypto #cryptocommunity
#CryptoNews #cryptocurrencies


Will we see a new peak in 2022? 👇++
#Bitcoin $BTC #BTCUSD
#BTCUSDT #BTCUSD #btcgbp
#cryptocurrency #Crypto #cryptocommunity
#CryptoNews #cryptocurrencies


According to the #Bitcoin weekly chart (if $32900 is considered a bottom), the first major level we will be rejected is given below. ++
^^NOT INVESTMENT ADVICE^^
#Bitcoin #Btc $Btc
#Btcusd #Btcusdt
#cryptocurrency #cryptocurrencies
#Crypto #cryptocrash #cryptocommunity
^^NOT INVESTMENT ADVICE^^
#Bitcoin #Btc $Btc
#Btcusd #Btcusdt
#cryptocurrency #cryptocurrencies
#Crypto #cryptocrash #cryptocommunity

I have been criticizing the forecasts of S2F model since 2019, but I don't agree with this article. It arrives at some correct conclusions based on wrong arguments.
Let me elaborate.👇
bitcoinmagazine.com/markets/why-bi…
Let me elaborate.👇
bitcoinmagazine.com/markets/why-bi…
'ENFLATION ENEMY CRYPTO COINS AND #Bitcoin'
In 2011, after the upper break of the channel middle band, only one retest was made and it increased by 3189 %. +++
#Bitcoin #BTC $BTC
#BTCUSD #BTCUSDT
#Crypto #cryptocurrency #cryptocurrecy
#CryptoNews #cryptocommunity
In 2011, after the upper break of the channel middle band, only one retest was made and it increased by 3189 %. +++
#Bitcoin #BTC $BTC
#BTCUSD #BTCUSDT
#Crypto #cryptocurrency #cryptocurrecy
#CryptoNews #cryptocommunity

In 2013, after the upper break of the channel middle band, only 3 retests were made and it increased by 2195%.
#Bitcoin
#Bitcoin
In 2017, after the upper break of the channel middle band, only 4 retests were made and it increased by 646%.
#Bitcoin
#Bitcoin
#btcusd: Should we expect another leg up this year?
I think not:
1. If the stock market is like an avg 2nd year presidential year, it will move sideways.
#btc is moved by similar mechanisms/confounders and is unlikely to behave very differently.
I think not:
1. If the stock market is like an avg 2nd year presidential year, it will move sideways.
#btc is moved by similar mechanisms/confounders and is unlikely to behave very differently.

2. #btc just came out of a bull market.
The logical next thing to happen is a bear market, not another bull market.
However: This bull market was weaker than previous ones, which weakly suggests the bear market might also be weaker.
hcburger.com/blog/powerlaw

The logical next thing to happen is a bear market, not another bull market.
However: This bull market was weaker than previous ones, which weakly suggests the bear market might also be weaker.
hcburger.com/blog/powerlaw


There seems to be a lot of hope that another leg up might be happening anytime soon, but this seems to be based mostly on wishful thinking (as far as I can tell).
Another move down or prolonged sideways movement is more likely than a strong move up.
Another move down or prolonged sideways movement is more likely than a strong move up.
10 #Bitcoin Cycle Top Price Prediction Models
📈(in ascending order of hopium)
🔬Let's review 10 popular price models for $BTC to see where we could potentially peak.
☝️ BONUS - These targets will INCREASE with time as uptrend will push model prices upward🚀
🧵A Thread [0/11]
📈(in ascending order of hopium)
🔬Let's review 10 popular price models for $BTC to see where we could potentially peak.
☝️ BONUS - These targets will INCREASE with time as uptrend will push model prices upward🚀
🧵A Thread [0/11]

$BTC Mayer Multiple - by @tracemayer is a price projection calculated as a 2.4 multiple of the #bitcoinprice 200DMA.
🦥Looking at the chart we can see $122,034 is our most conservative price estimate.
💥Bitcoin has overshot this multiple in EVERY cycle peak.
👉 next up
1/11
🦥Looking at the chart we can see $122,034 is our most conservative price estimate.
💥Bitcoin has overshot this multiple in EVERY cycle peak.
👉 next up
1/11

BTC Power Law Corridor by @hcburger1 takes linear regression bands of the historical #bitcoin price to derive a corridor to represent the correlation between bitcoin’s price and time.
🎯$130,622 target
🟢 price is in middle of corridor uptrend
👉 but we can go higher...
2/11
🎯$130,622 target
🟢 price is in middle of corridor uptrend
👉 but we can go higher...
2/11


