Discover and read the best of Twitter Threads about #100DayswithMachinelearning
Most recents (24)
Ridge Regression (RR) is regularization technique used in statistical modeling & ML to handle the problem of multicollinearity (high correlation) among predictor variables 

It is an extension of linear regression ( LR) that adds a penalty term to the least squares objective function, resulting in a more stable and robust model.
🔹 If ML model is not accurate. it can make predictions error & these prediction errors are usually known as Bias & Variance
🔹 In ML these errors will alway be present as there is always slight difference between model predictions & actual predictions
🔹 In ML these errors will alway be present as there is always slight difference between model predictions & actual predictions
Polynomial regression is type of regression analysis where relationship between independent variable(s) and dependent variable is modeled as an nth-degree polynomial function.
It is an extension of simple linear regression which assumes linear relationship between the variable
It is an extension of simple linear regression which assumes linear relationship between the variable
In polynomial regression, the polynomial function takes the form:
y = β₀ + β₁x + β₂x² + ... + βₙxⁿ
y = β₀ + β₁x + β₂x² + ... + βₙxⁿ
Mini-batch gradient descent is a variation of the gradient descent optimization algorithm used in ML & DL
It is designed to address the limitations of two other variants: BGD and SGD
It is designed to address the limitations of two other variants: BGD and SGD

In BGD the entire training dataset is used to compute the gradient of the cost function for each iteration.
This approach guarantees convergence to the global minimum but can be computationally expensive, especially for large datasets
This approach guarantees convergence to the global minimum but can be computationally expensive, especially for large datasets
SGD is an optimization algorithm often used in machine learning applications to find the model parameters that correspond to the best fit between predicted and actual outputs. It’s an inexact but powerful technique.
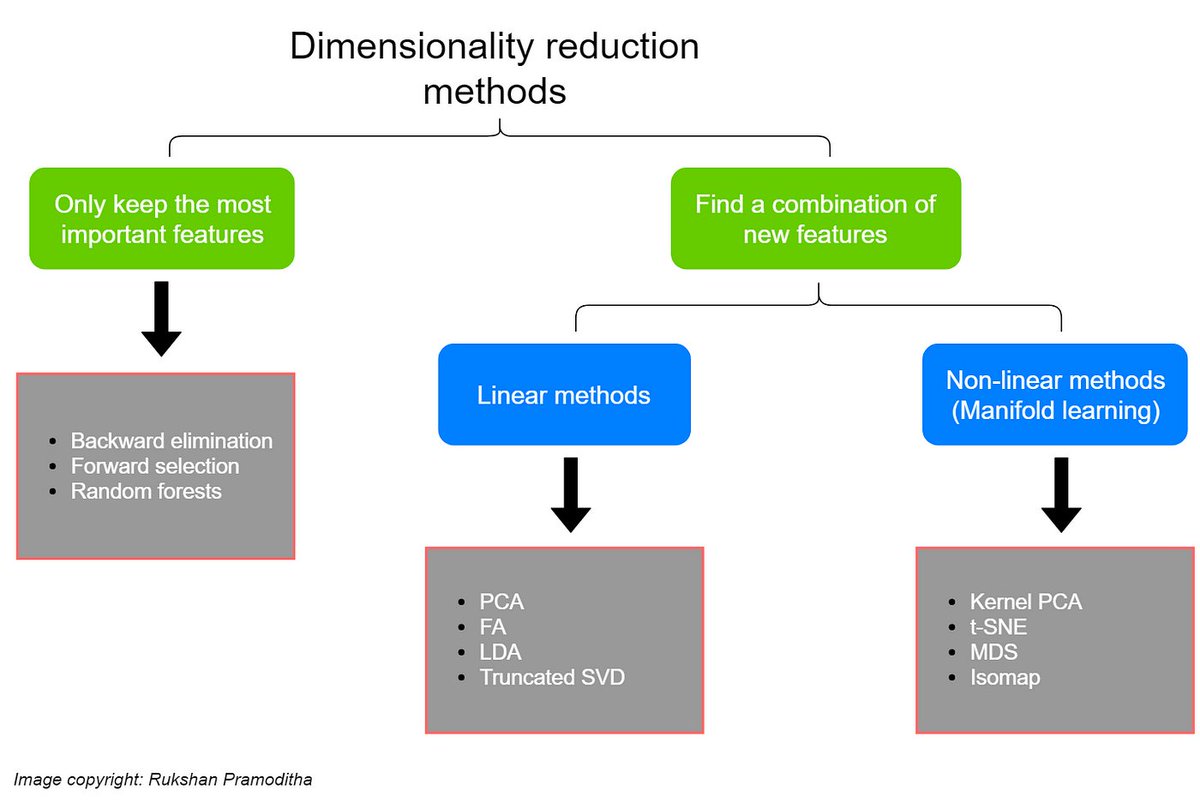
PCA statistics is science of analyzing all the dimension & reducing them as much as possible while preserving exact information
You can monitor multi-dimensional data (can visualize in 2D or 3D dimension) over any platform using the Principal Component Method of factor analysis.
You can monitor multi-dimensional data (can visualize in 2D or 3D dimension) over any platform using the Principal Component Method of factor analysis.
Feature construction is a critical aspect of feature engineering, which involves the process of creating new features or transforming existing ones to improve the performance of machine learning models. 

The goal of feature construction is to extract meaningful information from raw data and represent it in a way that can be effectively used by machine learning algorithms.
Outliers are a very important and crucial aspect of Data Analysis.
It can be treated in different ways, such as trimming, capping, discretization, or by treating them as missing values.
It can be treated in different ways, such as trimming, capping, discretization, or by treating them as missing values.
Percentile Method -
This technique works by setting a particular threshold value, which is decided based on our problem statement.
While we remove the outliers using capping, then that particular method is known as Winsorization.
This technique works by setting a particular threshold value, which is decided based on our problem statement.
While we remove the outliers using capping, then that particular method is known as Winsorization.
Day 43 of #100dayswithmachinelearning
Topic - Outlier Detection and Removal using the IQR Method
A Thread 🧵
Topic - Outlier Detection and Removal using the IQR Method
A Thread 🧵

Day 42 of #100dayswithMachinelearning
Topic -- Outlier Detection & Removal using Z-score Method
A Thread 🧵
Topic -- Outlier Detection & Removal using Z-score Method
A Thread 🧵

Day 33 of #100dayswithmachinelearning
Topic - Handling Mixed Variable in Feature Engineering 👨💻
A Thread 🧵
Topic - Handling Mixed Variable in Feature Engineering 👨💻
A Thread 🧵

Day 32 of #100dayswithmachinelearning
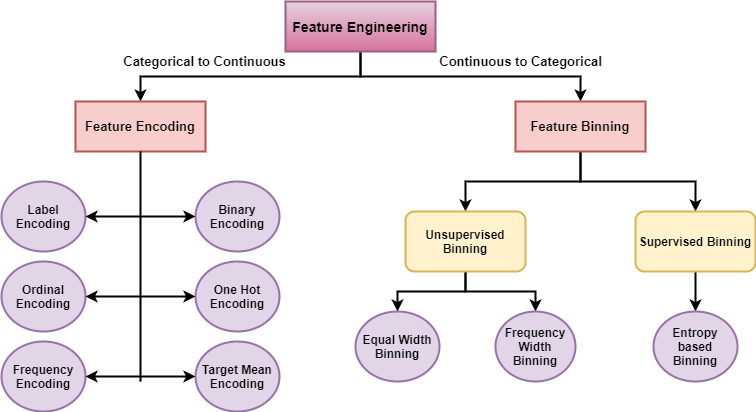
Topic - Encode Numerical Features ( Binning & Binarization )
A Thread 🧵
Topic - Encode Numerical Features ( Binning & Binarization )
A Thread 🧵

Discretization: It is process of transforming continuous variables into categorical variable by creating set of intervals, which are contiguous, that span over the range of the variable’s values. It is also known as “Binning”, where the bin is an analogous name for an interval
Benefits of Discretization or Binning :
1⃣ Handles the Outliers in a better way.
2⃣ Improves the value spread.
3⃣ Minimize the effects of small
observation errors.
1⃣ Handles the Outliers in a better way.
2⃣ Improves the value spread.
3⃣ Minimize the effects of small
observation errors.
🔸Power Transformation techniques are the type of feature transformation technique where the power is applied to the data observations for transforming the data.
🔸Two types of Power Transformation techniques:
1⃣ Box-Cox Transform
2⃣ Yeo-Johnson Transform
🔸Two types of Power Transformation techniques:
1⃣ Box-Cox Transform
2⃣ Yeo-Johnson Transform
▶️Box-Cox Transform :
This is mainly used for transforming the data observation by applying power to them. The power of data observation is denoted by Lambda(λ). There are mainly 2⃣ conditions associated with power in this transform which is lambda equal zero and not equal to0⃣
This is mainly used for transforming the data observation by applying power to them. The power of data observation is denoted by Lambda(λ). There are mainly 2⃣ conditions associated with power in this transform which is lambda equal zero and not equal to0⃣
🔸Pandas profiling offers report generation for the dataset with lots of features and customizations for the report generated.
🔸let’s explore all the sections of the report one by one.
1. Overview
This section consists of the 3 tabs: Overview, Warnings, and Reproduction.
🔸let’s explore all the sections of the report one by one.
1. Overview
This section consists of the 3 tabs: Overview, Warnings, and Reproduction.
2. Variables
This section of the report gives a detailed analysis of all the variables/columns/features of the dataset. The information presented varies depending upon the data type of variable.
This section of the report gives a detailed analysis of all the variables/columns/features of the dataset. The information presented varies depending upon the data type of variable.
✅Bivariate Analysis
Bi means two and variate means variable, so here there are two variables. The analysis is related to cause and the relationship between the two variables.
Three types -
🔸Scatter Plot
🔸Linear Correlation
🔸Chi-square Test
Bi means two and variate means variable, so here there are two variables. The analysis is related to cause and the relationship between the two variables.
Three types -
🔸Scatter Plot
🔸Linear Correlation
🔸Chi-square Test
✅Multivariate analysis :
is required when more than two variables have to be analyzed simultaneously.
Types -
🔸Cluster Analysis
🔸Factor Analysis
🔸Multiple Regression Analysis
🔸 Principal Component Analysis
is required when more than two variables have to be analyzed simultaneously.
Types -
🔸Cluster Analysis
🔸Factor Analysis
🔸Multiple Regression Analysis
🔸 Principal Component Analysis
🔸Uni means one and variate means variable, so in univariate analysis, there is only one dependable variable. The objective of univariate analysis is to derive the data, define and summarize it, and analyze the pattern
🔸Univariate data can be described through:
- Ø Frequency Distribution Tables
Ø Bar Charts
Ø Histograms
Ø Pie Charts
Ø Frequency Polygons
- Ø Frequency Distribution Tables
Ø Bar Charts
Ø Histograms
Ø Pie Charts
Ø Frequency Polygons
🔸The quality & quantity of data available for training & testing play significant role in determining the performance of ML model
🔸ML algorithm use data to learn pattern & relationship between input variable target output whch can be used for prediction or classification tasK
🔸ML algorithm use data to learn pattern & relationship between input variable target output whch can be used for prediction or classification tasK
🔸Data can be divided into training and testing sets. The training set is used to train the model, and the testing set is used to evaluate the performance of the model. It is important to ensure that the data is split in a random and representative way.
Day 12 of #100DayswithMachineLearning
Topic - Installing Anaconda & Gather Basic Knowledge About these Tools - Jupyter Notebook || Google Colab
🧵
Topic - Installing Anaconda & Gather Basic Knowledge About these Tools - Jupyter Notebook || Google Colab
🧵
1⃣ Anaconda is a distribution of the #Python and R #programming languages for scientific computing (#datascience, #machinelearning applications, large-scale #data processing, predictive analytics, etc.), that aims to simplify package management and #deployment. 

2⃣ The #JupyterNotebook is an open source #web application that you can use to create and share documents that contain live #code, equations, #visualizations, and text. Jupyter #Notebook is maintained by the people at Project Jupyter.
Blog Link - realpython.com/jupyter-notebo…
Blog Link - realpython.com/jupyter-notebo…
A tensor is a container which can house data in N #dimensions. Often and erroneously used interchangeably with the matrix (which is specifically a 2-dimensional #tensor), tensors are generalizations of #matrices to N-dimensional space
Tensor notation is much like matrix notation
Tensor notation is much like matrix notation

Tensors are more than simply a data container, however. Aside from holding numeric #data, tensors also include descriptions of the valid linear #transformations between tensors. Examples - include the cross product and the dot product.
Blog Link - kdnuggets.com/2018/05/wtf-te…
Blog Link - kdnuggets.com/2018/05/wtf-te…
Day 10 of #100dayswithMachineLearning
Topic - Data Engineer Vs Data Analyst Vs Data Scientist Vs ML Engineer
🧵
Topic - Data Engineer Vs Data Analyst Vs Data Scientist Vs ML Engineer
🧵
Do you want to start a career in the field of #DataScience #MachineLearning but confused about the different job titles available in this Data-Driven career and the appropriate skill sets needed to excel in one
#Data powers today's world ransformed radically by #data @avizyt
#Data powers today's world ransformed radically by #data @avizyt

This article aims to demystify the different job titles for #datascience and #machinelearning based career paths. We would look into some job titles such as #DataAnalyst, Data Scientist, Data Engineer, and Machine Learning #Engineer
Blog Link - medium.com/campusx/explor…
Blog Link - medium.com/campusx/explor…
#Machinelearning has given the computer systems the abilities to automatically learn without being explicitly #programmed. But how does a machine learning system work? So, it can be described using the #lifecycle of machine learning.
#Machinelearning life cycle is a cyclic process to build an efficient machine learning #project. The main purpose of the life cycle is to find a solution to the problem or project.
Machine learning life cycle involves seven major steps, which are given below:
#DataScience
Machine learning life cycle involves seven major steps, which are given below:
#DataScience

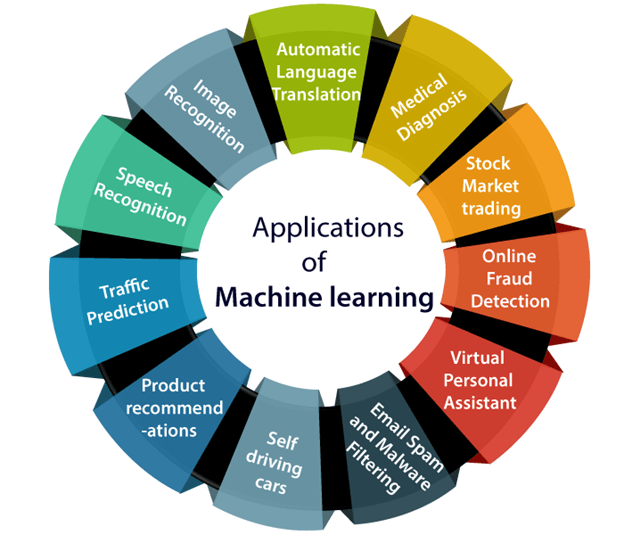
#Machinelearning is a buzzword for today's #technology it is growing very rapidly day by day. We are using machine learning in our daily life even without knowing it such as @Google Maps, Google assistant, #Alexa, etc. Below are some most trending real-world applications of ML 

✅ Image Recognition:
It is one of the most common applications of machine learning. It is used to identify objects, persons, places, #digital images, etc. The popular use case of image recognition and face detection is Automatic friend tagging suggestion
javatpoint.com/applications-o…
It is one of the most common applications of machine learning. It is used to identify objects, persons, places, #digital images, etc. The popular use case of image recognition and face detection is Automatic friend tagging suggestion
javatpoint.com/applications-o…


