Discover and read the best of Twitter Threads about #0DTE
Most recents (5)
NEXT WEEK
The Bear's Take:
•USA #recession is coming
•Bearish daily candlesticks on $SPX and $NDX
• #NDX negative divergences with classic Indis
•Leaders are overextended and some are starting to break
• #JPM collar will stop any #SPX advance at 4320
#SPX #ES_F $SPX $SPY
The Bear's Take:
•USA #recession is coming
•Bearish daily candlesticks on $SPX and $NDX
• #NDX negative divergences with classic Indis
•Leaders are overextended and some are starting to break
• #JPM collar will stop any #SPX advance at 4320
#SPX #ES_F $SPX $SPY
NEXT WEEK
The Bulls' Take
•Breakout of 4200 confirmed
•Momentum is bullish
•Market breadth improved
• $SPX now in official bull market
•Dealers increased their long positions again
• #Gamma is positive
- #CPI will be lower
- #Fed to pause
#ES #SPX $SPY #0dte #options
The Bulls' Take
•Breakout of 4200 confirmed
•Momentum is bullish
•Market breadth improved
• $SPX now in official bull market
•Dealers increased their long positions again
• #Gamma is positive
- #CPI will be lower
- #Fed to pause
#ES #SPX $SPY #0dte #options
NEXT WEEK
Our Take
• Markets are at strong resistance levels, we are expecting a pullback
• Volatile week ahead
• A likely visit to 4220
• Expecting 4320 to stop any $SPX advance
•Expecting #smallcaps to outperform
• #CPI maybe higher, but downtrending
#SPX $SPY $ES_F
Our Take
• Markets are at strong resistance levels, we are expecting a pullback
• Volatile week ahead
• A likely visit to 4220
• Expecting 4320 to stop any $SPX advance
•Expecting #smallcaps to outperform
• #CPI maybe higher, but downtrending
#SPX $SPY $ES_F
NEXT WEEK
The Bear's Take:
•Germany is in recession
• #USA #recession is coming
•Spinning top on Nasdaq
• #NDX negative divergences with classic indis
•Leading stocks are overextended
•Breadth Negative divergences
•4300 is strong resistance
#SPX #ES_F $SPX $SPY #0dte
The Bear's Take:
•Germany is in recession
• #USA #recession is coming
•Spinning top on Nasdaq
• #NDX negative divergences with classic indis
•Leading stocks are overextended
•Breadth Negative divergences
•4300 is strong resistance
#SPX #ES_F $SPX $SPY #0dte
NEXT WEEK
The Bulls's Take
•Daily, weekly and monthly bullish candlestick with high volume
•Big bullish action on Friday, with Breadth Thrust
• $SPX broke important levels on high volume
•Bullish momentum
•Dealers increased their long positions
•Positive #Gamma
#SPX $SPX
The Bulls's Take
•Daily, weekly and monthly bullish candlestick with high volume
•Big bullish action on Friday, with Breadth Thrust
• $SPX broke important levels on high volume
•Bullish momentum
•Dealers increased their long positions
•Positive #Gamma
#SPX $SPX
NEXT WEEK
Our Take
•Momentum is bullish, but indices are near resistance
•A likely visit to 4220 in the next two weeks is expected
•Hard to see a solid break above 4300 this week
•Expecting good performance from the #smallcaps this week
#SPX $SPY $ES_F $SPY #trading
Our Take
•Momentum is bullish, but indices are near resistance
•A likely visit to 4220 in the next two weeks is expected
•Hard to see a solid break above 4300 this week
•Expecting good performance from the #smallcaps this week
#SPX $SPY $ES_F $SPY #trading
"The trend is your friend."
This a common phrase most have heard but many traders have no idea how to catch a trend consistently.
GammaEdge's Market Trend Model (MTM) makes this easy and is something you can implement tomorrow!
Here's how:
This a common phrase most have heard but many traders have no idea how to catch a trend consistently.
GammaEdge's Market Trend Model (MTM) makes this easy and is something you can implement tomorrow!
Here's how:
1/ Every transaction in the market produces an uptick (buying) or a downtick (selling).
One way to measure buying and selling is through the Cumulative Tick, the backbone of our MTM.
Before going too far down the rabbit hole, here is a primer on the CT:
One way to measure buying and selling is through the Cumulative Tick, the backbone of our MTM.
Before going too far down the rabbit hole, here is a primer on the CT:
2/ Tick is transactional — it triggers with each stock transaction.
An uptick occurs when the stock price increases, no matter if we buy 1 share or 1,000 shares.
It is similar for the downtick scenario too.
We then keep track of these upticks and downticks...
An uptick occurs when the stock price increases, no matter if we buy 1 share or 1,000 shares.
It is similar for the downtick scenario too.
We then keep track of these upticks and downticks...
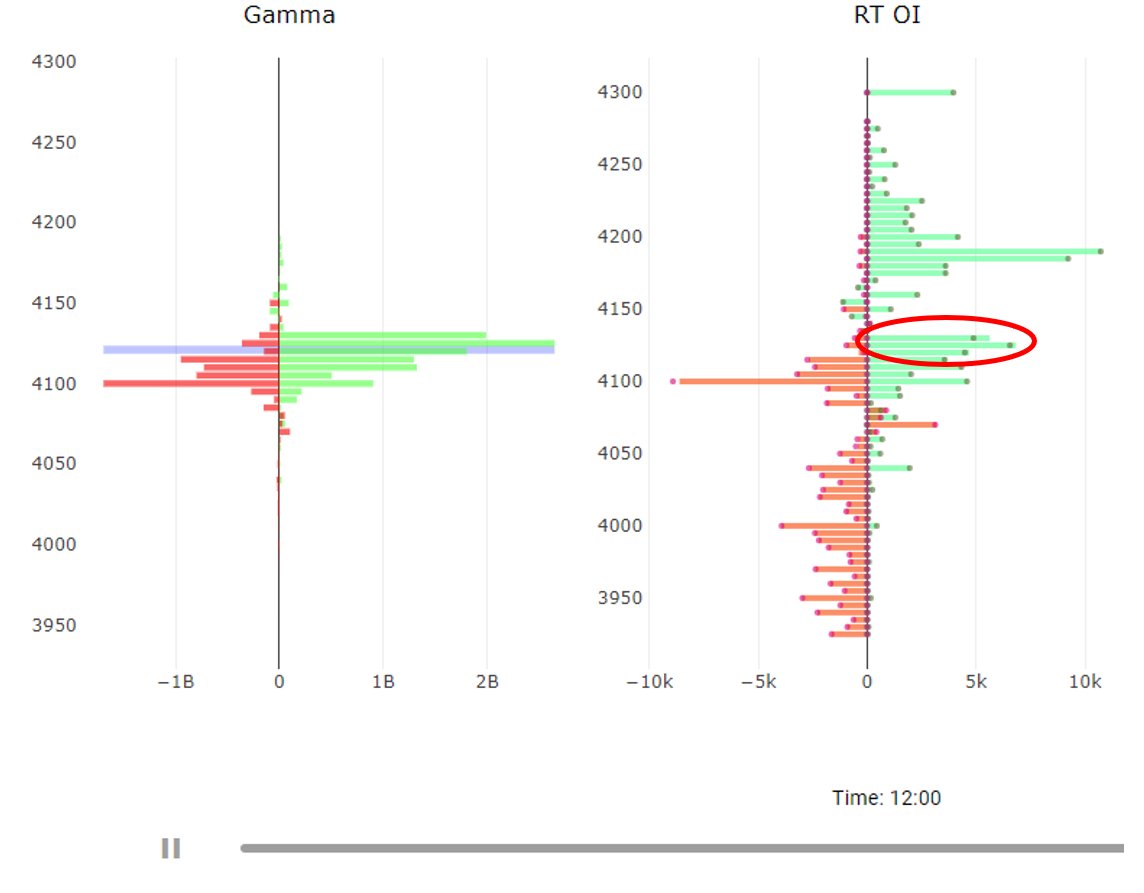
A longer 🧵today to explain what we saw. This analysis is using tick-level OPRA data vs. a heuristics-based RT OI estimate currently on our feed. We will look to roll this out soon.
Day started normally, with LG at 4100.
Day started normally, with LG at 4100.

However, by 10:30, we saw some very interesting behaviour. Specifically, we saw #0DTE bulls acting very aggressive, including selling ATM puts at 4120 strike. 

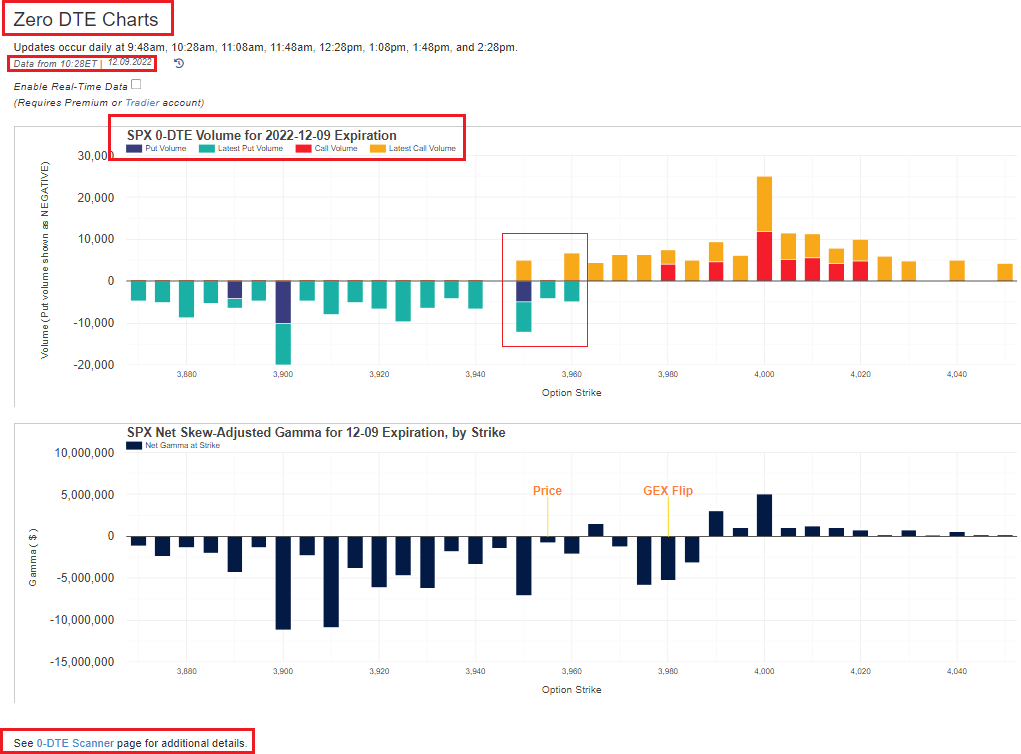
$SPX #0DTE scanner and $GEX charts from @TradeVolatility
3900 puts and 4000 calls continue to attract the highest number of bets
4000 call has the largest volume change
The struggle area now: 3950/3960
The safest 0DTE play is selling the 3900/4000 strangle for $1.50
#SPX #ES
3900 puts and 4000 calls continue to attract the highest number of bets
4000 call has the largest volume change
The struggle area now: 3950/3960
The safest 0DTE play is selling the 3900/4000 strangle for $1.50
#SPX #ES

We are going to sell the 3935/4000 strangle for $4.25
*Price went lower since the screenshot
#ES_F #trading #options #daytrading #futures
*Price went lower since the screenshot
#ES_F #trading #options #daytrading #futures


